Suzano: Q2 EBITDA up 13.9% but net profit down 60.4% – the gap is a one-off base effect

On August 13 Suzano reported Q2 2026 results. Revenue fell 4.3% year on year to $2,282.4 million, EBITDA rose 13.9% to $1,171.2 million, and net profit dropped 60.4% to $355.9 million. The EBITDA margin improved to 51.3% from 43.1%, but the net margin narrowed to 15.6% from 37.7%. With an EV/EBITDA of 5.79 and a dividend yield of 0.01%, the stock looks neutral: operating momentum is strong, but last year's profit was inflated by one-offs and leverage remains at 3.04x EBITDA.
Key takeaways
— Q2 revenue fell 4.3% year on year to $2,282.4 million – the first decline after four quarters of growth
— EBITDA rose 13.9% to $1,171.2 million and the margin improved to 51.3% from 43.1% – the gain came from cost cuts, not revenue
— Net profit dropped 60.4% to $355.9 million, but last year's figure was inflated by one-offs rather than operating performance
— Leverage stands at 3.04x EBITDA with net debt of $12,725.7 million – still high, but the company is managing it
— Operating cash flow over the last twelve months was $3,300.0 million, while quarterly capex was $493.1 million, leaving room for payouts
— The trailing twelve-month dividend yield is 0.01%, well below the key rate, making the stock unattractive for income
— The portal model shows 3% upside to fair value – the market already prices in current commodity prices
Attractiveness
Key figures, USD bn
| Metric | Q2 2025 | Q2 2026 | Change |
|---|---|---|---|
| Revenue | 2.38 | 2.28 | -4.3% |
| EBITDA | 1.03 | 1.17 | +13.9% |
| Operating profit | 0.52 | 0.55 | +6.5% |
| Net profit | 0.90 | 0.36 | -60.4% |
| Operating cash flow | 0.78 | 0.86 | +10.5% |
| Capex | 0.57 | 0.49 | -14.2% |
| EBITDA margin | 43.1% | 51.3% | +8.2 pp |
| Net margin | 37.7% | 15.6% | -22.1 pp |
Q2 revenue fell 4.3% year on year to $2,282.4 million – the first decline after four quarters of growth
In Q2 2026, Suzano's revenue was $2,282.4 million, down 4.3% from a year earlier. This is the first decline after four quarters of growth: in Q1 2026 revenue rose 6.3%, in Q4 2025 – 49.0%, in Q3 – 6.0%, in Q2 – 16.4%. The drop interrupts the positive trend that had been in place since mid-2025.
The revenue decline came amid falling pulp and paper prices, a key driver for Suzano. The company does not disclose segment details in the provided data, but the overall trend points to deteriorating pricing. Volumes likely remained stable or slightly higher, but that was not enough to offset price pressure.
Despite lower revenue, the company maintains high operating efficiency, as evidenced by EBITDA growth. However, further price declines could intensify pressure on the top line in coming quarters.
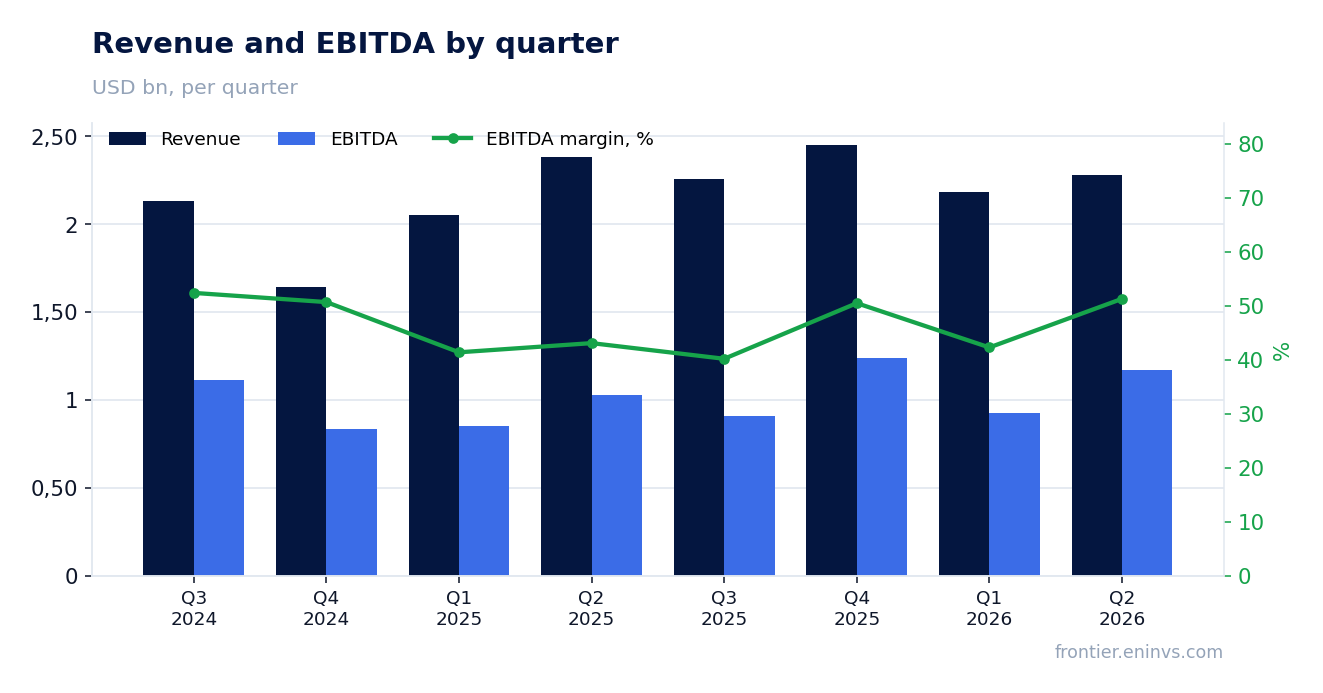
EBITDA rose 13.9% to $1,171.2 million and the margin improved to 51.3% from 43.1% – the gain came from cost cuts, not revenue
EBITDA in Q2 2026 reached $1,171.2 million, up 13.9% year on year. The EBITDA margin rose to 51.3% from 43.1% a year earlier. Such margin expansion on falling revenue points to significant cost reductions or an improved cost structure.
EBITDA growth on lower revenue means the company cut variable costs, possibly through lower raw material, energy, or logistics expenses. An efficiency program may also have contributed. In any case, operating efficiency improved, which is a positive signal.
Note that EBITDA excludes one-off items that affected net profit. Thus, EBITDA growth reflects operating performance rather than accounting effects.
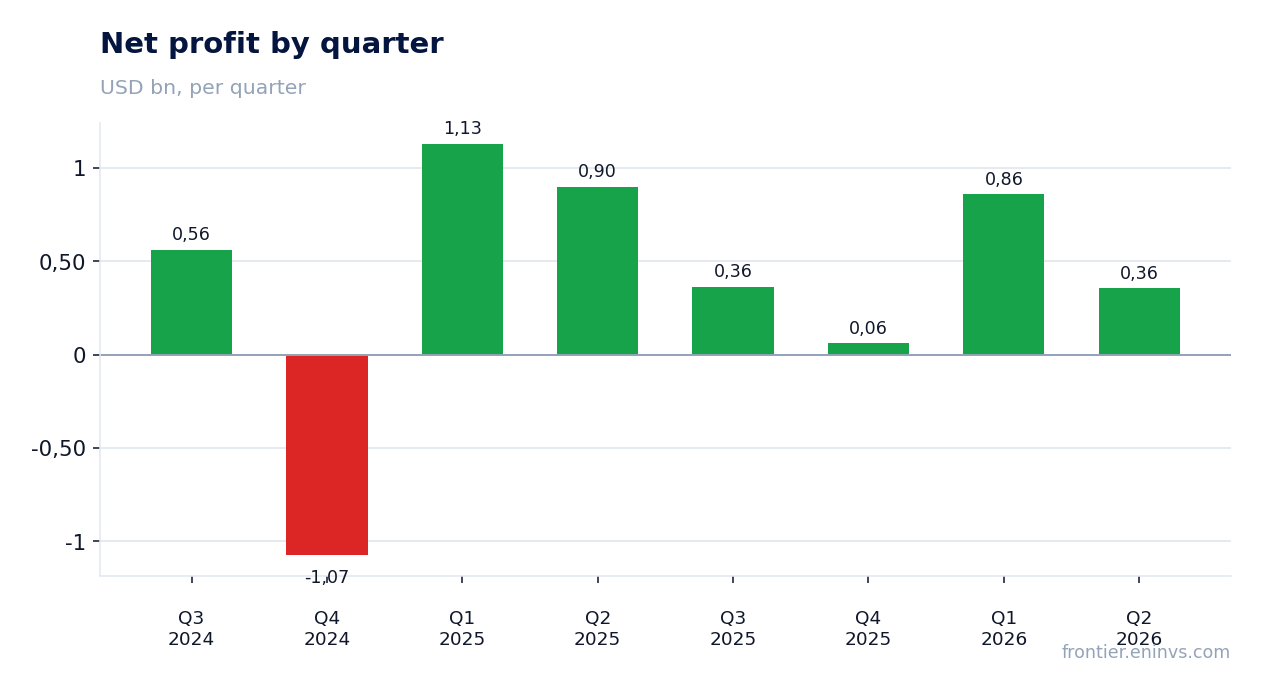
Net profit dropped 60.4% to $355.9 million, but last year's figure was inflated by one-offs rather than operating performance
Net profit in Q2 2026 was $355.9 million, down 60.4% from a year earlier. The net margin fell to 15.6% from 37.7%. However, this sharp decline is not due to deteriorating operations but to one-off factors that inflated last year's base.
In prior periods, the company recorded significant one-off gains; notably, in Q1 2025 net profit was $1,129.6 million, well above operating profit. This points to foreign exchange or other non-operating items. In Q2 2025, net profit was also high at $898.9 million.
Thus, the current drop in net profit is largely a high-base effect, not a business deterioration. Operating profit in Q2 2026 was $549.1 million, lower than a year earlier ($515.7 million), but given EBITDA growth and lower depreciation, this is not critical.
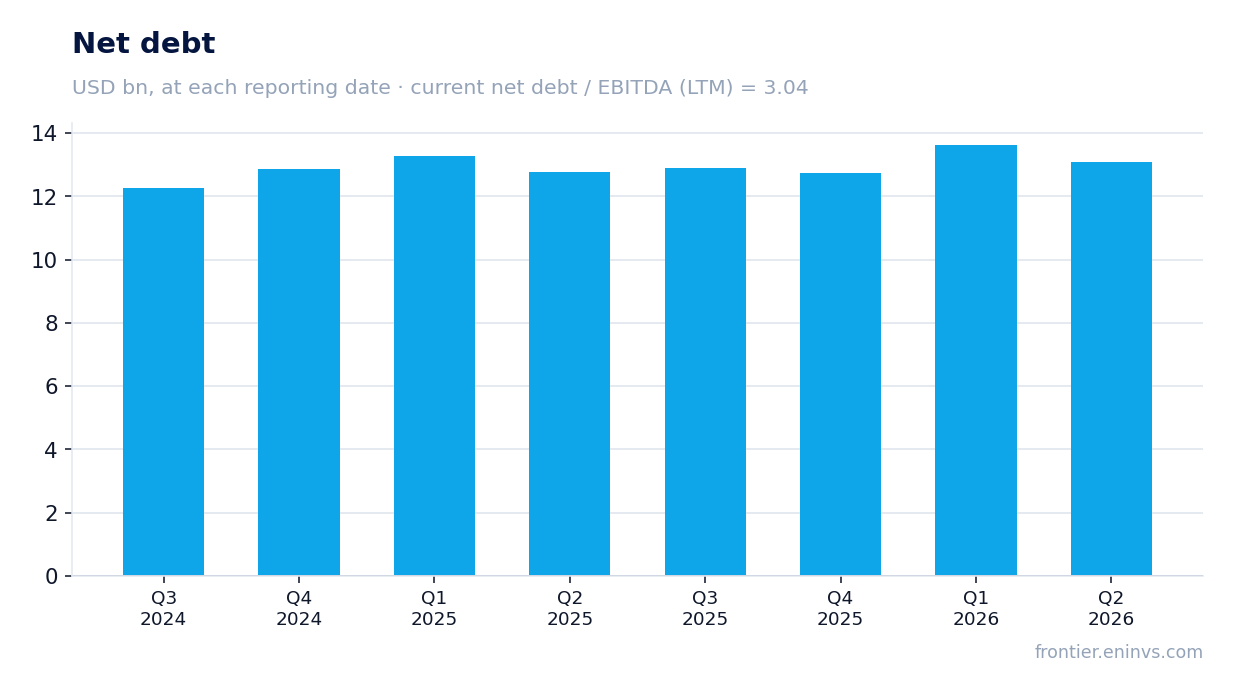
Leverage stands at 3.04x EBITDA with net debt of $12,725.7 million – still high, but the company is managing it
Suzano's net debt at the end of Q2 2026 was $12,725.7 million, down $0.5 billion from the previous reporting date and up $0.3 billion from a year earlier. The net debt to EBITDA ratio over the last twelve months is 3.04. This is a high level that warrants attention, but the company demonstrates the ability to service it.
EBITDA over the last twelve months was $4,180.6 million, covering interest expenses and providing a comfortable cushion. Operating cash flow over the last twelve months was $3,300.0 million, enough to fund capex and pay dividends.
The $0.5 billion sequential reduction in net debt is a positive signal, but the $0.3 billion annual increase suggests the company is not yet sustainably reducing debt. If current product prices hold, leverage is likely to remain at current levels.
Operating cash flow over the last twelve months was $3,300.0 million, while quarterly capex was $493.1 million, leaving room for payouts
Suzano's operating cash flow over the last twelve months was $3,300.0 million. In Q2 2026 it was $860.3 million, higher than in Q1 ($578.1 million) but lower than in Q2 2025 ($778.5 million). Cash flow dynamics remain volatile but generally sufficient to fund investments.
Capital expenditures in Q2 2026 were $493.1 million, lower than in the previous quarter ($598.4 million) and below the four-quarter average. Lower capex frees up cash that can be directed to dividends or debt reduction.
Free cash flow (operating cash flow minus capex) in Q2 was about $367.2 million, a positive result. This allows the company to maintain shareholder payouts, although the dividend yield remains low.
The trailing twelve-month dividend yield is 0.01%, well below the key rate, making the stock unattractive for income
Suzano's dividend yield over the last twelve months was 0.01%. This is an extremely low figure that offers little appeal to income-oriented investors. For comparison, the key rate in Russia is significantly higher, making dividend stocks less attractive relative to debt instruments.
The company does not disclose the size of the last dividend or its link to profit in the provided data. However, the low yield indicates that either the company directs most of its profit to investments and debt reduction, or profit was low. Given high capex and leverage, priority is given to financing development rather than payouts.
Substantial dividend growth should not be expected this year, as net profit declined and leverage remains high. Dividend policy is likely to be conservative, and the yield will stay low.
The portal model shows 3% upside to fair value – the market already prices in current commodity prices
According to the portal model, Suzano's fair value implies 3% upside to the current market price. This means the market broadly values the company adequately, given current pulp and paper prices. The model re-prices EBITDA at current commodity prices and applies a target EV/EBITDA multiple.
The current EV/EBITDA over the last twelve months is 5.79, and P/E is 5.26. For comparison, the three-year historical average is not provided, so it is impossible to say whether the current multiple is above or below its historical level. However, the absolute values appear low, which could indicate undervaluation, but given commodity market risks, this may be justified.
The mere 3% upside suggests the stock is trading near fair value. A significant re-rating would require either higher product prices or improved operating performance not currently priced in.
Valuation on the latest reported figures
| Metric | Value |
|---|---|
| Market cap | 11.5 bn USD |
| P/E (LTM) | 5.3 |
| EV/EBITDA (LTM) | 5.8 |
| P/B | 1.43 |
| Net debt / EBITDA (LTM) | 3.04 |
| Operating cash flow (LTM) | 3.30 bn |
| ROE | 14.7% |
| Dividend yield (12m) | 0.0% |
Bottom line
Suzano delivered a strong operating result: EBITDA rose 13.9% and the margin improved to 51.3% on cost reductions. However, net profit fell 60.4% due to a high base last year when one-offs inflated the result. Leverage remains high at 3.04x EBITDA, and the dividend yield is negligible at 0.01%. The stock trades near fair value on the portal model (+3% upside), and with current commodity prices, potential is limited. The verdict is neutral: operating efficiency impresses, but lack of revenue growth and low dividends do not provide sufficient grounds to buy.
Open the company's financial profile SUZ →
See also: market overview · valuation map · stock screeners