Trulieve Cannabis: revenue is falling while a one-off $406m loss wipes out profit

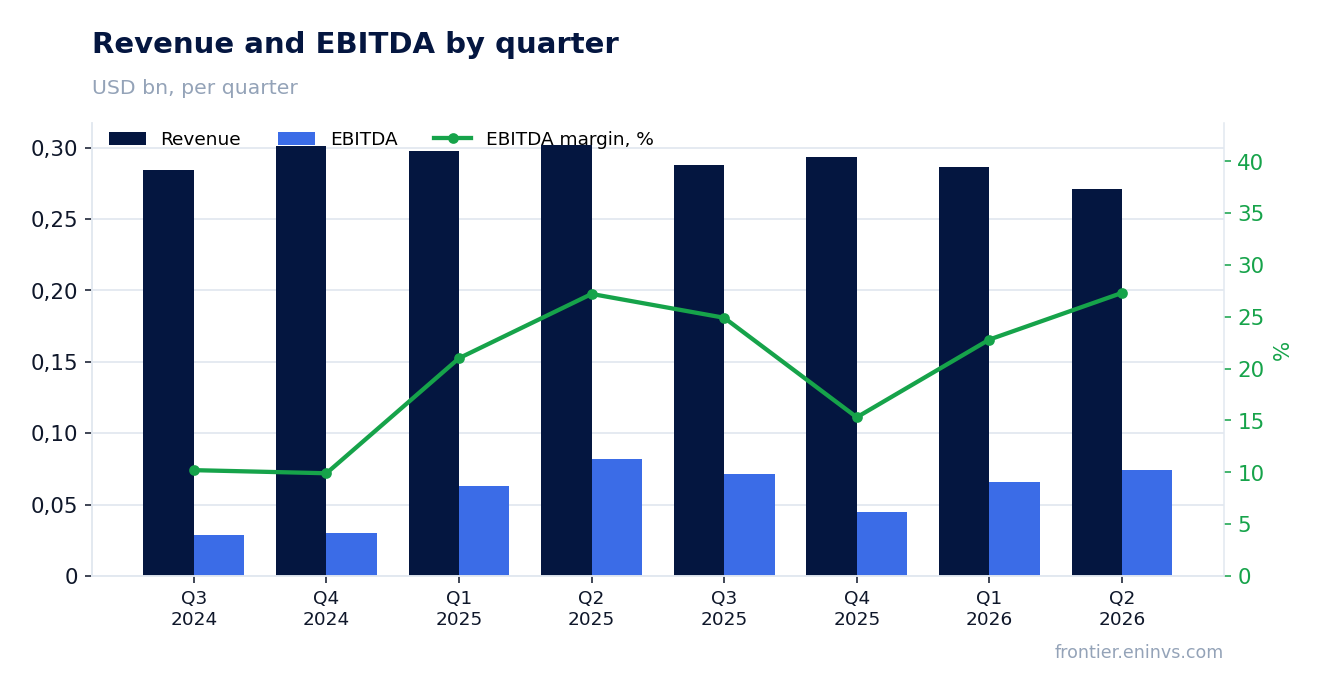
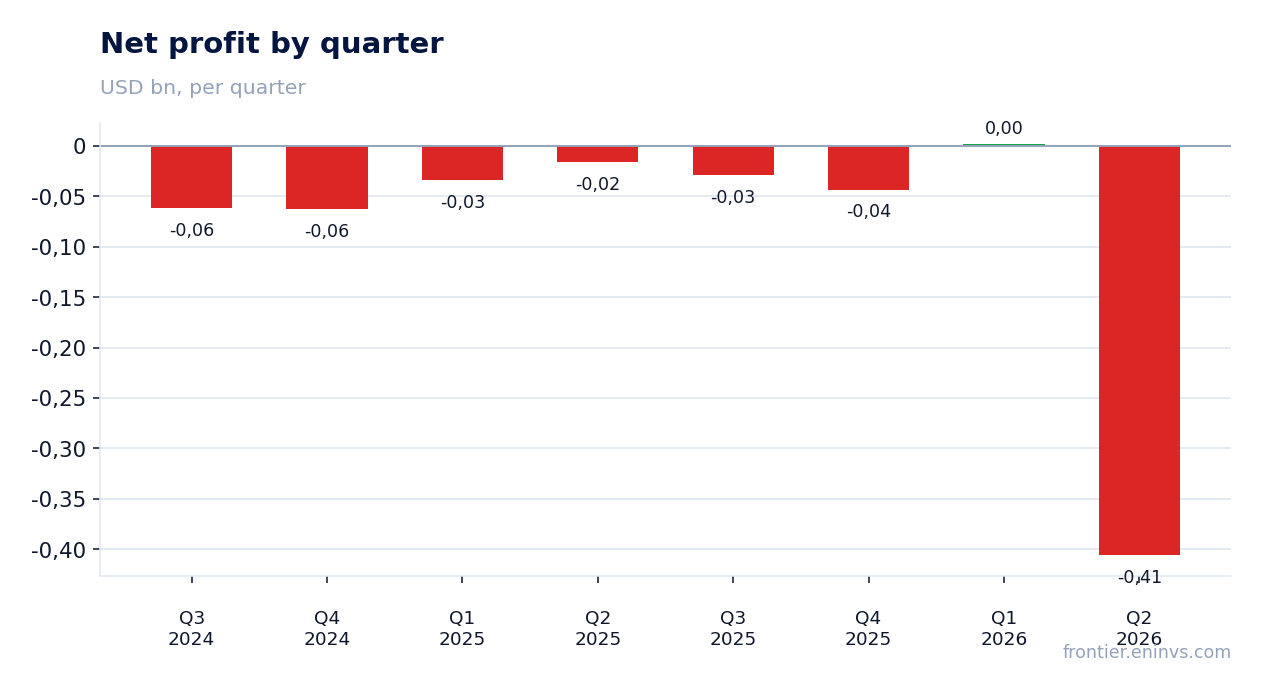
Trulieve Cannabis reported second-quarter 2026 results. Revenue fell 10.3% year on year to $270.952m, EBITDA declined 9.9% to $73.952m, and the net loss was $405.975m versus a $16.111m loss a year earlier. At the same time, the EBITDA margin was almost unchanged at 27.3% versus 27.2%, and net debt turned negative at -$36.029m. In our view, the stock looks attractive: the LTM EV/EBITDA multiple of 6.47x is moderate, and the portal model implies 31% upside to fair value, although the revenue decline and the one-off loss warrant caution.
Key takeaways
— Revenue fell 10.3% year on year – the steepest decline in recent quarters
— EBITDA margin held at 27.3% despite the revenue drop
— The $406m net loss is one-off, not operational
— Free cash flow remains positive, but capex is rising
— Net debt turned negative, changing the risk assessment
— LTM EV/EBITDA of 6.47x is below the average of recent years
— The portal model implies 31% upside to fair value
Attractiveness
Key figures, USD bn
| Metric | Q2 2025 | Q2 2026 | Change |
|---|---|---|---|
| Revenue | 0.30 | 0.27 | -10.3% |
| EBITDA | 0.08 | 0.07 | -9.9% |
| Operating profit | 0.05 | 0.03 | -33.9% |
| Net profit | -0.02 | -0.41 | — |
| Operating cash flow | 0.09 | 0.05 | -38.0% |
| Capex | 0.01 | 0.02 | +81.6% |
| EBITDA margin | 27.2% | 27.3% | +0.1 pp |
| Net margin | -5.3% | -149.8% | -144.5 pp |
Revenue fell 10.3% year on year – the steepest decline in recent quarters
In the second quarter of 2026, Trulieve Cannabis revenue was $270.952m, down 10.3% year on year. This is the steepest decline in recent quarters: the first quarter saw a 3.7% drop, the fourth quarter of 2025 a 2.7% drop, while in the third quarter of 2025 revenue still grew 1.4%. The negative trend has accelerated, and this is the main warning sign in the report.
The revenue decline comes amid a broad contraction in the Florida cannabis market, where the company historically generated most of its income. The report does not disclose the reasons, but the quarter-on-quarter fall – from $286.754m in Q1 to $270.952m in Q2 – points to weakening demand or intensifying competition. For investors, this means that even with a stable margin, absolute EBITDA may continue to decline.
EBITDA margin held at 27.3% despite the revenue drop
EBITDA in the second quarter of 2026 was $73.952m, down 9.9% year on year. However, the EBITDA margin remained almost unchanged at 27.3% versus 27.2% a year earlier. The company managed to maintain profitability despite falling revenue, indicating cost control.
In absolute terms, EBITDA declined less than revenue: while revenue fell 10.3%, EBITDA fell only 9.9%. This means operating expenses were cut faster than income. Nevertheless, a 27.3% margin is a level that could suffer if the revenue decline continues. In the next report, it is important to see whether this threshold holds.
The $406m net loss is one-off, not operational
The net loss in the second quarter of 2026 was $405.975m versus a loss of $16.111m a year earlier. Such a sharp increase in the loss is almost certainly due to one-off write-offs – asset impairments or litigation settlements. Operating profit remained positive at $34.799m, although it declined from $52.634m a year earlier.
The gap between operating profit and net loss is huge: $34.799m of operating profit turned into a $405.975m loss. This means large non-cash or one-off items occurred below the operating line. For business valuation, operating dynamics matter more than net profit. If the one-off factors do not recur, net profit could return to positive territory in coming quarters, as it did in the first quarter of 2026 ($2.283m).
Free cash flow remains positive, but capex is rising
Operating cash flow in the second quarter of 2026 was $53.141m, down from $85.702m a year earlier. Capital expenditures rose to $21.011m from $11.570m a year earlier. Free cash flow therefore declined but remained positive at about $32.1m.
The increase in capex may be linked to investments in new markets or production upgrades. Importantly, the company continues to generate cash even as revenue falls. Over the trailing twelve months, operating cash flow was $272.8m, covering capital expenditures and allowing debt servicing. However, if revenue continues to decline, pressure on cash flow will intensify.
Net debt turned negative, changing the risk assessment
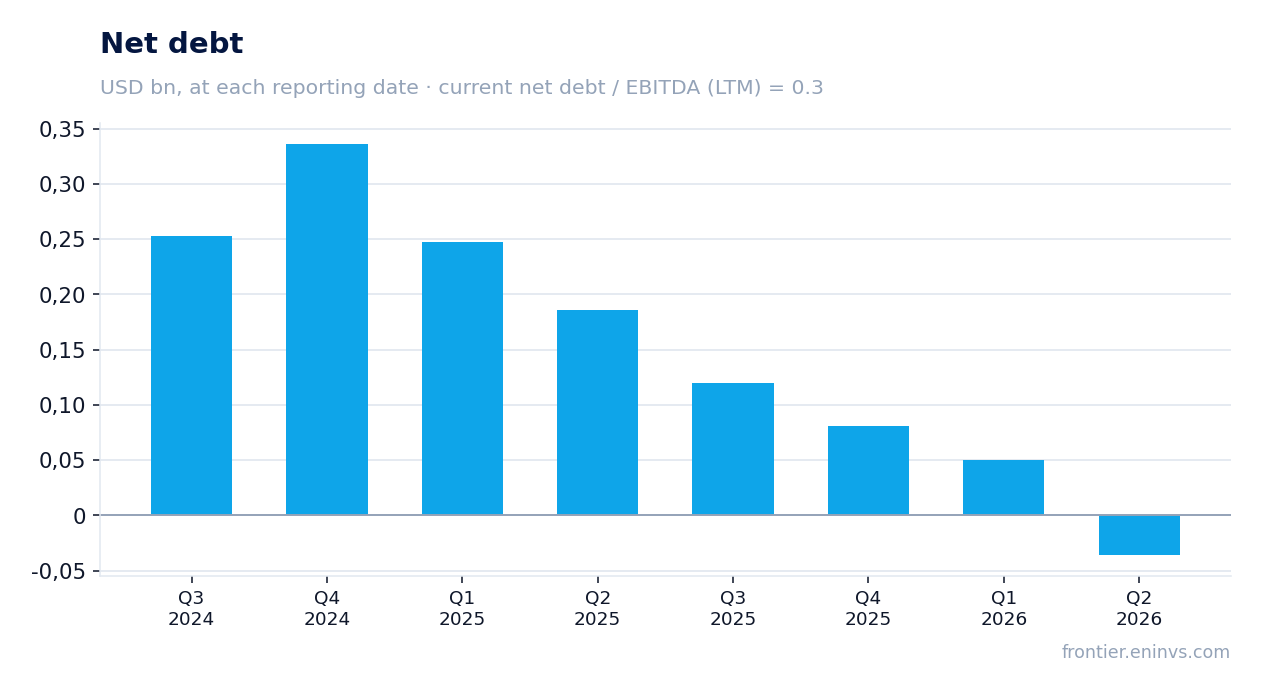
Net debt at the end of the second quarter of 2026 was -$36.029m – for the first time in recent quarters, the company has more cash than debt. A year earlier, net debt was $185.725m, and in the first quarter of 2026 it was $49.930m. The reduction in debt burden came amid positive operating cash flow.
The net debt to EBITDA LTM ratio is 0.3 – a very low level. The company has virtually no debt burden, giving it resilience if market conditions worsen further. However, negative net debt also means a significant portion of cash is not working in the business. The question is how the company will use this liquidity – for development or returning it to shareholders.
LTM EV/EBITDA of 6.47x is below the average of recent years
The LTM EV/EBITDA multiple is 6.47x with a market capitalisation of $1,691.092m and LTM EBITDA of $273.9m. For comparison, in previous years the company traded at higher multiples when revenue was growing. The current level looks moderate, especially given the low debt burden.
However, it is important to understand that LTM EBITDA includes stronger previous quarters. If the current revenue decline continues, LTM EBITDA will decrease, and the multiple will rise even if the share price remains unchanged. Therefore, valuation based on the current multiple may be deceptively low. The portal model, which reprices EBITDA at current commodity prices, implies 31% upside to fair value.
The portal model implies 31% upside to fair value
According to the portal model, which reprices EBITDA at current commodity prices and applies a target EV/EBITDA multiple, the fair value of Trulieve Cannabis shares is 31% above the current market price. This is our own estimate, not a market consensus. It assumes the company can maintain or improve EBITDA at the current level.
The 31% upside looks attractive, but it depends entirely on revenue stabilising. If the decline continues, the model will need to be revised downwards. Nevertheless, even accounting for risks, the current valuation leaves room for growth, especially with low debt and positive cash flow.
Valuation on the latest reported figures
| Metric | Value |
|---|---|
| Market cap | 1.69 bn USD |
| EV/EBITDA (LTM) | 6.5 |
| P/B | 1.48 |
| Net debt / EBITDA (LTM) | 0.30 |
| Operating cash flow (LTM) | 0.27 bn |
| ROE | -169.4% |
Bottom line
Bottom line: Trulieve Cannabis reported weak revenue but maintained its margin and strengthened its balance sheet. The one-off $406m loss distorts the picture – operating profit remains positive. The company generates cash flow and has negative net debt, reducing risks. However, the 10.3% revenue decline is a warning sign, and without stabilisation in revenue, EBITDA growth is unlikely. At the current EV/EBITDA of 6.47x and 31% upside on the portal model, the stock looks attractive, but only for investors willing to tolerate volatility and wait for a trend reversal.
Open the company's financial profile TCNNF →
See also: market overview · valuation map · stock screeners