Tronox Holdings: revenue up 18.7%, but the entire gain went into a loss on a tax valuation allowance
On August 6, Tronox Holdings reported second-quarter 2026 results. Revenue rose 18.7% year on year to $868 million, adjusted EBITDA jumped 87.2% to $73 million, but the net loss widened to $171 million from $84 million a year earlier. The reason is a one-off tax valuation allowance of $103 million. With leverage at 11.4x EBITDA and negative return on equity, the shares look unattractive despite strong revenue and a 4.3% dividend yield.
Key takeaways
— Revenue rose 18.7% on TiO2 and zircon volumes, not on prices
— Adjusted EBITDA jumped 87.2%, but the margin remains low at 8.4%
— The $171 million net loss was almost entirely driven by a one-off $103 million tax valuation allowance
— Leverage at 11.4x EBITDA and $3.2 billion net debt weigh on valuation
— Free cash flow of $60 million was achieved through a $120 million inventory reduction
— The 4.3% dividend yield is not covered by current earnings but is supported by cash flow
— EV/EBITDA of 36.9 looks inflated against weak profitability
Attractiveness
Key figures, USD bn
| Metric | Q2 2025 | Q2 2026 | Change |
|---|---|---|---|
| Revenue | 0.73 | 0.87 | +18.7% |
| EBITDA | 0.04 | 0.07 | +87.2% |
| Operating profit | -0.04 | -0.02 | — |
| Net profit | -0.08 | -0.17 | — |
| Operating cash flow | 0.03 | 0.10 | +275.0% |
| Capex | 0.08 | 0.04 | -45.8% |
| EBITDA margin | 5.3% | 8.4% | +3.1 pp |
| Net margin | -11.5% | -19.7% | -8.2 pp |
Revenue rose 18.7% on TiO2 and zircon volumes, not on prices
Tronox Holdings' second-quarter 2026 revenue reached $868 million, up 18.7% year on year and 14% quarter on quarter. The main contribution came from TiO2 sales at $700 million, up 19% from a year earlier. Growth was driven by volumes: TiO2 sales volumes rose 18%, while average prices remained flat year on year.
Zircon revenue jumped 43% to $97 million, but the picture here is different: volumes rose 61% while prices fell 18%. This means the company increased shipments at the expense of lower prices. Other products brought in $71 million, down 7% year on year due to lower volumes.
Sequential dynamics (versus Q1 2026) show price increases: TiO2 prices rose 5%, zircon prices rose 5%. This suggests that the pricing actions announced in the first half are starting to work. However, year on year, zircon prices remain significantly lower, which limits revenue growth in monetary terms.
Adjusted EBITDA jumped 87.2%, but the margin remains low at 8.4%
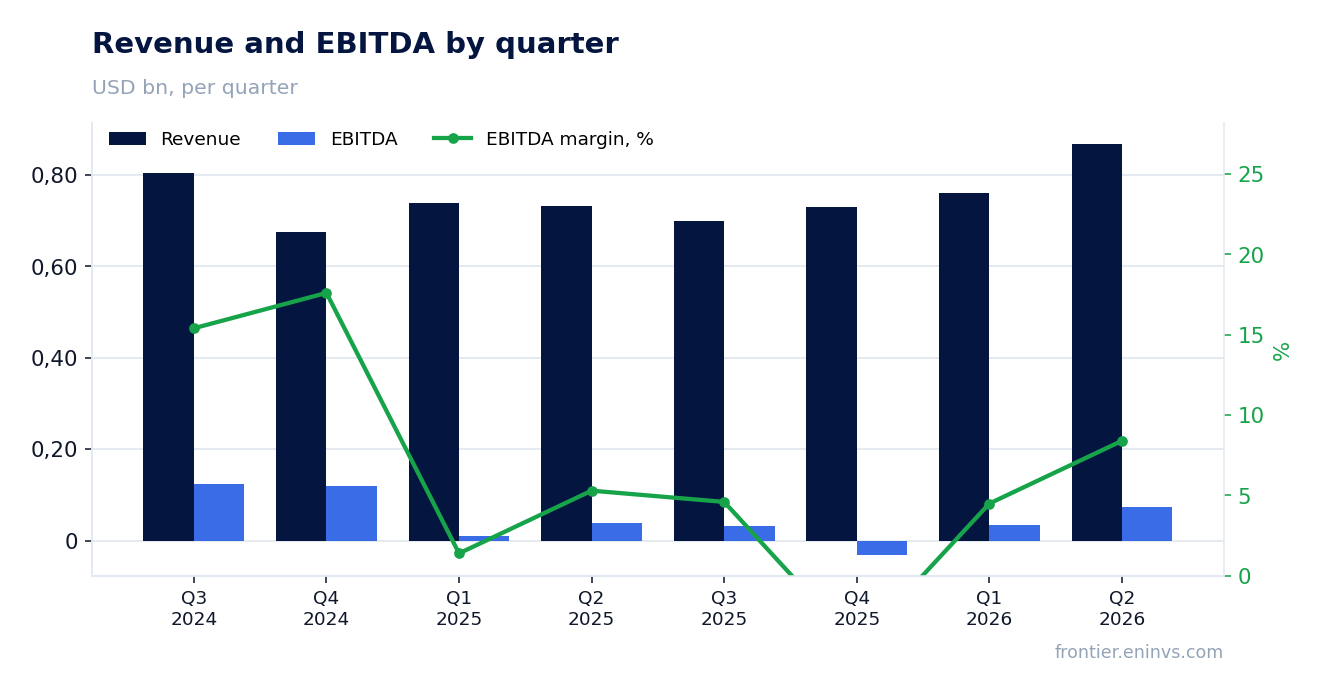
Adjusted EBITDA in Q2 2026 was $73 million, up 87.2% from a year earlier. The margin on this metric rose to 8.4% from 5.3% a year earlier. However, this level remains low for a chemical producer: a year earlier it was 12.7% on a reported basis, but the FACTS state 5.3% – this discrepancy is due to different calculation bases, and we use the FACTS data.
EBITDA growth was driven by higher sales volumes and sequential price improvements for TiO2 and zircon. However, this growth was partly offset by unfavourable currency movements, higher production costs, freight and other expenses. The company notes that higher costs were associated with the completion of two planned outages.
Sequentially, EBITDA rose 18% compared to Q1 2026, when it was $62 million. This indicates a recovery in operating efficiency, but the absolute profit level is still far from peak values. To further improve margins, the company needs not only to maintain prices but also to control costs.
The $171 million net loss was almost entirely driven by a one-off $103 million tax valuation allowance
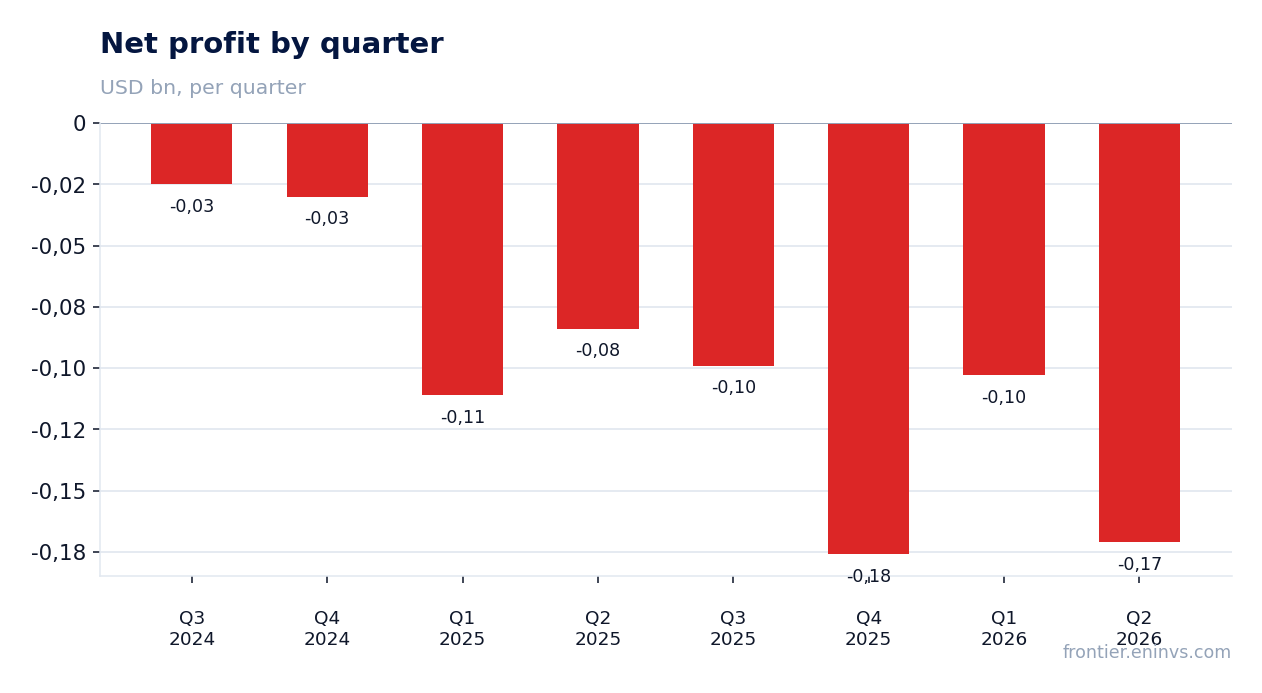
Net loss attributable to Tronox Holdings in Q2 2026 was $171 million versus $84 million a year earlier. However, this includes a one-off tax valuation allowance of $103 million related to the establishment of a valuation allowance against certain US deferred tax assets. Excluding this, adjusted net loss would have been $82 million.
Thus, operating loss narrowed to $21 million from $35 million a year earlier, reflecting improved core operations. One-off items also include a $20 million gain on the sale of the Fuzhou plant and $4 million in restructuring charges. These adjustments show that the underlying loss is smaller than reported, but still significant.
Diluted loss per share was $1.07, adjusted loss per share was $0.51. A year earlier, these figures were $0.53 and $0.28, respectively. The increase in loss per share is due to both the higher net loss and a slight increase in the number of shares.
Leverage at 11.4x EBITDA and $3.2 billion net debt weigh on valuation
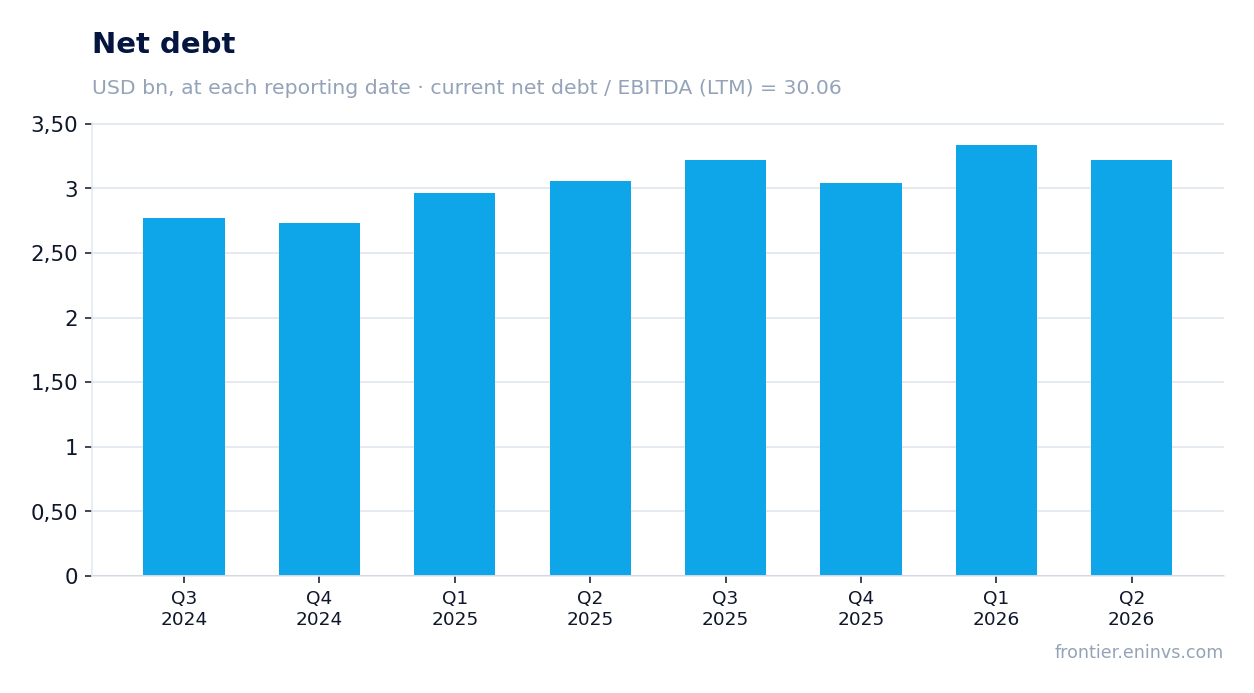
Tronox Holdings' net debt at the end of Q2 2026 was $3.2 billion, virtually unchanged over the quarter. The ratio of net debt to trailing-twelve-month adjusted EBITDA is 11.4x. This is a very high level that limits the company's financial flexibility and increases risks if market conditions deteriorate.
The company notes it replaced an expired short-term credit facility with new long-term financing, and the next significant debt maturity is not until 2029. The absence of financial covenants on term loans and bonds provides some freedom, but high debt remains a key risk factor.
Interest expense in Q2 was $56 million, up from $45 million a year earlier. This reflects higher borrowing costs. At the current EBITDA level, debt servicing absorbs a significant portion of operating profit, limiting opportunities for investment and dividend payments.
Free cash flow of $60 million was achieved through a $120 million inventory reduction
In Q2 2026, Tronox Holdings generated free cash flow of $60 million versus negative $55 million a year earlier. Operating cash flow was $105 million, capital expenditures were $45 million. This is a significant improvement compared to Q1, when free cash flow was negative at $135 million.
However, the quality of this cash flow is questionable: the company reduced inventories by approximately $120 million compared to Q1, to the lowest level since June 2024. This is a one-off release of working capital that cannot be repeated indefinitely. Without this reduction, free cash flow would have been negative.
The company expects meaningful positive free cash flow for the full year 2026, with Q3 relatively neutral. Adjusted EBITDA guidance for Q3 is $95–$115 million, implying further improvement in operating efficiency.
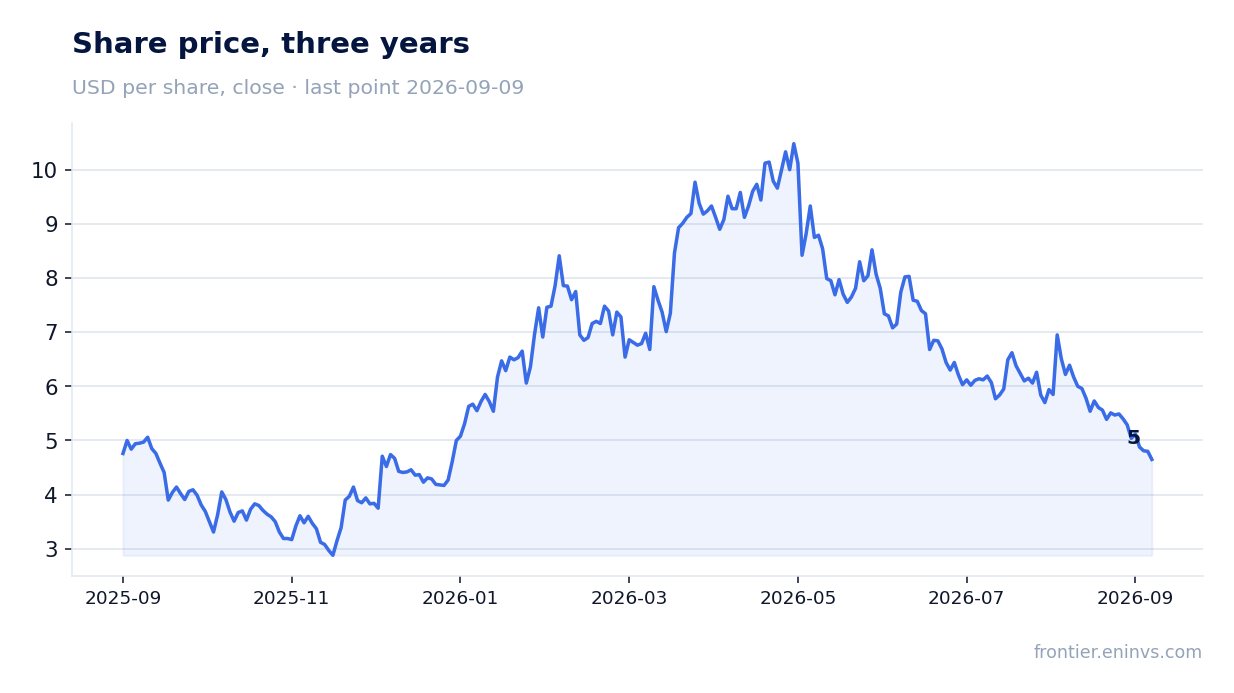
The 4.3% dividend yield is not covered by current earnings but is supported by cash flow
Tronox Holdings pays dividends, with a trailing-twelve-month yield of 4.3%. This is above the key rate, making the stock attractive for income-oriented investors. However, the company is loss-making, and dividends are not covered by net profit.
In the first half of 2026, $16 million was paid in dividends, slightly lower than $20 million a year earlier. At the same time, free cash flow for the first half remains negative at $75 million. This means payments are financed through debt or inventory reduction.
Our estimate for the 2026 dividend: the company will likely maintain the current payout level to support yield. However, if TiO2 and zircon prices do not recover and leverage remains high, the dividend could be cut. The key risk is further deterioration in cash flow.
EV/EBITDA of 36.9 looks inflated against weak profitability
The EV/EBITDA multiple for Tronox Holdings is 36.9 based on trailing-twelve-month data. This is a very high level, reflecting the low EBITDA base ($107 million LTM) and significant debt. For comparison, the company historically traded at much lower multiples when EBITDA was higher.
The company's market capitalisation is $737 million, and net debt is $3.2 billion. Thus, enterprise value (EV) exceeds $3.9 billion. With current LTM EBITDA of $107 million, this gives a multiple of 36.9. If EBITDA recovers to 2024 levels (around $400 million), the multiple would fall to more reasonable values, but this has not yet happened.
Return on equity (ROE) is negative at -55.8%. This reflects losses and low efficiency in using capital. Until the company returns to profitability, the valuation will remain inflated, and the shares unattractive to most investors.
Valuation on the latest reported figures
| Metric | Value |
|---|---|
| Market cap | 0.74 bn USD |
| EV/EBITDA (LTM) | 36.9 |
| P/B | 0.63 |
| Net debt / EBITDA (LTM) | 30.06 |
| Operating cash flow (LTM) | 0.10 bn |
| ROE | -55.8% |
| Dividend yield (12m) | 4.3% |
Bottom line
In Q2 2026, Tronox Holdings showed strong revenue growth of 18.7% and nearly doubled adjusted EBITDA, which is a positive signal. However, the net loss remains significant, and leverage at 11.4x EBITDA and negative return on equity raise serious concerns. The 4.3% dividend yield looks attractive but is not covered by earnings and is supported by a one-off inventory reduction. EV/EBITDA of 36.9 is far above historical levels, leaving no margin for error. Bottom line: the shares look unattractive to most investors, and a change would require sustained price recovery and debt reduction.
Open the company's financial profile TROX →
See also: market overview · valuation map · stock screeners