UFP Industries: revenue grew for the first time in a year, but acquisitions did the work while profit fell 17.7%
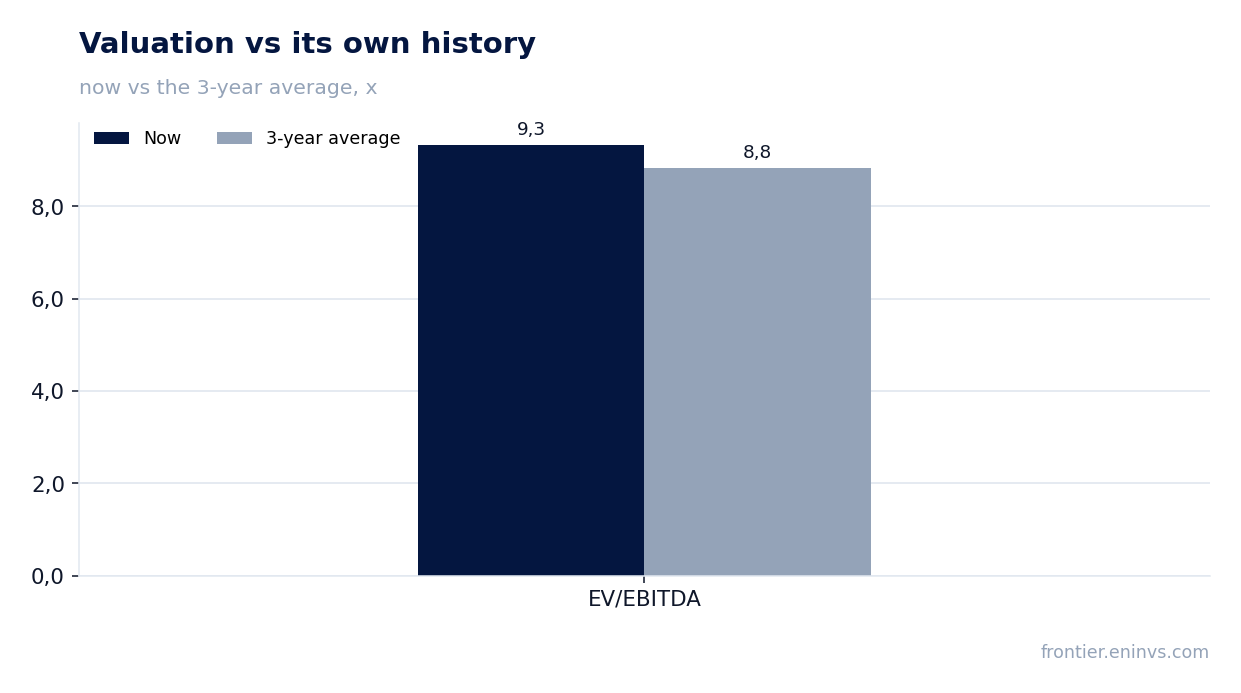
On July 29 UFP Industries reported second-quarter 2026 results. Revenue rose 2.6% year on year to $1,882.9 million – the first increase since early 2025 – but organic sales added only 1%, with 2% coming from acquisitions. Adjusted EBITDA fell 11.5% to $154.5 million and net profit dropped 17.7% to $82.9 million, with the EBITDA margin narrowing from 9.5% to 8.2% as freight costs rose by $27 million. At $91.01 the stock trades at 9.3 EV/EBITDA against its own three-year average of 8.8, while the portal model implies 44% downside to fair value – on a 1.74% dividend yield the share looks rather unattractive.
Key takeaways
— Revenue grew for the first time in a year, but organic growth contributed only 1%
— Freight ate the margin: transport costs rose by $27 million
— Profit fell 17.7%, and there are no one-off items in the report to cushion it
— Net debt is negative and liquidity is $1.9 billion, but capex is rising to $175–200 million
— The dividend was raised 3%, but a 1.74% yield does not even cover inflation
— The stock trades at 9.3 EV/EBITDA versus its own 8.8 average, and the portal model implies 44% downside
Attractiveness
Key figures, USD bn
| Metric | Q2 2025 | Q2 2026 | Change |
|---|---|---|---|
| Revenue | 1.84 | 1.88 | +2.6% |
| EBITDA | 0.17 | 0.15 | -11.5% |
| Operating profit | 0.12 | 0.10 | -16.0% |
| Net profit | 0.10 | 0.08 | -17.7% |
| Operating cash flow | 0.22 | 0.16 | -26.0% |
| Capex | 0.06 | 0.04 | -38.7% |
| EBITDA margin | 9.5% | 8.2% | -1.3 pp |
| Net margin | 5.5% | 4.4% | -1.1 pp |
Revenue grew for the first time in a year, but organic growth contributed only 1%
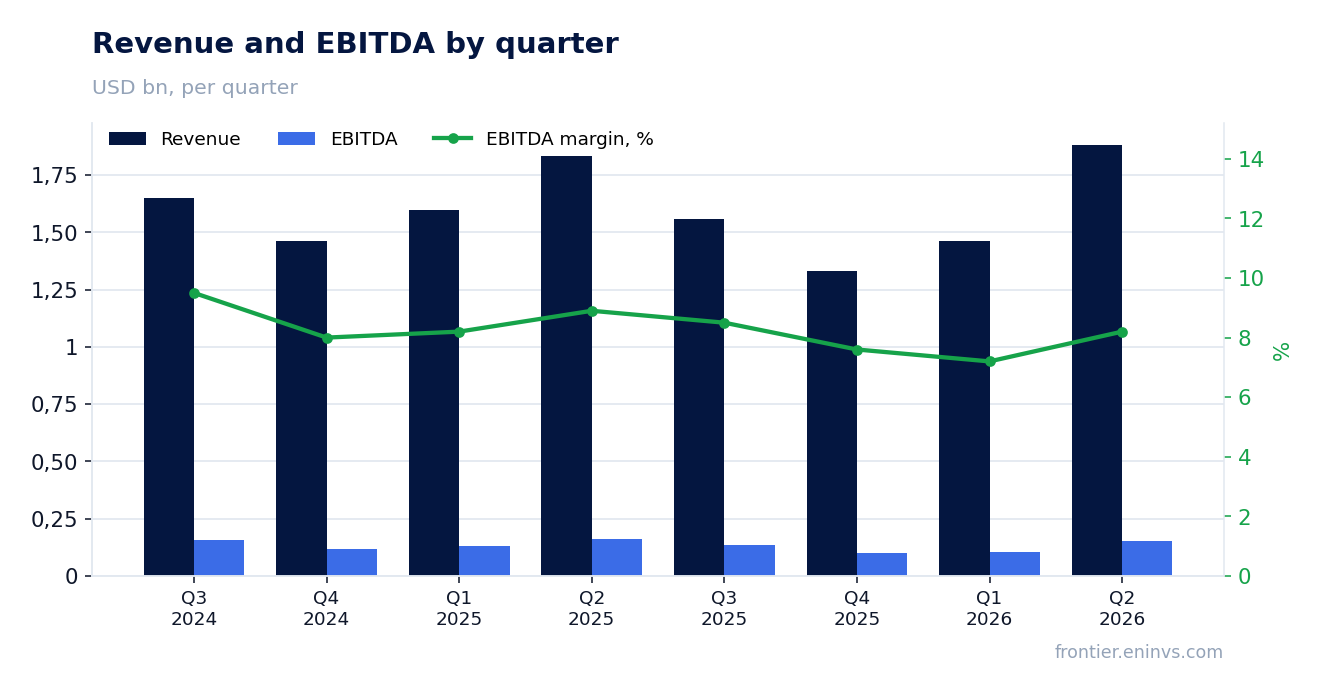
In the second quarter of 2026 UFP Industries reported revenue of $1,882.9 million, up 2.6% year on year. This is the first quarterly increase since early 2025: before that, sales had fallen for five consecutive quarters – from -2.7% in Q1 2025 to -8.4% in Q1 2026. The turn has come, but its quality is still weak.
Of the 2.6% growth, only 1% came from organic sales, with 2% from acquisitions. Prices were flat. By segment the picture is uneven: Retail added 3.9% on acquisitions and a 3% price increase, Packaging rose 6.9% on 4% organic growth and 4% from acquisitions, while Construction fell 4.5% as organic volumes dropped 2% and prices 3%.
Within Retail, ProWood sales declined 1% on weak consumer demand, but Deckorators grew 9% – Surestone sales jumped 37% and traditional composite decking 85%. In Packaging, structural packaging added 8% and protective packaging 15%, but PalletOne lost 3% on weaker demand. In Construction, commercial building grew 11%, while factory-built housing fell 6% as the company exited lower-margin commodity sales.
The company reaffirmed its 2026 outlook: demand is expected toward the lower end of its prior guidance of flat to slightly down unit expectations in each segment. That means even the current modest revenue growth may not hold without new acquisitions.
Freight ate the margin: transport costs rose by $27 million
Adjusted EBITDA in the second quarter of 2026 was $154.5 million, down 11.5% year on year. The EBITDA margin fell from 9.5% to 8.2%. The main culprit was transport costs, which rose by $27 million, or 1.6 percentage points of revenue.
The company attributes this to a sharp rise in spot freight rates – over 30% during the quarter, surpassing even the increase seen during the pandemic. Smaller carriers have exited the market, constraining capacity. Fuel surcharges and price adjustments offset part of the increase, but not all of it.
By segment, margins fell everywhere. In Retail, EBITDA was flat at $63.9 million, but the margin slipped from 8.1% to 7.8%. In Packaging, EBITDA plunged 28% to $27.9 million, with the margin falling from 9.1% to 6.1%. In Construction, EBITDA dropped 21% to $36.0 million, and the margin fell from 8.2% to 6.8%. The main drivers were freight, lower gross profit in PalletOne, and startup costs at new protective packaging facilities.
Company-wide gross margin declined from 17.0% to 15.4%. This means revenue growth is not translating into profit: each additional dollar of sales brings less margin than a year ago.
Profit fell 17.7%, and there are no one-off items in the report to cushion it
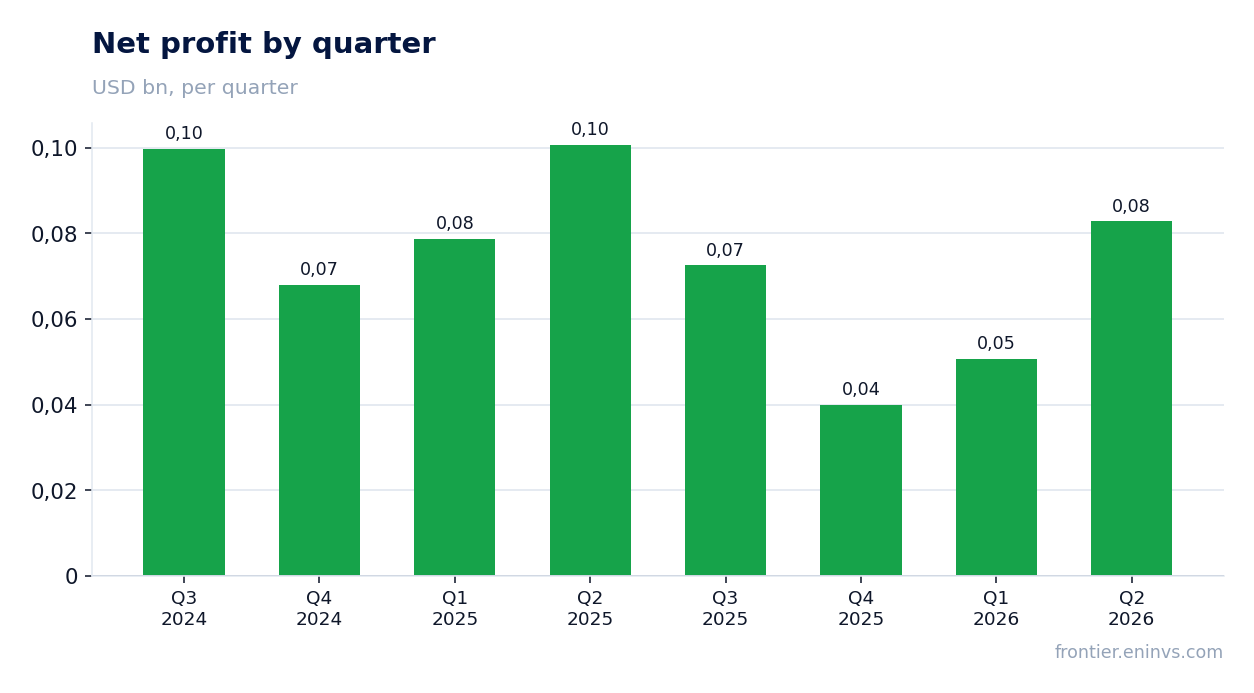
Net profit in the second quarter of 2026 was $82.9 million, down 17.7% year on year. The net margin fell from 5.5% to 4.4%. Diluted earnings per share were $1.48 versus $1.70 a year earlier.
There were no large one-off items distorting the picture. The loss on disposition and impairment of assets was just $0.3 million, and other losses were $0.8 million. This means the profit decline reflects operational issues, not accounting write-offs.
For the first half of 2026, net profit fell 25.5% to $134.3 million, and the margin dropped from 5.3% to 4.0%. The second quarter was better than the first, but the half-year overall remains weak. Earnings per share for the six months were $2.37 versus $2.99 a year earlier.
The company has launched a $60 million cost-out program and expects to deliver another $25 million by year-end. This may partially support profit in the fourth quarter, but it will not offset the margin hit from freight.
Net debt is negative and liquidity is $1.9 billion, but capex is rising to $175–200 million
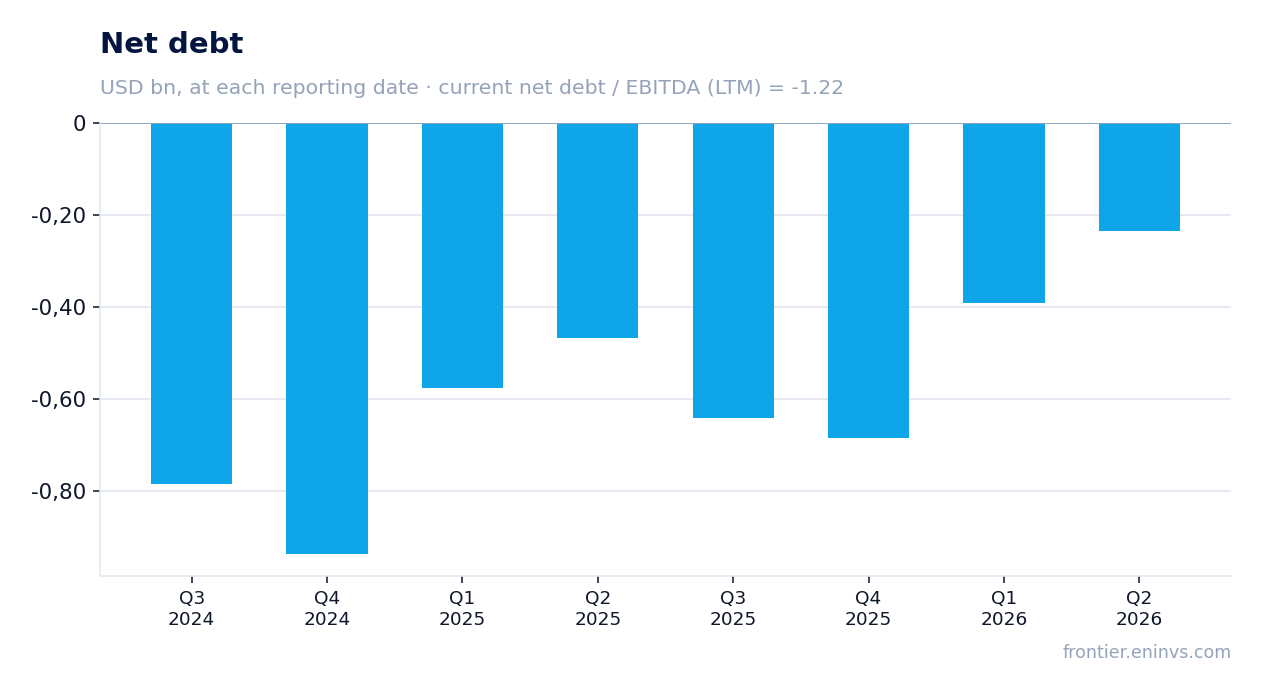
UFP Industries had negative net debt of -$557.4 million at the end of the second quarter of 2026, meaning cash exceeds debt. The net debt to EBITDA ratio for the trailing twelve months is -1.22. The company has $1.9 billion in liquidity, including over $597 million in cash and $1.3 billion available under credit facilities.
Operating cash flow for the first half of 2026 was $61 million, but this includes a nearly $170 million outflow for seasonal working capital, which the company expects to convert back to cash by the start of the fourth quarter. Free cash flow for the half-year was $198 million, of which $141.8 million went to share repurchases.
Capital expenditure in the first half was $48.3 million, but the company plans to spend $175–200 million on capital projects for the balance of 2026. This is a significant increase that could constrain free cash flow in the second half.
During the second quarter the company closed three acquisitions for a total of $122 million: MoistureShield for $55 million, John Rock for $47 million, and Berry Pallets for $20 million. These purchases expand capacity and geography but require integration and may temporarily weigh on margins.
The dividend was raised 3%, but a 1.74% yield does not even cover inflation
On July 22, 2026, UFP Industries' board declared a quarterly dividend of $0.36 per share, a 3% increase over the 2025 rate. The payment is due on September 15, 2026, to shareholders of record on September 1. The trailing twelve-month dividend yield is 1.74%.
The company states it will continue to increase the dividend in line with earnings and free cash flow growth. However, the current yield is well below the key rate and does not compensate for inflation. For income-oriented investors, this is a weak proposition.
Our estimate for the 2026 dividend is about $1.44 per share, based on the current quarterly run rate. This implies a payout ratio of roughly 40% against trailing twelve-month earnings. If profit continues to fall, the company may slow the pace of dividend increases.
The main risk to the dividend is further margin compression from freight costs and weak demand. The company has sufficient liquidity to sustain payments, but dividend growth may decelerate.
The stock trades at 9.3 EV/EBITDA versus its own 8.8 average, and the portal model implies 44% downside
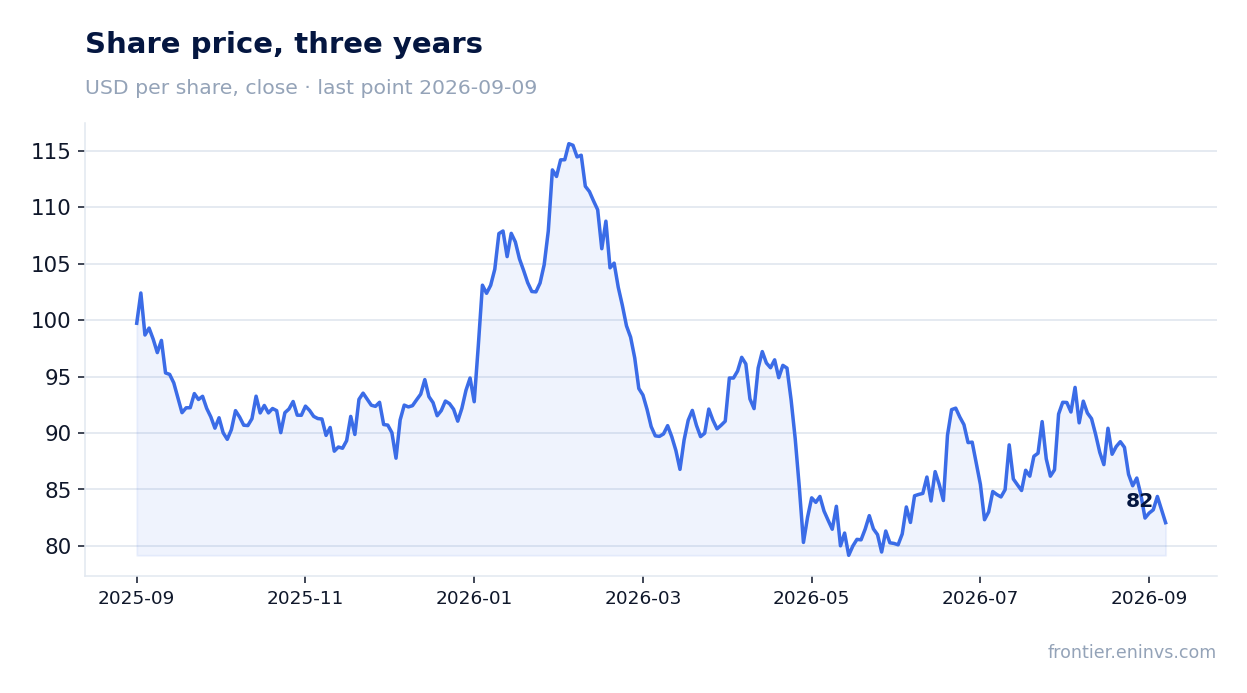
At the close before the release, UFP Industries' stock traded at $91.01. It fell 3.6% on the release day and 9.8% from the release through September 9. Market capitalisation is $4,838.1 million.
The trailing twelve-month EV/EBITDA multiple is 9.3, above its own three-year average of 8.8. This means the market values the company more richly than its three-year average, despite falling profit. The trailing P/E is 19.7.
The portal model, which reprices EBITDA at current commodity prices at the target EV/EBITDA, implies 44% downside to fair value. This is our own estimate, not a market consensus.
With an EBITDA margin of 8.2% versus 9.5% a year earlier and no sign of a rapid margin recovery, the current valuation looks stretched. To justify the multiple, the company needs either to restore margins to double digits or to show sustained organic growth, which is not yet visible.
Valuation on the latest reported figures
| Metric | Value |
|---|---|
| Market cap | 4.84 bn USD |
| P/E (LTM) | 19.7 |
| EV/EBITDA (LTM) | 9.3 |
| P/B | 1.58 |
| Net debt / EBITDA (LTM) | -1.22 |
| Operating cash flow (LTM) | 0.49 bn |
| ROE | 10.8% |
| Dividend yield (12m) | 1.7% |
| EV/EBITDA, 3-year average | 8.8 |
Bottom line
UFP Industries showed its first revenue growth in a year, but it was almost entirely driven by acquisitions rather than organic demand. Margins compressed due to freight costs, which rose by $27 million, and profit fell 17.7%. The company maintains a strong balance sheet with negative net debt and $1.9 billion in liquidity, but rising capex and weak demand limit the outlook. The stock trades above its own average multiple, and the portal model implies 44% downside. With a 1.74% dividend yield, the share looks rather unattractive at current levels.
Open the company's financial profile UFPI →
See also: market overview · valuation map · stock screeners