Vermilion Energy: profit is back, but higher debt absorbed half of quarterly EBITDA

On 25 August Vermilion Energy reported results for the second quarter of 2026. Revenue rose 21.3% year on year to USD 410.1 million, EBITDA added 34.2% to USD 218.7 million, and net profit came in at USD 97.8 million against a loss a year earlier. The EBITDA margin improved to 53.3% from 48.2%, and the net margin reached 23.8% versus minus 49.4%. Leverage stands at 1.5x trailing twelve-month EBITDA, while the portal's model puts the share 11% below fair value, so at the current price the stock looks rather attractive, though without a margin of safety.
Key takeaways
— Revenue rose 21.3% year on year to USD 410.1 million – the best quarterly result in two years
— EBITDA added 34.2% to USD 218.7 million, with the margin up to 53.3% from 48.2%
— Net profit of USD 97.8 million replaced a loss of USD 167.1 million a year earlier, but the year-ago base was distorted by one-offs
— Operating cash flow for the quarter was USD 124.4 million – below EBITDA – while capital expenditure is not disclosed in the report
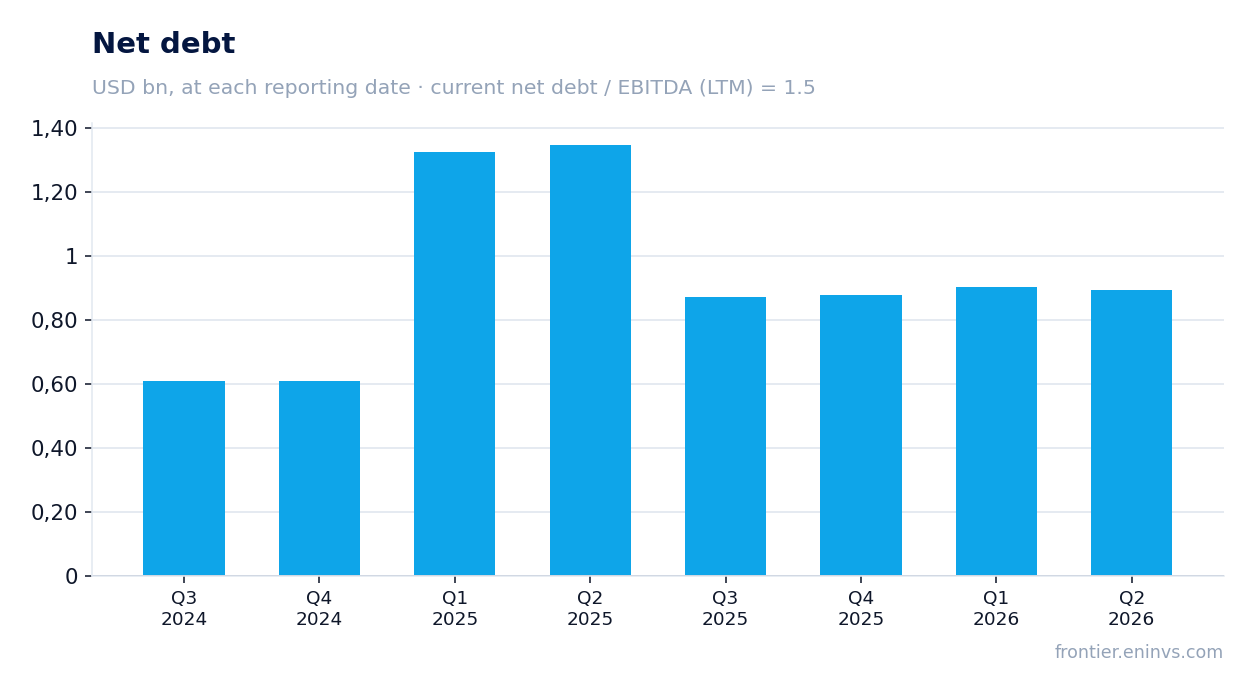
— Net debt fell to USD 893.4 million from USD 1,346.9 million a year earlier, but still equals 1.5x trailing twelve-month EBITDA
— On the portal's model the share is 11% below fair value at an EV/EBITDA of 4.9 – this is our own calculation, not a consensus
Attractiveness
Key figures, USD bn
| Metric | Q2 2025 | Q2 2026 | Change |
|---|---|---|---|
| Revenue | 0.34 | 0.41 | +21.3% |
| EBITDA | 0.16 | 0.22 | +34.2% |
| Operating profit | 0.03 | 0.10 | +214.3% |
| Net profit | -0.17 | 0.10 | to profit |
| Operating cash flow | 0.10 | 0.12 | +23.7% |
| Capex | 0.08 | — | — |
| EBITDA margin | 48.2% | 53.3% | +5.1 pp |
| Net margin | -49.4% | 23.8% | +73.2 pp |
Revenue rose 21.3% year on year to USD 410.1 million – the best quarterly result in two years
In the second quarter of 2026, Vermilion Energy's revenue reached USD 410.1 million, up 21.3% year on year. This is the highest quarterly figure since at least Q3 2024, when revenue was USD 368.4 million. Growth accelerated: in Q1 2026 it was 8.9%, while in Q4 2025 revenue was falling 25.8% year on year.
The report does not disclose the driver of this jump, but the dynamics coincide with higher energy prices in the first half of 2026. The company provides no quarterly breakdown by production volumes or realised prices, so it is impossible to say whether prices or volumes made the main contribution. Importantly, the revenue growth is not a one-off: it has continued for two consecutive quarters after the slump at the end of 2025.
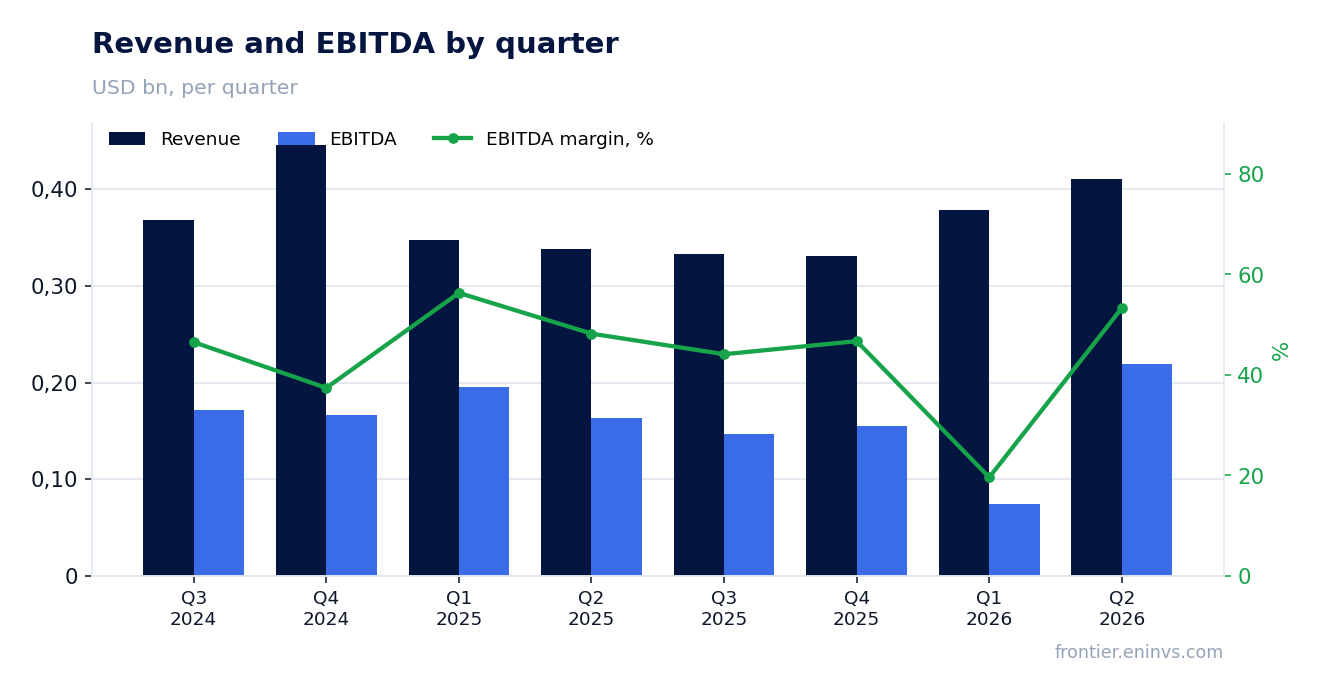
EBITDA added 34.2% to USD 218.7 million, with the margin up to 53.3% from 48.2%
EBITDA in Q2 2026 was USD 218.7 million, up 34.2% year on year. The EBITDA margin rose to 53.3% from 48.2% a year earlier. This is the highest margin in at least eight quarters: in previous periods it ranged from 44.1% in Q3 2025 to 56.3% in Q1 2025.
Operating profit was USD 98.0 million versus USD 31.2 million a year earlier. The growth in EBITDA and operating profit on modest revenue growth suggests the company either cut unit costs or benefited from realised prices. Cost details are not disclosed in the report, so the specific line of savings cannot be named. The sustainability of this margin will depend on whether favourable energy prices persist in the second half.
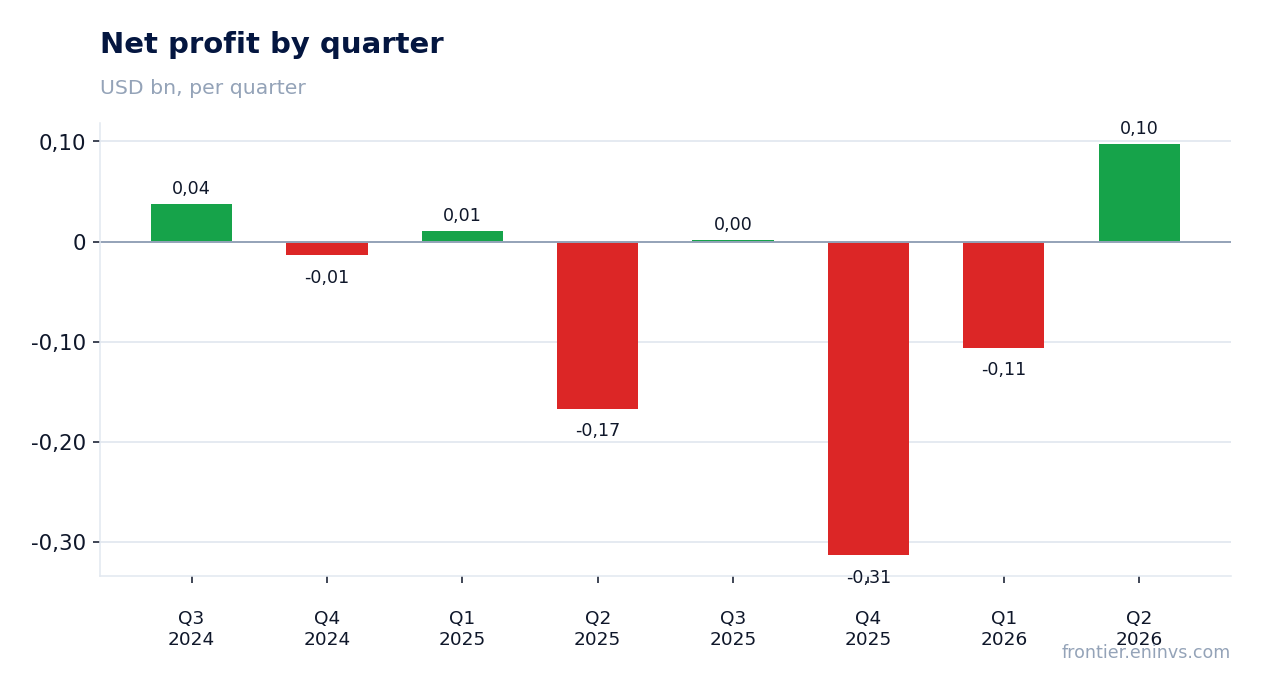
Net profit of USD 97.8 million replaced a loss of USD 167.1 million a year earlier, but the year-ago base was distorted by one-offs
Net profit in Q2 2026 was USD 97.8 million against a loss of USD 167.1 million a year earlier. The net margin reached 23.8% versus minus 49.4% in Q2 2025. This turnaround is explained not only by higher operating profit but also by a low base: a year earlier the company recorded large one-off write-downs, the nature of which is not disclosed in the provided data.
Compared with Q1 2026, when the loss was USD 106.0 million, the current result looks like a sharp recovery. However, without a breakdown of one-off items, it cannot be claimed that the profit is sustainable. One should look at the dynamics of operating profit – it rose to USD 98.0 million from USD 31.2 million a year earlier, which is a more reliable indicator than net profit.
Operating cash flow for the quarter was USD 124.4 million – below EBITDA – while capital expenditure is not disclosed in the report
Operating cash flow in Q2 2026 was USD 124.4 million, 43% below EBITDA. The gap is explained by changes in working capital and taxes paid, but the exact reason is not detailed in the provided data. For comparison: in Q1 2026 operating cash flow was USD 165.6 million, and in Q4 2025 it was USD 95.4 million.
Capital expenditure for Q2 2026 is not disclosed in the report. This prevents an assessment of free cash flow and the sustainability of dividend payments. In previous periods, capex was volatile: USD 323.6 million in Q4 2025 and USD 98.0 million in Q1 2026. Without this data, it is impossible to judge how much cash remains after investments.
Net debt fell to USD 893.4 million from USD 1,346.9 million a year earlier, but still equals 1.5x trailing twelve-month EBITDA
Net debt at the end of Q2 2026 was USD 893.4 million versus USD 1,346.9 million a year earlier and USD 901.7 million at the end of Q1 2026. The year-on-year decline was about USD 0.5 billion, mainly explained by trailing twelve-month EBITDA rising to USD 594.1 million. The net debt to trailing twelve-month EBITDA ratio is 1.5x – a moderate level for an energy company.
The trailing twelve-month EV/EBITDA is 4.9, which is below many peers, but a comparison with the company's own history is not possible because the provided data does not include a three-year average. Importantly, debt is falling while EBITDA is growing – this creates room for further deleveraging. However, without capex data, it cannot be claimed that free cash flow is sufficient to sustain dividends.
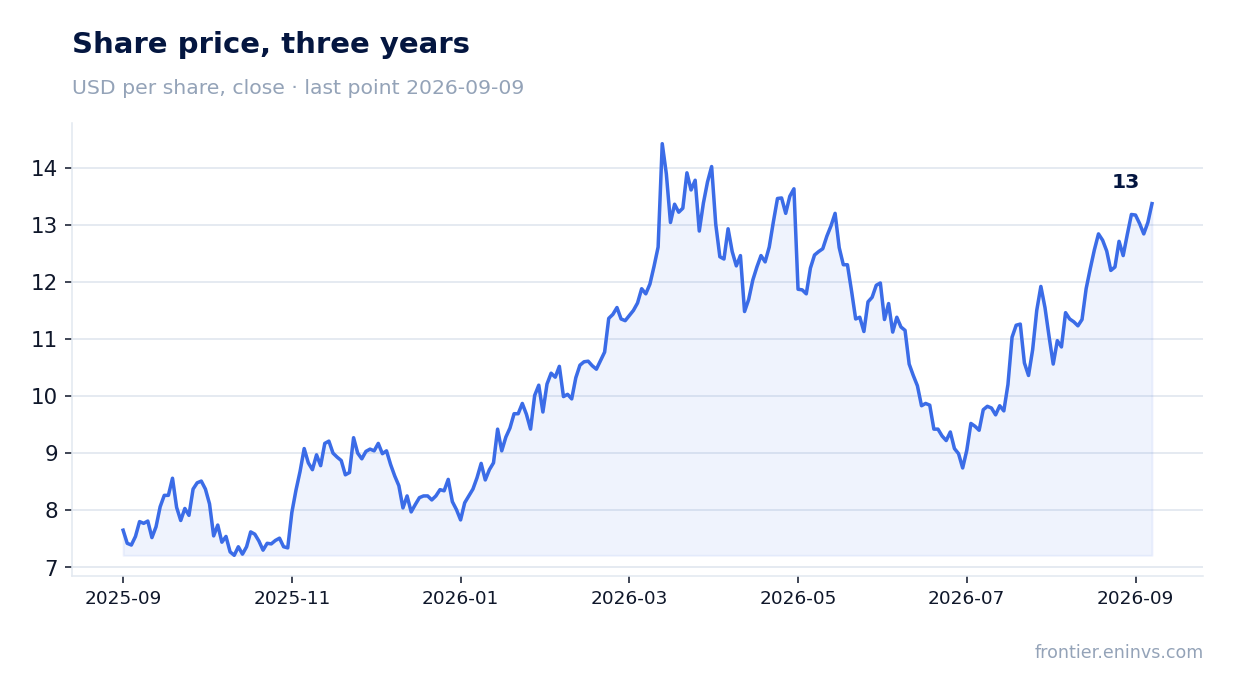
On the portal's model the share is 11% below fair value at an EV/EBITDA of 4.9 – this is our own calculation, not a consensus
On the portal's model, which re-prices EBITDA at current commodity prices and a target EV/EBITDA, Vermilion Energy's share is valued 11% below fair value. This is our own calculation, not a consensus forecast or a target price. The current trailing twelve-month EV/EBITDA is 4.9, corresponding to a market capitalisation of USD 2,044.9 million and net debt of USD 893.4 million.
The trailing twelve-month return on equity (ROE) is 25.5% – a high figure reflecting the profit recovery. However, without a three-year average EV/EBITDA, it is impossible to say whether the share looks expensive or cheap relative to its own history. The portal's model suggests that at current energy prices the share has modest upside, but it is not guaranteed.
Valuation on the latest reported figures
| Metric | Value |
|---|---|
| Market cap | 2.04 bn USD |
| EV/EBITDA (LTM) | 4.9 |
| P/B | 1.30 |
| Net debt / EBITDA (LTM) | 1.50 |
| Operating cash flow (LTM) | 0.66 bn |
| ROE | 25.5% |
Bottom line
Bottom line: Q2 2026 was Vermilion Energy's best quarter in two years. Revenue rose 21.3%, EBITDA added 34.2%, net profit replaced a loss, and the EBITDA margin reached 53.3%. However, part of this improvement is due to a low year-ago base, and operating cash flow came in below EBITDA. Debt is falling but still equals 1.5x trailing twelve-month EBITDA. On the portal's model the share is 11% below fair value, making it rather attractive but without a margin of safety. The key question for a holder is whether favourable pricing persists and whether the company can generate enough free cash flow to sustain dividends.
Open the company's financial profile VET →
See also: market overview · valuation map · stock screeners