Exxon Mobil: Q2 profit up 30.5%, but shares trade at twice their three-year average multiple

On July 31, Exxon Mobil reported Q2 2026 results: revenue rose 9.7% year on year to $89,420 million, net profit jumped 30.5% to $9,240 million. Despite the strong quarter, the stock looks expensive: EV/EBITDA is 10.9 versus the three-year average of 6.8, and the portal's model implies 42% downside, so the verdict is rather unattractive.
Key takeaways
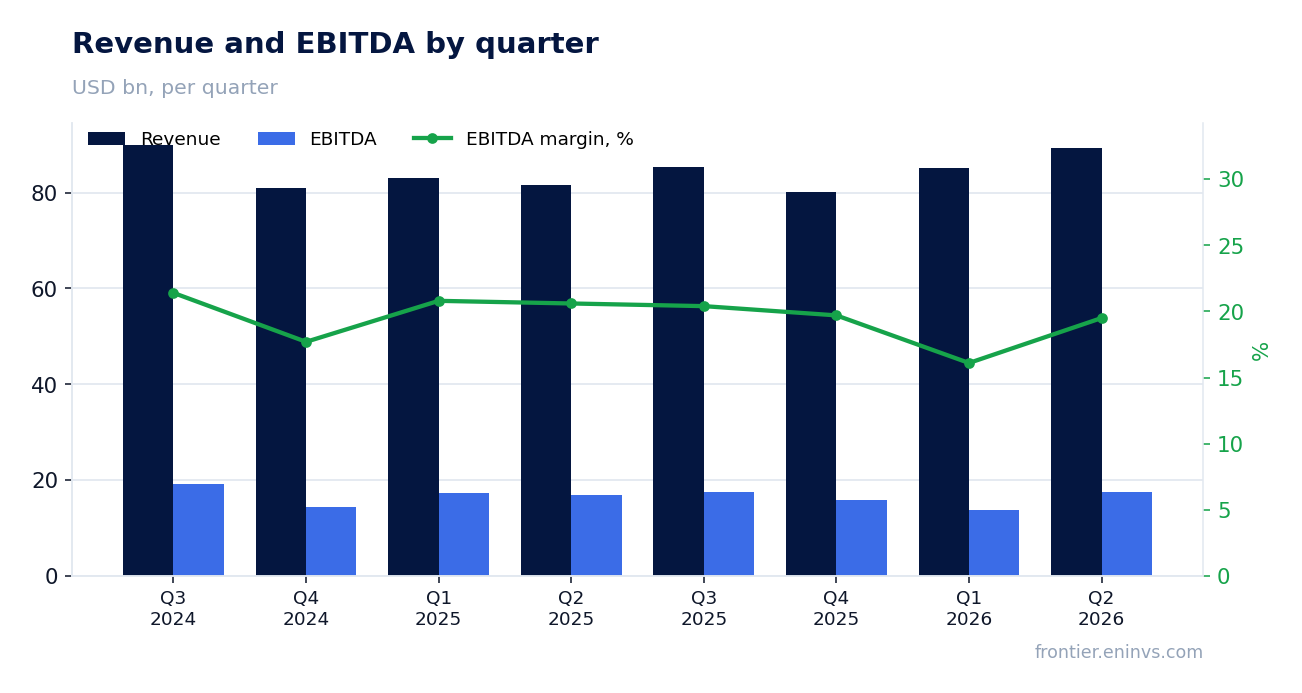
— Q2 revenue rose 9.7% on recovering oil and gas prices
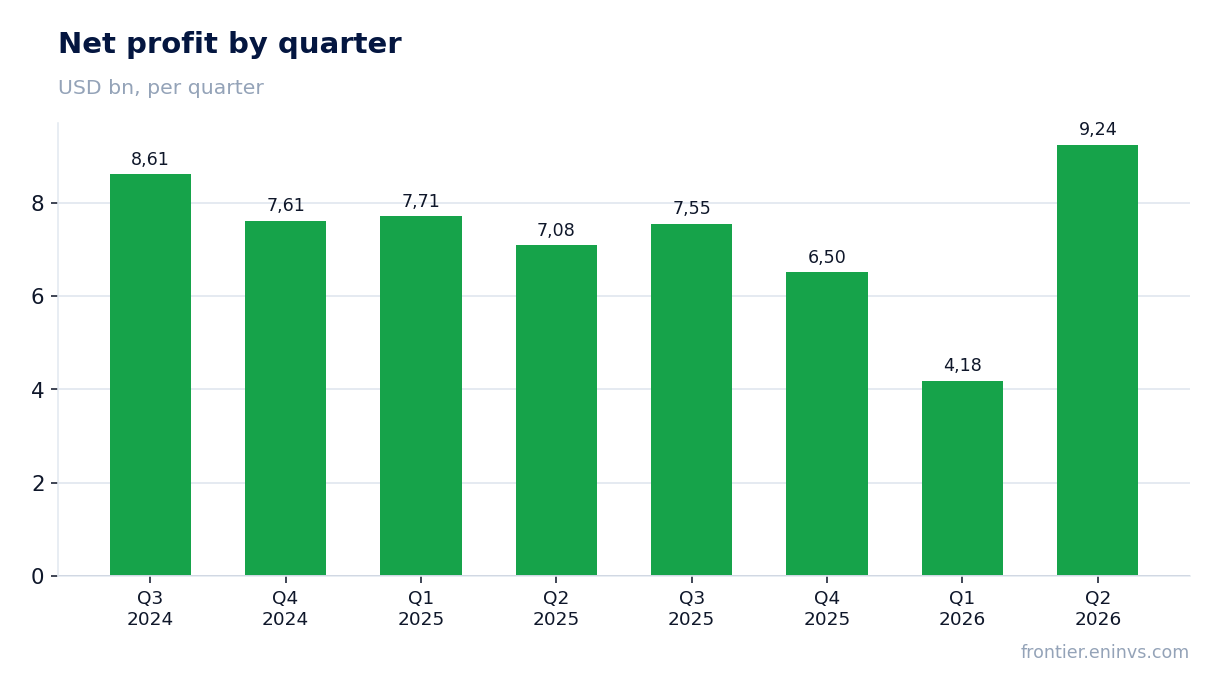
— Net profit jumped 30.5% on higher refining margins and absence of impairments
— EBITDA margin fell to 19.5% from 20.6% a year earlier on higher production costs
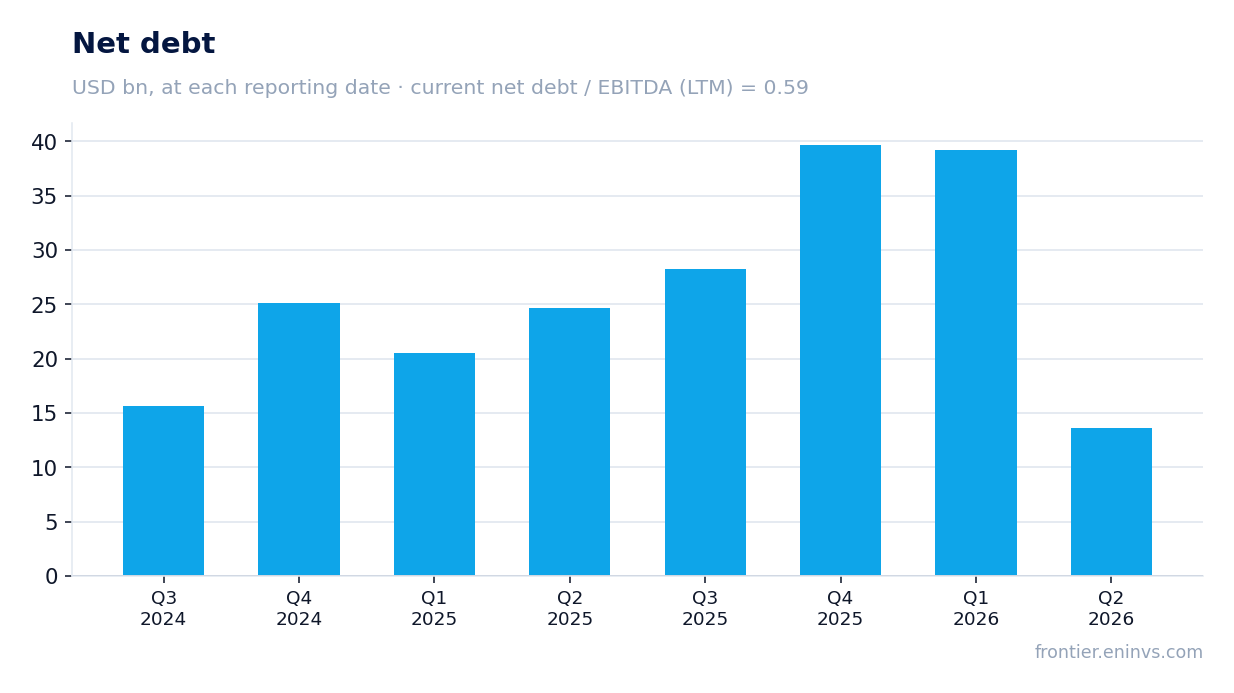
— Leverage remains low: net debt is 0.59 of trailing-twelve-month EBITDA
— Capex increased, but operating cash flow covers it with a cushion
— Trailing twelve-month dividends yield 2.5% at the current price
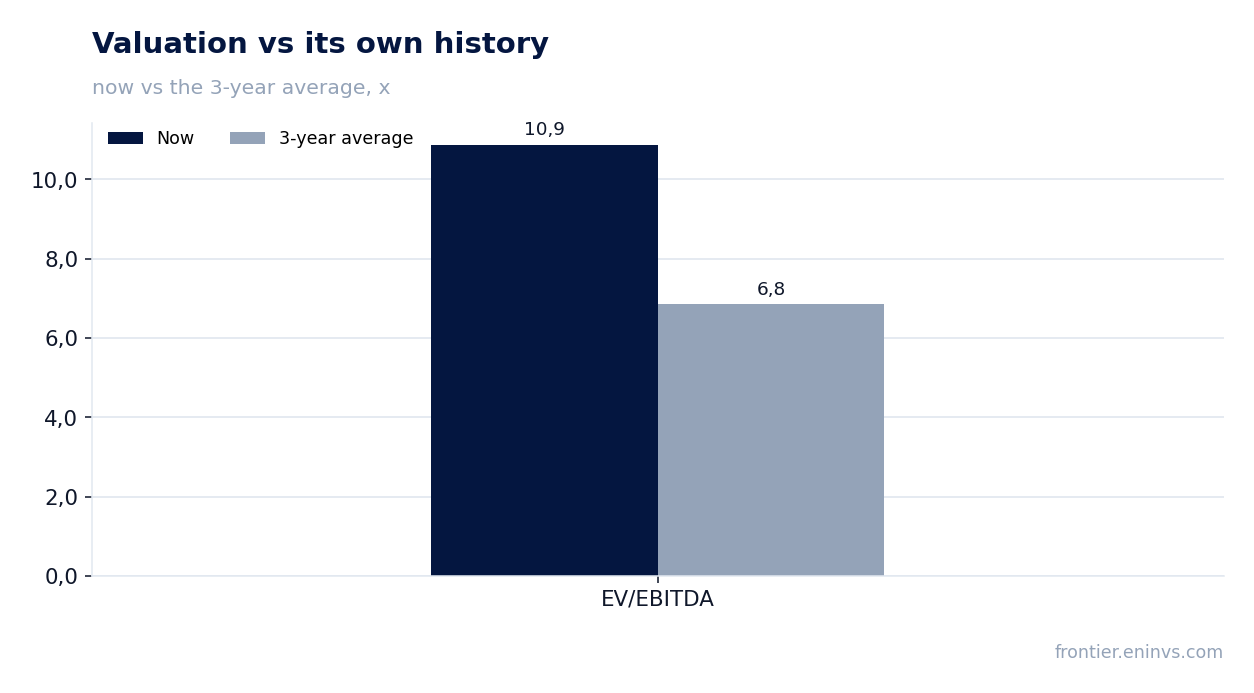
— The stock trades at twice its own three-year average multiple, limiting upside
Attractiveness
Key figures, USD bn
| Metric | Q2 2025 | Q2 2026 | Change |
|---|---|---|---|
| Revenue | 81.5 | 89.4 | +9.7% |
| EBITDA | 16.8 | 17.4 | +3.8% |
| Operating profit | 10.7 | 12.3 | +15.3% |
| Net profit | 7.08 | 9.24 | +30.5% |
| Operating cash flow | 11.6 | 14.2 | +23.0% |
| Capex | 6.28 | 6.53 | +3.9% |
| EBITDA margin | 20.6% | 19.5% | -1.1 pp |
| Net margin | 8.7% | 10.3% | +1.6 pp |
Q2 revenue rose 9.7% on recovering oil and gas prices
In Q2 2026, Exxon Mobil's revenue reached $89,420 million, up 9.7% year on year. Growth accelerated from Q1's 2.4% on recovering energy prices. Brent averaged $104.52 per barrel in Q2 versus $69.07 a year earlier, while Henry Hub edged down from $3.07 to $2.90 per million BTU – still below last year's level.
The company also lifted production: first-half 2026 output was 4,554 thousand barrels of oil equivalent per day versus 4,591 thousand a year earlier. The decline reflects divestments and price effects, partly offset by growth in the U.S. Overall, revenue dynamics mirror price trends rather than organic volume growth.
Net profit jumped 30.5% on higher refining margins and absence of impairments
Q2 2026 net profit rose to $9,240 million from $7,082 million a year earlier – up 30.5%. Growth was driven not only by revenue but also by operational efficiency: the indicative refining margin in Energy Products jumped to $29.0 per barrel from $17.5 in Q2 2025. Chemicals also improved: North American polyethylene prices rose from $759 to $1,454 per ton.
Unlike previous quarters, Q2 2026 had no major impairments or restructuring charges, which had cost $755 million in Q4 2025. The effective tax rate fell to 24% from 40% in Q1, also supporting net profit. As a result, the net margin widened to 10.3% from 8.7% a year earlier.
EBITDA margin fell to 19.5% from 20.6% a year earlier on higher production costs
Q2 2026 EBITDA was $17,450 million, up 3.8% year on year. However, the EBITDA margin fell to 19.5% from 20.6% in Q2 2025. The cause is faster cost growth: production and manufacturing expenses rose from $10,102 million to $12,250 million in the quarter, and depreciation increased from $6,101 million to $8,689 million.
The margin decline was partly offset by higher oil prices, but not fully. This suggests Exxon Mobil's operating leverage is weaker than last year: each additional dollar of revenue brings less profit. If energy prices stay at current levels, margin pressure may persist.
Leverage remains low: net debt is 0.59 of trailing-twelve-month EBITDA
At the end of Q2 2026, Exxon Mobil's net debt stood at $39,690 million, and the net debt to trailing-twelve-month EBITDA ratio was 0.59. This is a moderate level for an oil and gas company, leaving room for higher shareholder returns or investment financing without a significant rise in risk.
During the quarter, net debt fell by $25.6 billion – from $39,226 million at the end of Q1 to $13,608 million at the end of Q2. This was driven by strong operating cash flow and asset sales. However, the absolute debt level fluctuates with oil prices and capital spending.
Capex increased, but operating cash flow covers it with a cushion
In Q2 2026, capital expenditures were $6,527 million, up 3.9% from $6,283 million a year earlier. Operating cash flow for the quarter reached $14,210 million versus $11,550 million in Q2 2025. Thus, free cash flow (before dividends) remains positive, at roughly $7,683 million for the quarter.
Over the trailing twelve months, operating cash flow was $52,000 million, comfortably covering capital expenditures and dividends. This allows the company to continue share buybacks: $10,007 million was spent in H1 2026. Sustained cash flow is a key argument for shareholders, especially amid volatile oil prices.
Trailing twelve-month dividends yield 2.5% at the current price
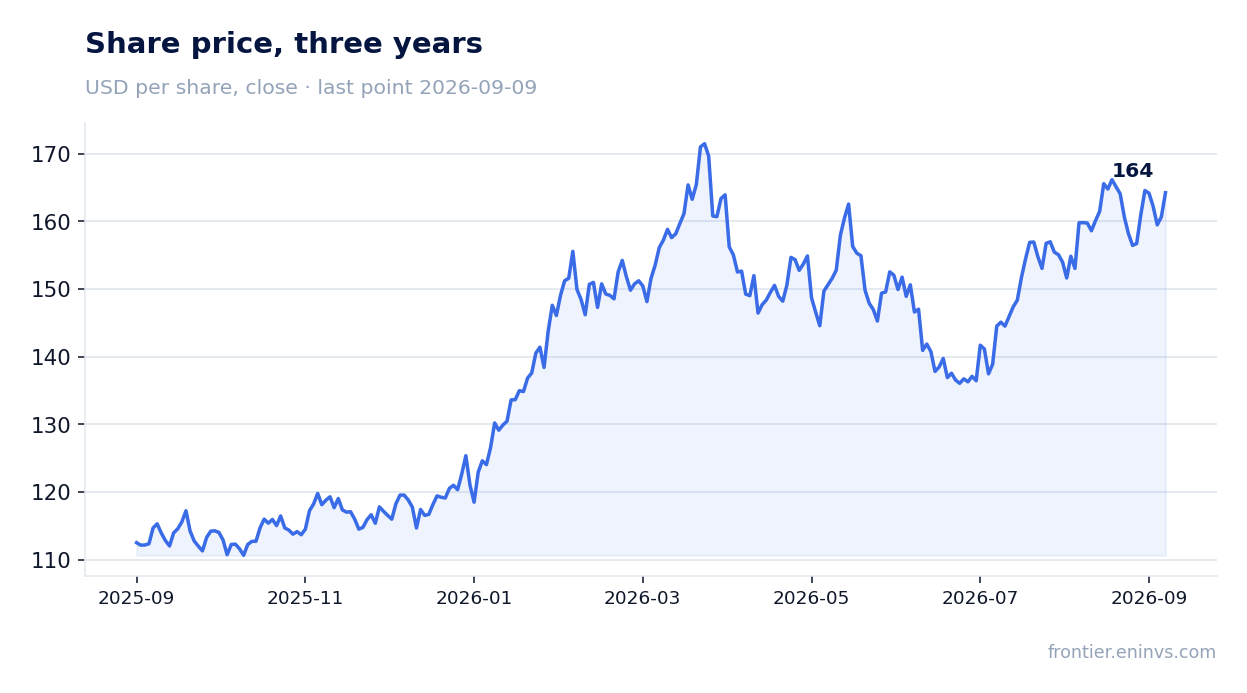
Over the trailing twelve months, Exxon Mobil paid dividends of $4.12 per share (based on quarterly payments of $1.03 in Q2 2026). At the current share price of about $157, this implies a dividend yield of 2.5%. The company has consistently raised dividends: Q2 2026 payment was $1.03 versus $0.99 a year earlier.
Dividend payments in H1 2026 totaled $8,633 million, fully covered by operating cash flow. Given low leverage and stable cash flow, the company has room to keep raising dividends. However, a 2.5% yield is modest compared with the key rate, making the stock more of a defensive asset than an income source.
The stock trades at twice its own three-year average multiple, limiting upside
The current EV/EBITDA multiple is 10.9, versus the three-year average of 6.8. This means the market values Exxon Mobil significantly higher than its own history. Even considering higher oil prices and improved operations, such a gap looks excessive.
According to the portal's model, which re-prices EBITDA at current energy prices and applies a target EV/EBITDA, the downside potential is -42% relative to the current market cap. This is not a consensus forecast but an internal estimate, yet it suggests that an optimistic scenario is already priced in. If oil prices do not keep rising, the stock may come under pressure.
Valuation on the latest reported figures
| Metric | Value |
|---|---|
| Market cap | 686 bn USD |
| P/E (LTM) | 25.0 |
| EV/EBITDA (LTM) | 10.9 |
| P/B | 2.65 |
| Net debt / EBITDA (LTM) | 0.59 |
| Operating cash flow (LTM) | 52.0 bn |
| ROE | 14.4% |
| Dividend yield (12m) | 2.5% |
| EV/EBITDA, 3-year average | 6.8 |
Bottom line
Exxon Mobil delivered a strong quarter: revenue and profit grew at double-digit rates, cash flow covers investments and dividends, and leverage is low. However, profit growth was largely driven by favorable price conditions and the absence of one-off impairments, not by sustainable operational improvement – EBITDA margin declined. The key question for a holder now is valuation: the stock trades at twice its three-year average multiple, and the portal's model implies 42% downside. As long as oil prices remain high, the business looks solid, but the margin of safety in the share price is minimal. Verdict: rather unattractive.
Open the company's financial profile XOM →
See also: market overview · valuation map · stock screeners