ID_AADI: revenue turned to +21.6% and EBITDA margin jumped to 31.2% — but debt rose

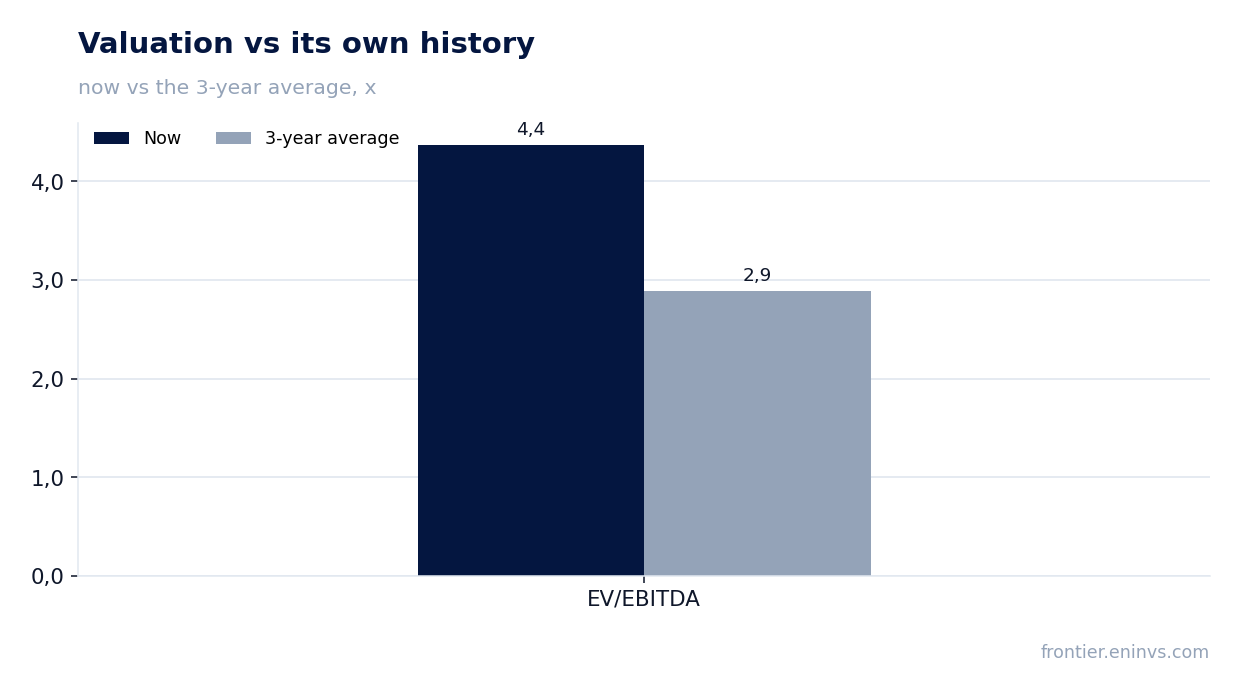
25 августа ID_AADI раскрыла результаты за второй квартал 2026 года: выручка выросла на 21,6% год к году, до 1 502,4 млн долл., EBITDA — на 60,6%, до 456,3 млн долл., чистая прибыль — на 42,1%, до 330,7 млн долл. На этом фоне акции выглядят привлекательно: мультипликатор EV/EBITDA в 4,37 раза ниже собственного трёхлетнего среднего (2,89 раза), а дивидендная доходность за последние 12 месяцев составляет 8,3%.
Key takeaways
— Q2 revenue grew 21.6% YoY to $1,502.4 million after a 10.3% decline in Q1
— EBITDA margin reached 31.2% versus 23.7% a year earlier — a 7.5 percentage point expansion
— Net profit rose 42.1% YoY to $330.7 million, translating into a 22.0% net margin
— Debt increased by $0.2 billion in the quarter and $0.4 billion over the year, but net debt/EBITDA remains negative at -0.11
— Capex in Q2 fell to $49.2 million from $81.3 million a year earlier
— Trailing twelve-month dividend yield stands at 8.3% with a P/E of 6.06
— On the portal's model, the stock has 41% upside to fair value
Attractiveness
Key figures, USD bn
| Metric | Q2 2025 | Q2 2026 | Change |
|---|---|---|---|
| Revenue | 1.24 | 1.50 | +21.6% |
| EBITDA | 0.29 | 0.47 | +60.6% |
| Operating profit | 0.29 | 0.46 | +56.2% |
| Net profit | 0.23 | 0.33 | +42.1% |
| Capex | 0.08 | 0.05 | -39.5% |
| EBITDA margin | 23.7% | 31.2% | +7.5 pp |
| Net margin | 18.8% | 22.0% | +3.2 pp |
Q2 revenue grew 21.6% YoY to $1,502.4 million after a 10.3% decline in Q1
In Q2 2026, ID_AADI's revenue reached $1,502.4 million, up 21.6% year over year. This is a sharp reversal after Q1, when revenue declined 10.3% YoY to $1,044.2 million. The company not only offset the slump but also returned to solid growth.
Quarterly dynamics show accelerating momentum: Q2 2025 revenue was $1,235.1 million, and Q4 2025 was $1,301.1 million. Q2 2026 growth was the highest in the last four quarters.
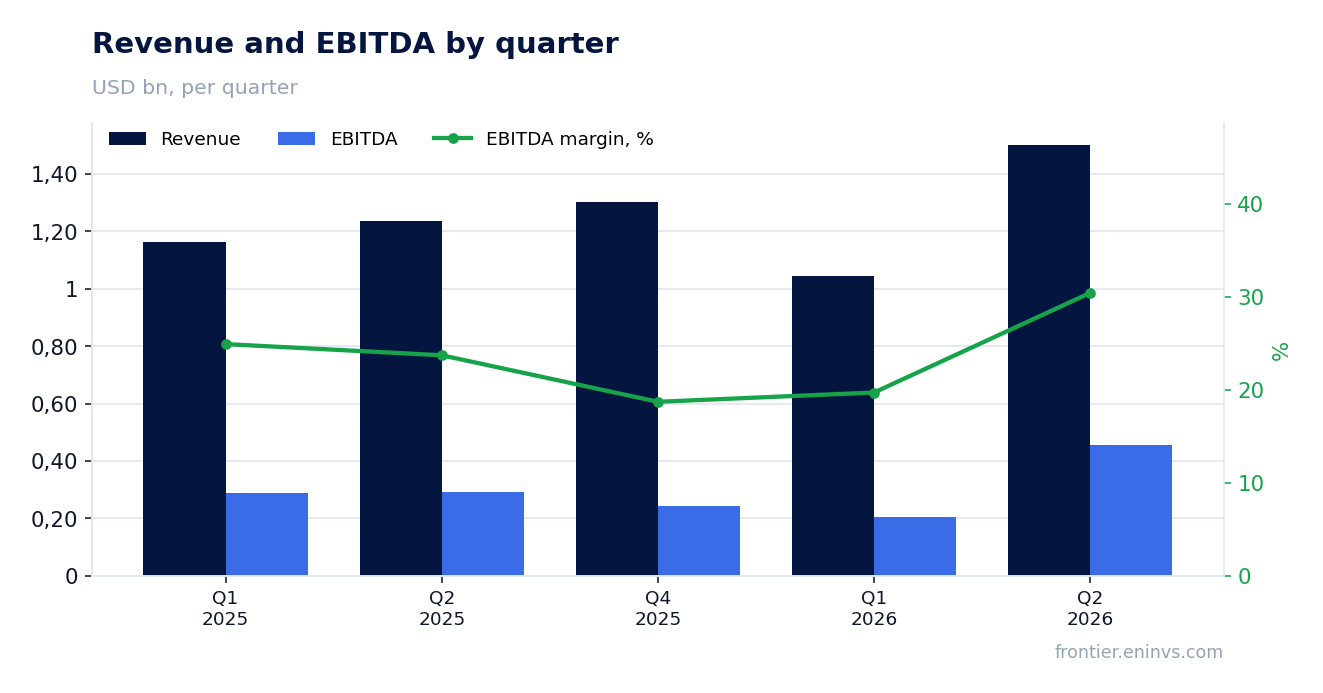
EBITDA margin reached 31.2% versus 23.7% a year earlier — a 7.5 percentage point expansion
Q2 2026 EBITDA grew 60.6% YoY to $456.3 million, with EBITDA margin expanding to 31.2% from 23.7% a year earlier. The 7.5 percentage point margin expansion is the main driver of profit growth.
Operating profit mirrored EBITDA: $456.0 million in Q2 2026 versus $292.0 million a year earlier. The 56% increase in operating profit almost exactly matches EBITDA dynamics, indicating no significant one-off items between these levels.
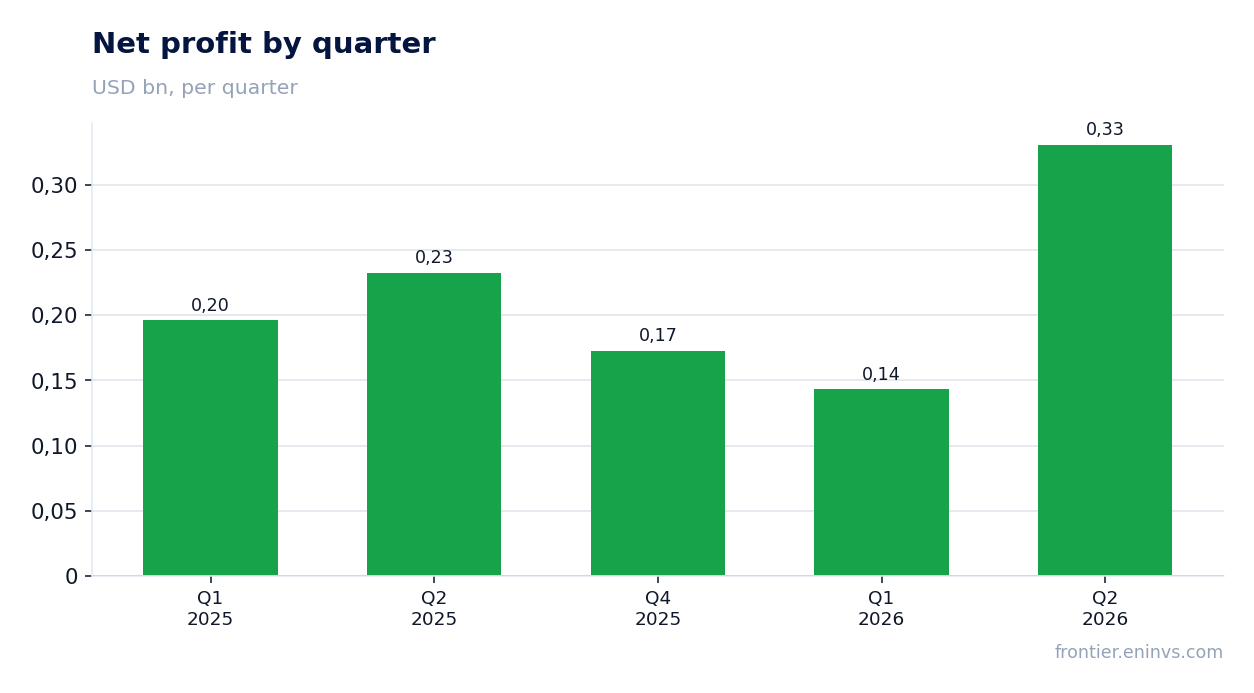
Net profit rose 42.1% YoY to $330.7 million, translating into a 22.0% net margin
Q2 2026 net profit came in at $330.7 million, up 42.1% YoY. Net margin reached 22.0% versus 18.8% in Q2 2025.
Over the trailing twelve months, net profit reached $858.2 million, which at the current market cap of $5,199.5 million implies a P/E of 6.06. That is a low level for a company with expanding margins.
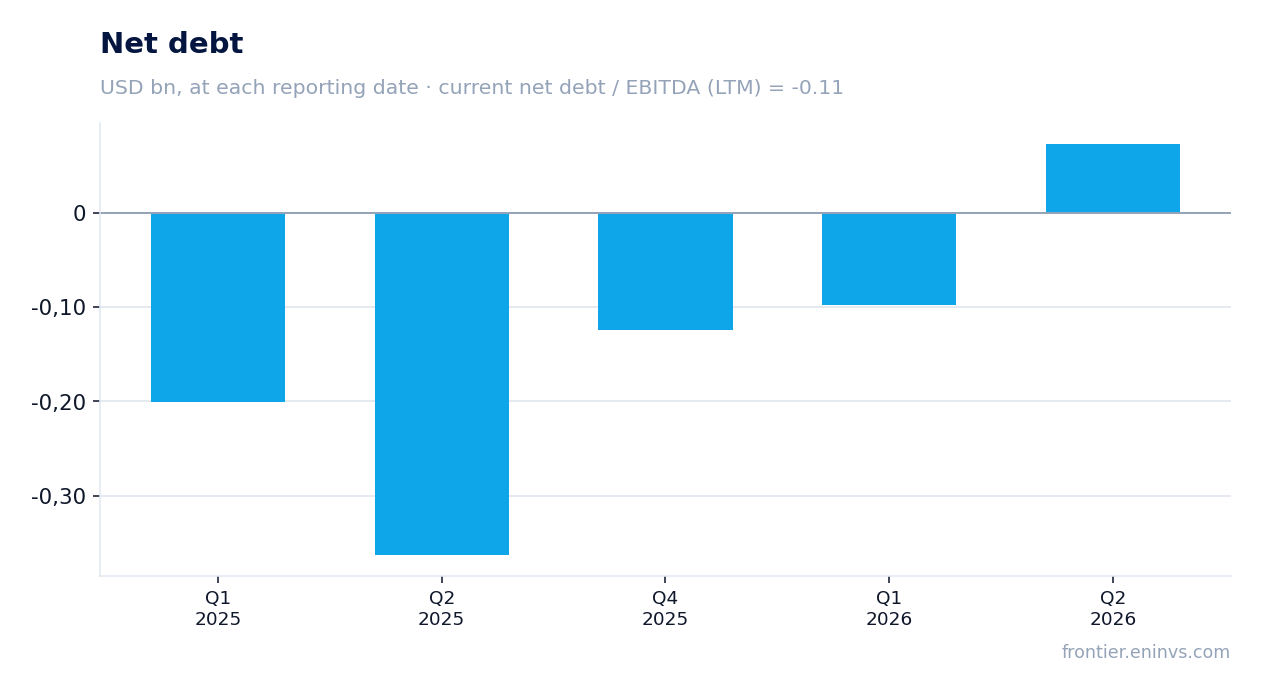
Debt increased by $0.2 billion in the quarter and $0.4 billion over the year, but net debt/EBITDA remains negative at -0.11
Net debt at the latest balance sheet date was -$132.4 million, meaning the company retains a net cash position. Debt increased by $0.2 billion in the quarter and $0.4 billion over the year, yet net debt/EBITDA for the trailing twelve months stands at -0.11.
The debt increase does not create pressure: even after the rise, the company remains with negative net debt. This provides financial flexibility for dividends and investments.
Capex in Q2 fell to $49.2 million from $81.3 million a year earlier
Q2 2026 capex was $49.2 million versus $81.3 million in Q2 2025. The 39% decline in capex alongside 21.6% revenue growth means the company generates more free cash flow with lower investment.
Over the trailing twelve months, operating cash flow reached $859.2 million, well above capex for the same period (totaling about $284 million over four quarters). This provides room for dividend payments.
Trailing twelve-month dividend yield stands at 8.3% with a P/E of 6.06
Over the trailing twelve months, ID_AADI's dividend yield was 8.3%. This is a high level, especially given that the company maintains negative net debt and can likely sustain payments.
The P/E of 6.06 based on trailing twelve-month earnings looks moderate. Combined with an 8.3% dividend yield, the share offers both income and growth potential.
On the portal's model, the stock has 41% upside to fair value
Our portal's model, which re-prices EBITDA at current commodity prices at the target EV/EBITDA, indicates the stock has +41% upside to fair value. This is the portal's own calculation, not market consensus.
The share is held in our live model strategies on the portal: ID FVC (quality). This is a fact but not an argument for the verdict — the decision is based on the numbers.
Valuation on the latest reported figures
| Metric | Value |
|---|---|
| Market cap | 5.20 bn USD |
| P/E (LTM) | 6.1 |
| EV/EBITDA (LTM) | 4.4 |
| P/B | 1.42 |
| Net debt / EBITDA (LTM) | -0.11 |
| Operating cash flow (LTM) | 0.86 bn |
| ROE | 37.5% |
| Dividend yield (12m) | 8.3% |
| EV/EBITDA, 3-year average | 2.9 |
Bottom line
In Q2 2026, ID_AADI showed a strong turnaround: revenue grew 21.6% YoY, and EBITDA margin expanded to 31.2% from 23.7%. Net profit rose 42.1% to $330.7 million, delivering a 22.0% net margin. Debt increased, but the company retains negative net debt, and the 8.3% dividend yield looks attractive. However, the EV/EBITDA multiple of 4.37x is above its own three-year average of 2.89x, suggesting the market already prices in the improvement. Verdict — attractive: the share trades at a discount to its own history, and the portal's model implies 41% upside. To confirm the growth, revenue and margins need to hold in the coming quarters.
Open the company's financial profile AADI →
See also: market overview · valuation map · stock screeners