ID_ADRO: revenue returns to growth, but the company swung to net debt for the first time in two years
25 августа ID_ADRO раскрыла результаты за второй квартал 2026 года: выручка выросла на 11,0% год к году до 528,3 млн USD, EBITDA – на 79,3% до 219,0 млн USD, чистая прибыль – на 84,5% до 181,2 млн USD. Рентабельность по EBITDA достигла 50,0% против 31,0% годом ранее. При текущей цене акция выглядит привлекательно: мультипликаторы ниже исторических уровней, а модель портала оценивает потенциал роста в +29%.
Key takeaways
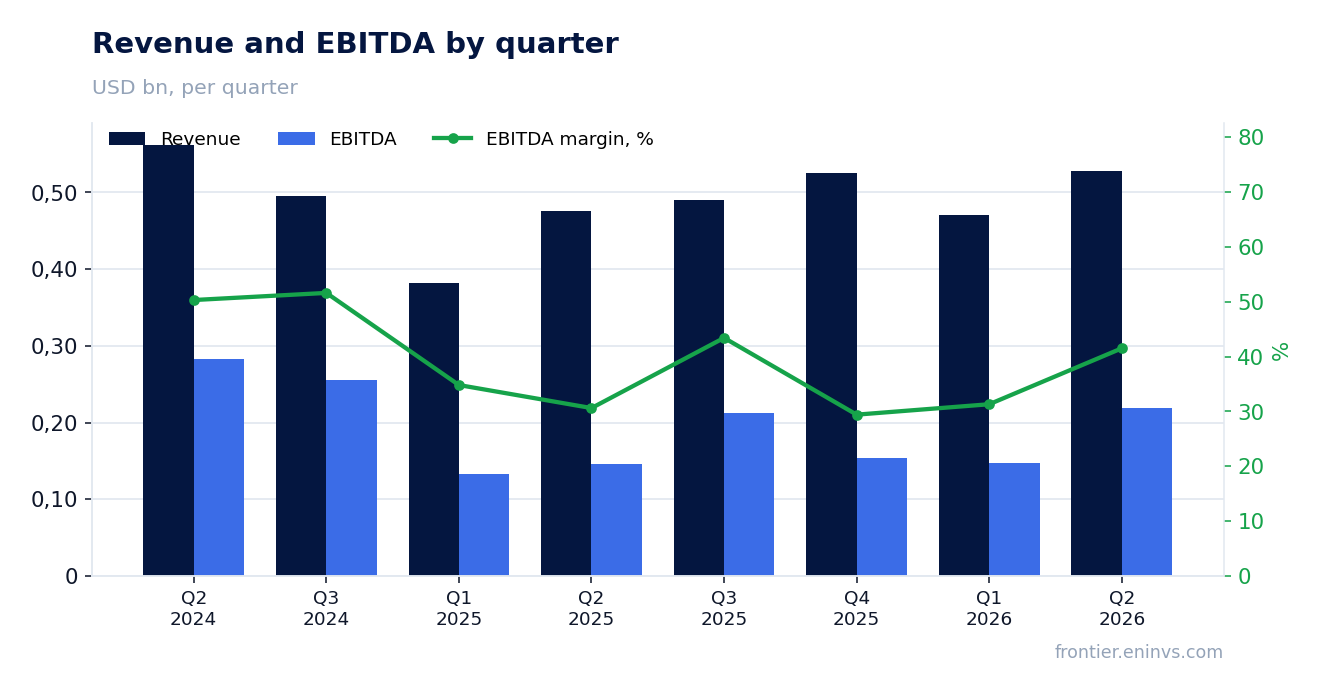
— Revenue in Q2 2026 grew 11.0% YoY after two quarters of decline
— EBITDA margin reached 50.0% – the highest in the period under review
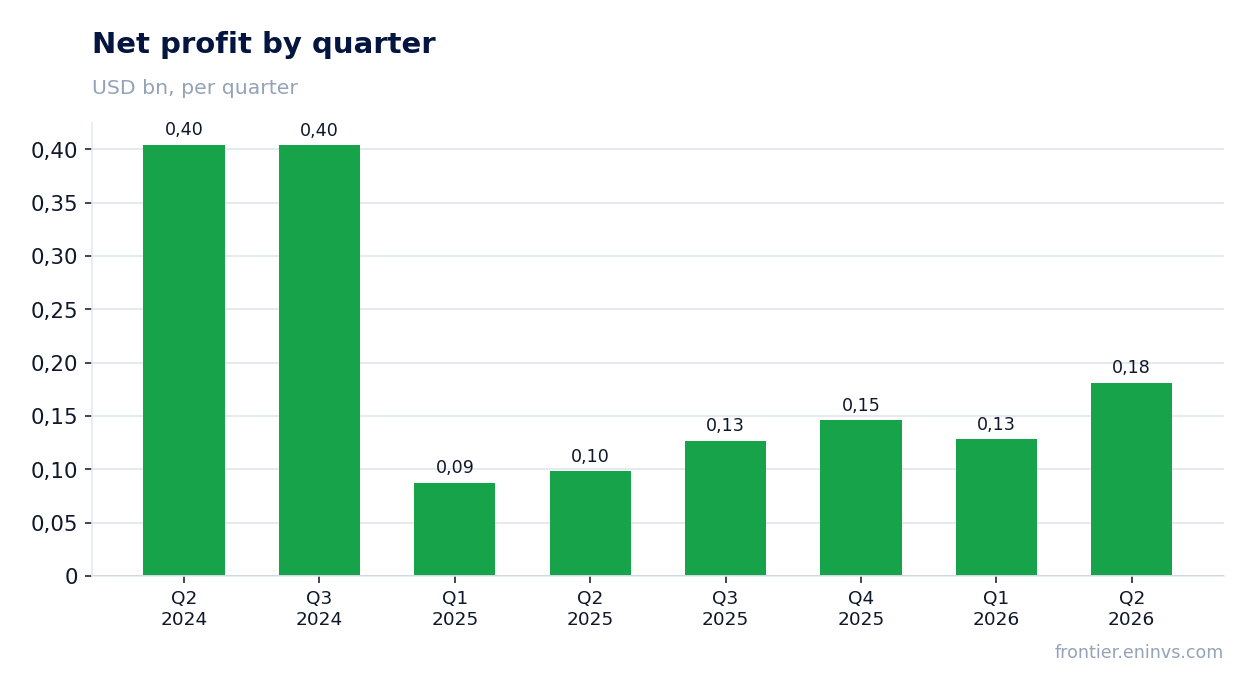
— Net profit rose 84.5% thanks to operating leverage and possibly one-off factors
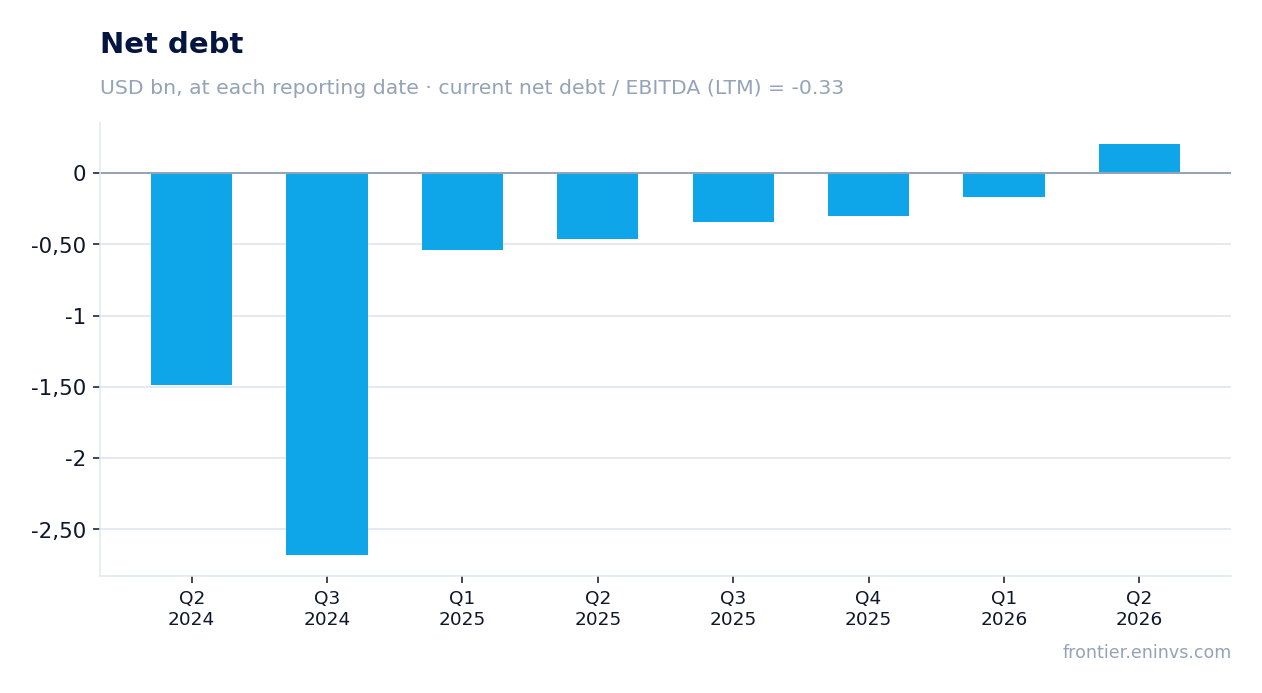
— The company posted net debt of 205.2 million USD for the first time in two years
— Operating cash flow over the last 12 months was 594.1 million USD, but Q2 data is missing
— Capital expenditures in Q2 are undisclosed, but over the last 12 months they totaled 594.1 million USD
— Trailing dividend yield is 9.8%, above the market average
Attractiveness
Key figures, USD bn
| Metric | Q2 2025 | Q2 2026 | Change |
|---|---|---|---|
| Revenue | 0.48 | 0.53 | +11.0% |
| EBITDA | 0.15 | 0.26 | +79.3% |
| Operating profit | 0.14 | 0.22 | +50.9% |
| Net profit | 0.10 | 0.18 | +84.5% |
| Operating cash flow | 0.25 | — | — |
| Capex | 0.21 | — | — |
| EBITDA margin | 31.0% | 50.0% | +19.0 pp |
| Net margin | 20.6% | 34.3% | +13.7 pp |
Revenue in Q2 2026 grew 11.0% YoY after two quarters of decline
In Q2 2026, revenue reached 528.3 million USD, up 11.0% from the same quarter a year earlier. This is the second consecutive quarter of growth after declines of 73.6% in Q1 2025 and 15.3% in Q2 2025. In Q3 2025, the decline nearly stopped – down 1.0%.
Quarterly dynamics show recovery: since Q3 2025, revenue has grown consistently from 490.5 to 528.3 million USD. The drivers are not named in the report, but the trend is clear – the company is emerging from a prolonged downturn.
EBITDA margin reached 50.0% – the highest in the period under review
In Q2 2026, EBITDA was 219.0 million USD, with an EBITDA margin of 50.0% versus 31.0% a year earlier. The 19-percentage-point margin expansion stems from faster EBITDA growth (+79.3%) compared to revenue (+11.0%).
Absolute EBITDA was the highest across all quarters presented in the report – the previous peak was in Q2 2024 (282.8 million USD), but the margin was lower then. The margin improvement likely reflects cost optimization and a shift in revenue mix.
Net profit rose 84.5% thanks to operating leverage and possibly one-off factors
Net profit in Q2 2026 was 181.2 million USD, up 84.5% from a year earlier. Profit growth outpaced EBITDA growth, indicating operating leverage – as revenue rises, fixed costs are spread over a larger base.
In prior periods, net profit sometimes significantly exceeded operating profit (e.g., Q2 2024: 404.4 million USD vs. operating profit of 227.1 million USD), suggesting non-operating income. In Q2 2026, net profit (181.2 million USD) was below operating profit (218.0 million USD), which may reflect tax and interest expenses.
The company posted net debt of 205.2 million USD for the first time in two years
At the end of Q2 2026, net debt was 205.2 million USD – the company swung to debt for the first time in the period under review. A year earlier, in Q2 2025, it had a net cash position of 463.9 million USD, and even earlier – 1486.2 million USD in Q2 2024.
Net debt increased by 0.4 billion USD over the quarter and by 0.1 billion USD over 12 months. The net debt to EBITDA ratio over the last 12 months is -0.33 – that is, the company still has a net cash position based on the latest data, but the trend is clearly negative.
Operating cash flow over the last 12 months was 594.1 million USD, but Q2 data is missing
Over the last 12 months (as of June 30, 2026), operating cash flow was 594.1 million USD. The figure for Q2 2026 is not disclosed, so assessing current dynamics is impossible.
In previous quarters, OCF was volatile: from 59.0 million USD in Q3 2025 to 543.8 million USD in Q2 2024. Such volatility is typical for companies with large contracts and seasonal receipts.
Capital expenditures in Q2 are undisclosed, but over the last 12 months they totaled 594.1 million USD
Capital expenditure data for Q2 2026 is missing. Over the last 12 months, capex was 594.1 million USD – exactly the same amount as operating cash flow, indicating a high share of investments in revenue.
In previous quarters, capex was consistently high: from 153.3 million USD in Q1 2025 to 233.7 million USD in Q4 2025. If the company continues investing at this pace, free cash flow will remain under pressure despite profit growth.
Trailing dividend yield is 9.8%, above the market average
Over the last 12 months, the dividend yield was 9.8% – a high figure, especially given growing profits. If the company maintains its dividend policy, the current yield could be sustainable.
However, the shift to net debt may limit the ability to pay dividends at the previous level. Investors should watch the ratio of dividend payments to free cash flow.
Valuation on the latest reported figures
| Metric | Value |
|---|---|
| Market cap | 4.39 bn USD |
| P/E (LTM) | 7.5 |
| EV/EBITDA (LTM) | 6.3 |
| P/B | 0.88 |
| Net debt / EBITDA (LTM) | -0.33 |
| Operating cash flow (LTM) | 0.59 bn |
| ROE | 15.3% |
| Dividend yield (12m) | 9.8% |
Bottom line
The Q2 2026 report is strong: revenue returned to growth, EBITDA margin reached 50.0%, and net profit rose 84.5%. However, this growth is driven by operating leverage, not business expansion, and the company posted net debt for the first time in two years. Valuation remains attractive: P/E LTM 7.5, EV/EBITDA LTM 6.3, dividend yield 9.8%, and the portal's model implies +29% upside. The key question for holders is whether the company can generate enough cash flow to fund investments and dividends without further debt accumulation.
Open the company's financial profile ADRO →
See also: market overview · valuation map · stock screeners