ANTAM: H1 revenue down 99.9%, yet EBITDA margin up to 14.3%
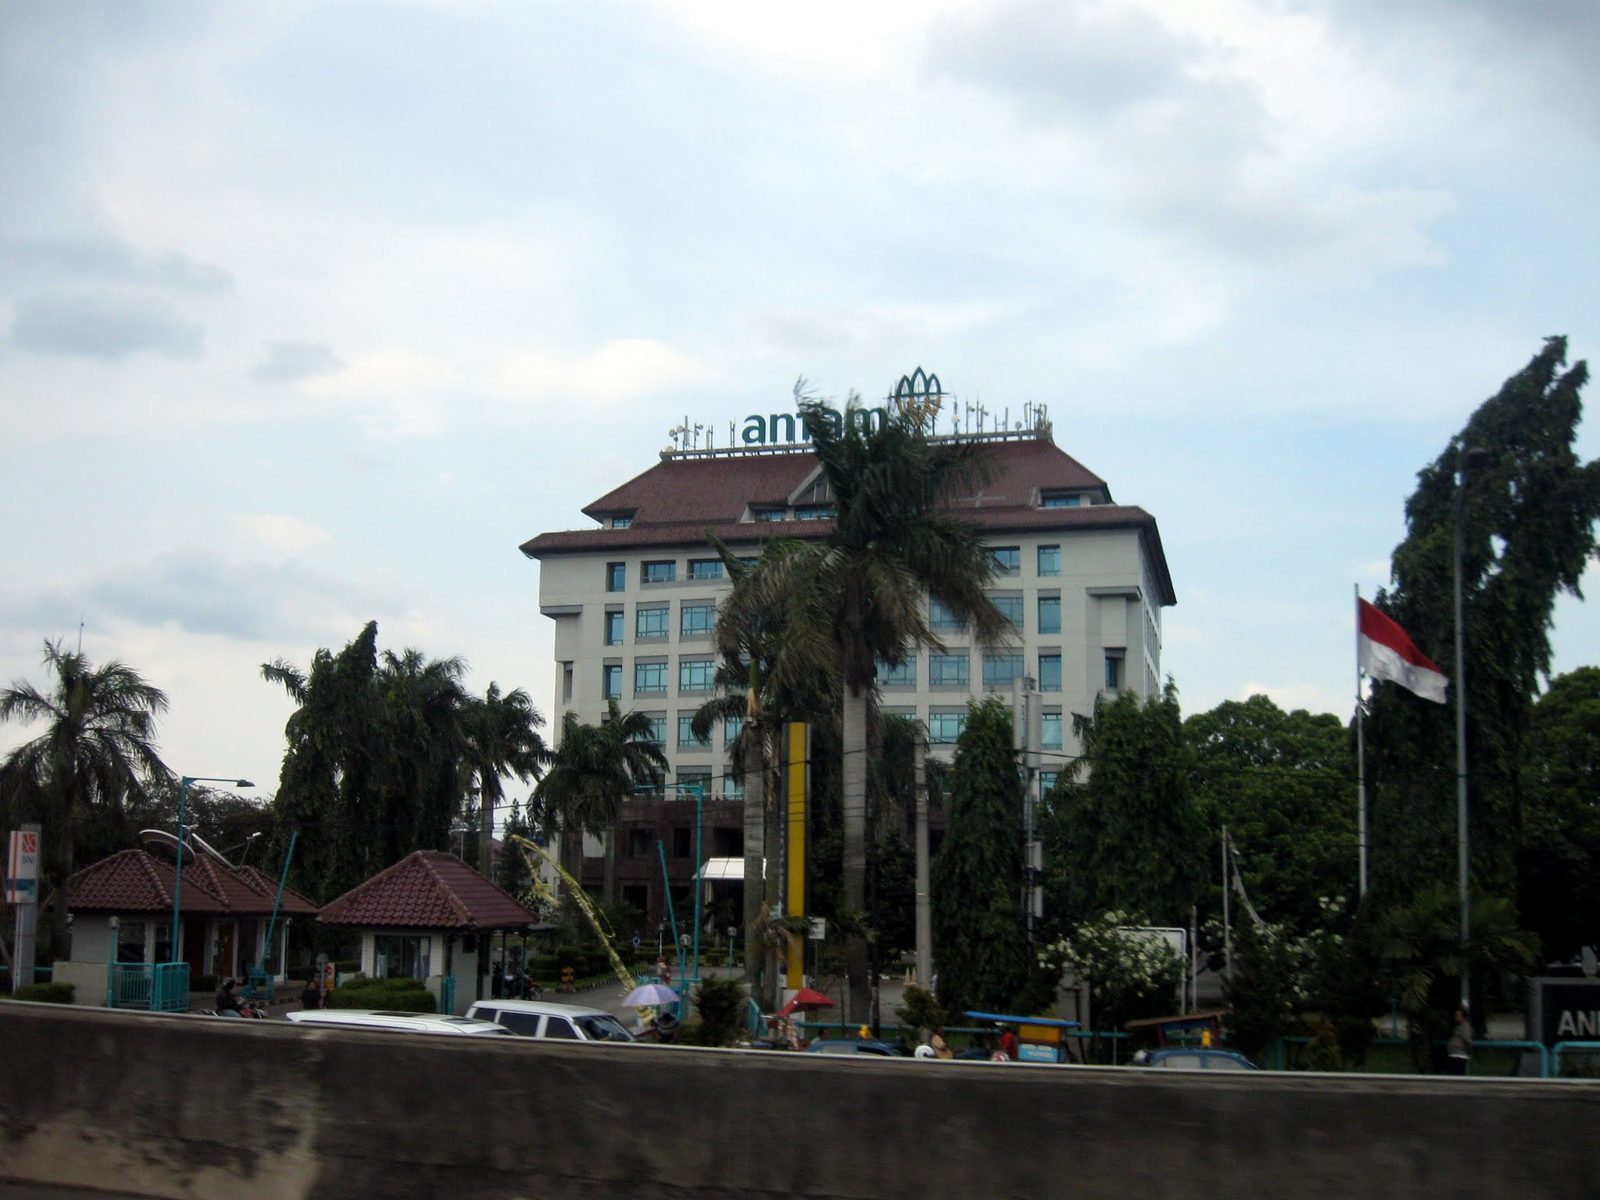
On August 28, ANTAM reported its H1 2026 results. Revenue for the half-year was IDR 88.3 billion, down 99.9% year-on-year, while EBITDA margin expanded from 11.4% to 14.3%. Against this backdrop, the shares look unattractive: the portal's model implies 60% downside.
Key takeaways
— H1 revenue collapsed 99.9% to IDR 88.3 billion
— EBITDA margin rose to 14.3% from 11.4% a year earlier
— H1 net profit fell 99.9% to IDR 6.9 billion
— Leverage: net debt is negative, but net debt/EBITDA is 0.0
— Quarterly capex dropped to IDR 83.5 million
— Trailing dividend yield is 6.8%
Attractiveness
Key figures, IDR bn
| Metric | H1 2025 | H1 2026 | Change |
|---|---|---|---|
| Revenue | 59 020 | 62.7 | -99.9% |
| EBITDA | 6 752 | 8.98 | -99.9% |
| Operating profit | 6 138 | 8.44 | -99.9% |
| Net profit | 4 696 | 6.39 | -99.9% |
| Operating cash flow | 2 275 | -0.75 | -100.0% |
| Capex | 244 | 0.23 | -99.9% |
| EBITDA margin | 11.4% | 14.3% | +2.9 pp |
| Net margin | 8.0% | 10.2% | +2.2 pp |
H1 revenue collapsed 99.9% to IDR 88.3 billion
In H1 2026, ANTAM's revenue was IDR 88.3 billion, down 99.9% from the same period a year earlier. The decline looks catastrophic but is partly due to a base effect: H1 2025 revenue was abnormally high.
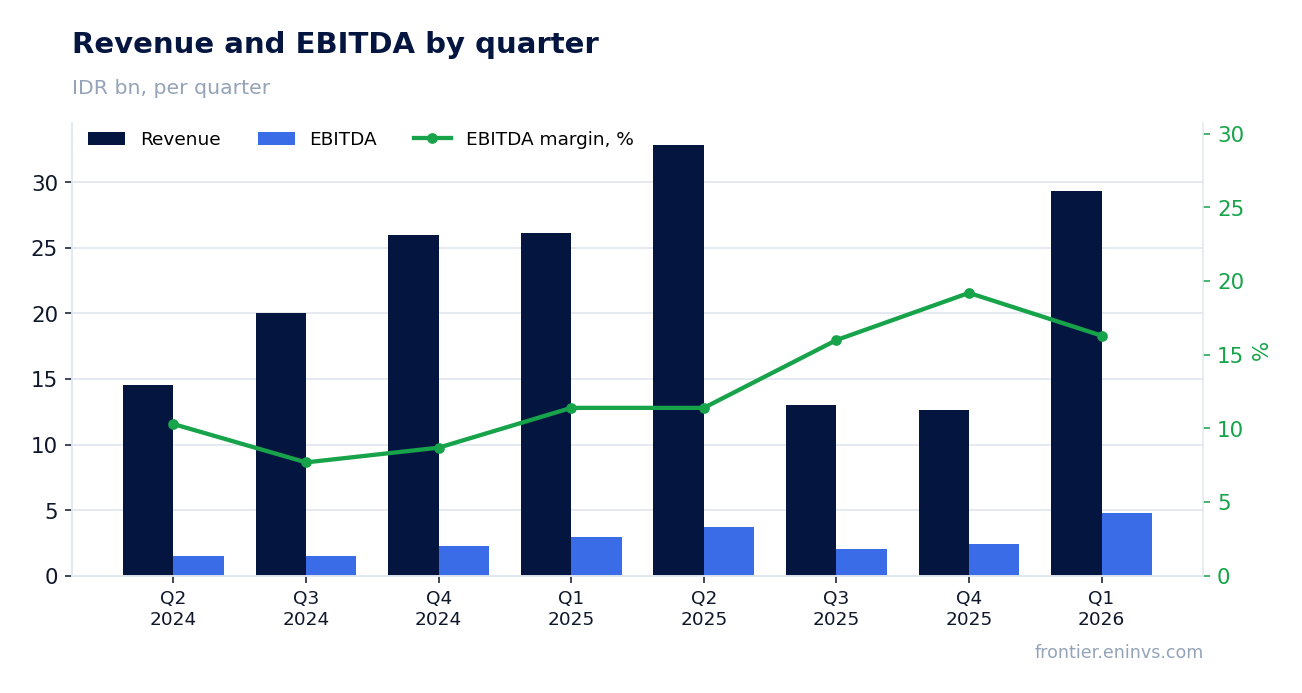
Quarterly dynamics show the collapse began in Q3 2025, when revenue fell 35% YoY, and Q4 2025 saw a 51.5% drop. In Q1 2026, the decline slowed to 12.1%, hinting at a possible bottom, but it is too early to call a recovery.
EBITDA margin rose to 14.3% from 11.4% a year earlier
Despite the revenue collapse, H1 2026 EBITDA margin was 14.3% versus 11.4% a year earlier. This suggests the company managed to maintain operational efficiency by cutting costs in line with lower revenue.
In absolute terms, H1 EBITDA was around IDR 12.6 billion (calculated: 88.3 billion × 14.3%), well below the year-ago level. The margin expansion is positive but does not offset the scale of the business contraction.
H1 net profit fell 99.9% to IDR 6.9 billion
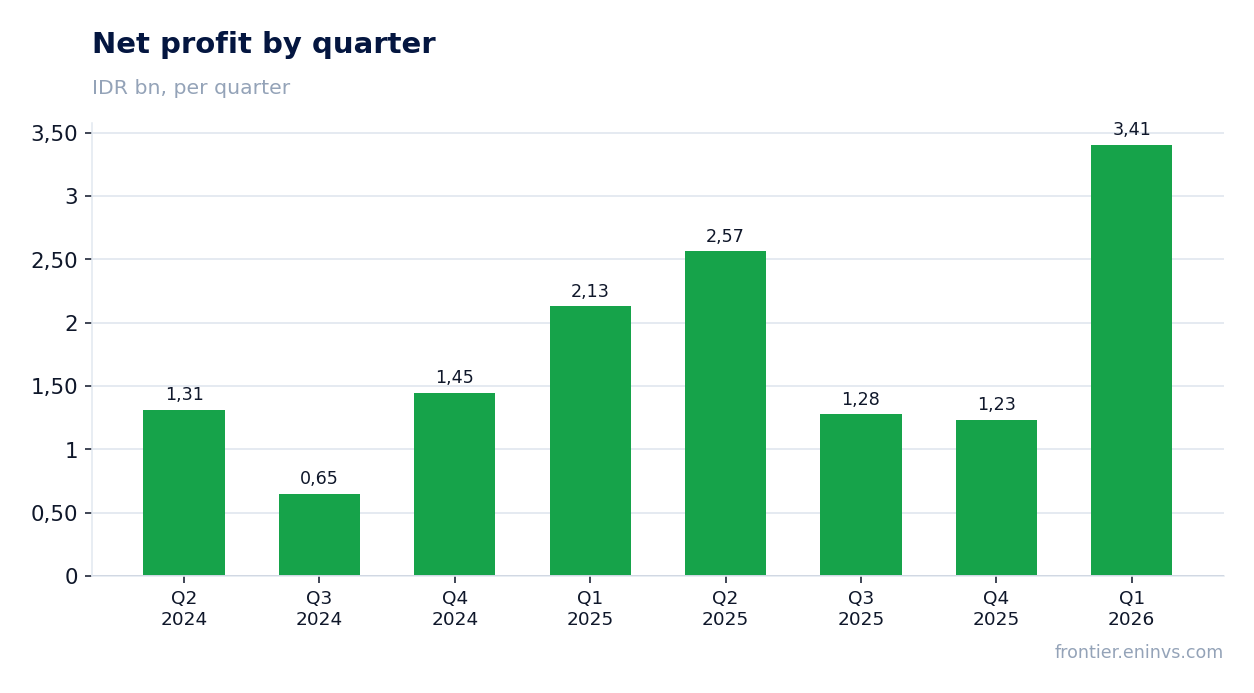
H1 2026 net profit was IDR 6.9 billion, down 99.9% from H1 2025. On a per-share basis, this is about IDR 265.85 (per the report), sharply contrasting with IDR 195.43 a year earlier – but these figures are not comparable due to different bases.
The profit decline mirrors the overall drop in operating activity. Still, net margin rose to 10.2% from 8.0% a year earlier, indicating better cost control.
Leverage: net debt is negative, but net debt/EBITDA is 0.0
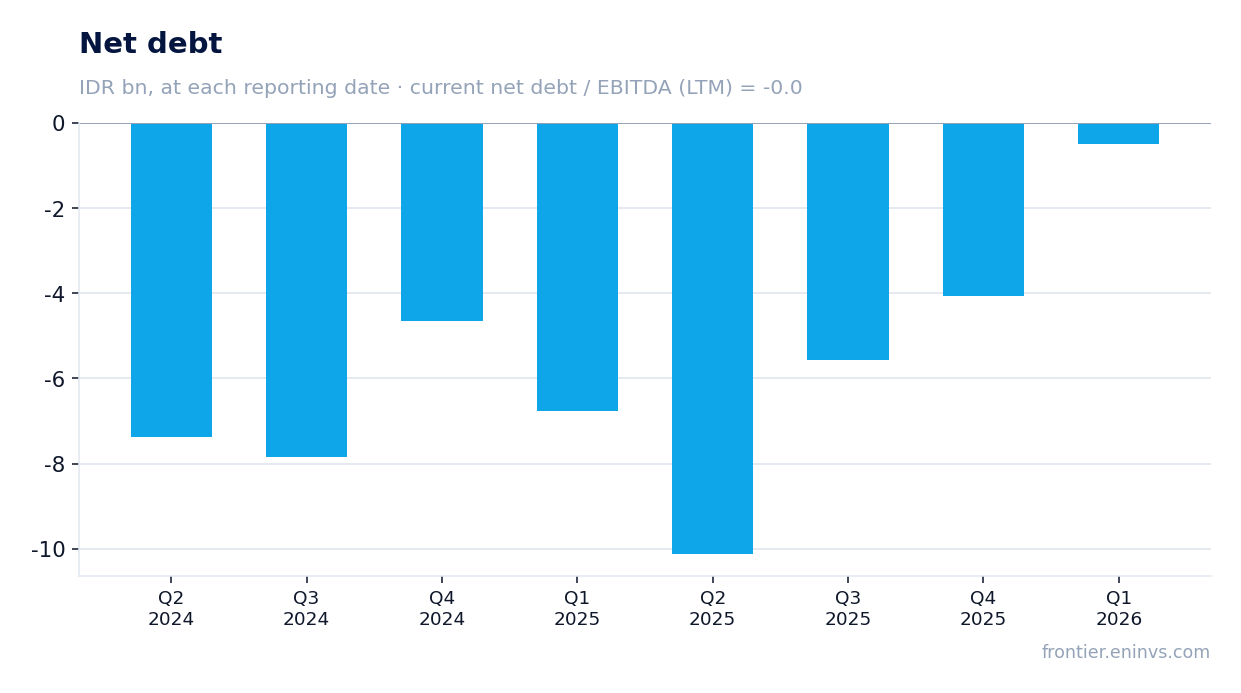
At end-H1 2026, ANTAM's net debt was IDR -4,061.5 billion, meaning the company had more cash than debt. Net debt/EBITDA for the trailing twelve months was 0.0, indicating minimal leverage.
Over the past 12 months, net debt increased by IDR 10,076.8 billion but remains negative. This suggests the company funds its operations mostly with internal resources, reducing refinancing risks.
Quarterly capex dropped to IDR 83.5 million
In Q2 2026, ANTAM's capex was just IDR 83.5 million – the lowest level in two years. For comparison, Q1 2026 capex was IDR 83.5 million, and a year earlier it was IDR 16,083 million.
The sharp capex cut may reflect management caution amid falling revenue. However, it also limits the potential for mining and processing growth, questioning the future recovery.
Trailing dividend yield is 6.8%
Over the trailing twelve months, ANTAM paid dividends yielding 6.8% at the current market cap of IDR 74,255,172 million. This is well above the Indonesian market average, which may attract income-focused investors.
However, with H1 profit down 99.9% and uncertain future cash flows, maintaining such a dividend level is unlikely. The company has already declared dividends payable of IDR 4,901,547 million, exceeding its H1 net profit.
Valuation on the latest reported figures
| Metric | Value |
|---|---|
| Market cap | 74 255 bn IDR |
| P/E (LTM) | 8.3 |
| EV/EBITDA (LTM) | 5.5 |
| P/B | 2.03 |
| Net debt / EBITDA (LTM) | -0.00 |
| Operating cash flow (LTM) | 4.90 bn |
| ROE | 33.6% |
| Dividend yield (12m) | 6.8% |
Bottom line
ANTAM showed a catastrophic drop in H1 revenue and profit, though margins improved. The company retains negative net debt and low leverage, providing a safety cushion. However, at current valuations – P/E 8.3 and EV/EBITDA 5.5 – the shares look overvalued, especially given the portal's model implying 60% downside. The 6.8% dividend yield may not persist. Verdict: unattractive.
Open the company's financial profile ANTM →
See also: market overview · valuation map · stock screeners