ID_INCO: Q2 EBITDA up 10x – but almost half of profit still not in cash
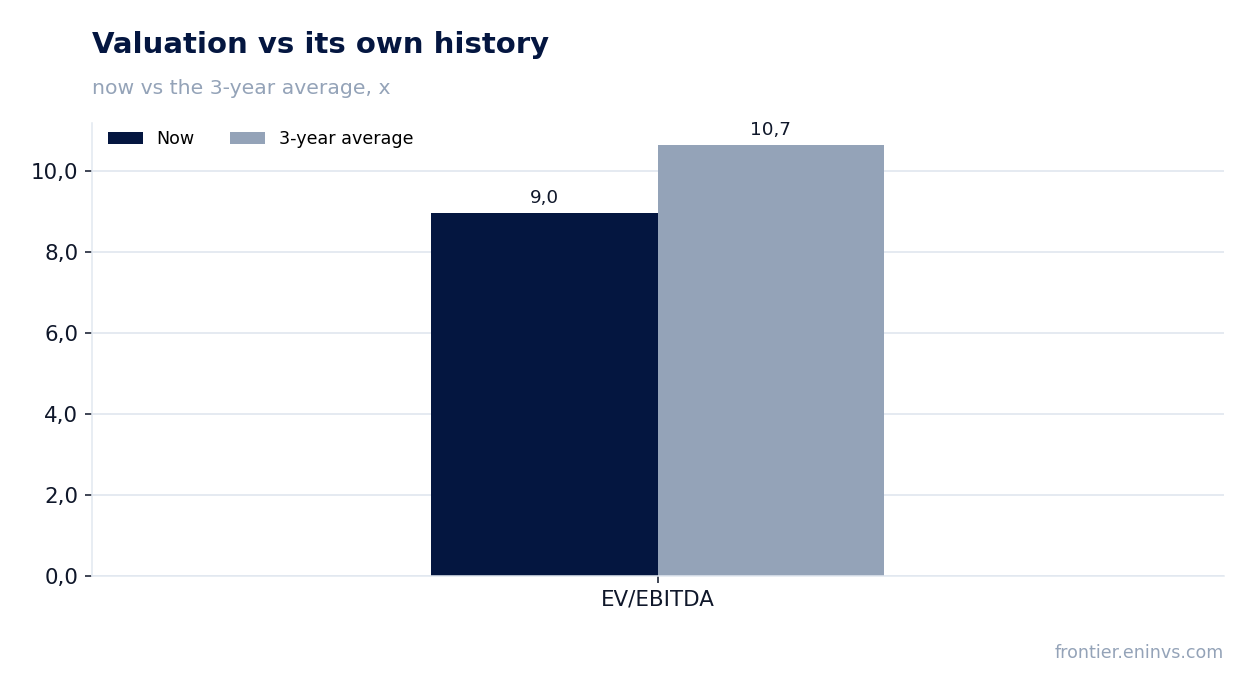
25 августа ID_INCO раскрыла результаты за второй квартал 2026 года: выручка выросла на 31,9% год к году до 290,4 млн USD, EBITDA – на 944,5% до 89,9 млн USD, чистая прибыль – на 871,0% до 60,8 млн USD. Рентабельность по EBITDA достигла 31,0% против 3,9% годом ранее, а чистая маржа – 20,9% против 2,8%. При этом операционный денежный поток за квартал не раскрыт, а за последние 12 месяцев он составил 234,7 млн USD – заметно меньше чистой прибыли за тот же период (174,2 млн USD), что ставит вопрос о качестве прибыли. На текущей цене акция выглядит скорее непривлекательно: мультипликатор EV/EBITDA (9,0) ниже собственного трёхлетнего среднего (10,7), но модель портала оценивает потенциал снижения в -56%.
Key takeaways
— Q2 2026 revenue grew 31.9% YoY – accelerating from +22.3% in Q1
— Q2 EBITDA jumped 944.5% – margin reached 31.0% versus 3.9% a year ago
— Net profit rose 871.0%, but operating cash flow over the last 12 months lags it by 60.5 million USD
— Leverage stands at -1.31 net debt/EBITDA LTM – the company remains a net creditor
— Capex in Q2 was 115.9 million USD – more than the operating cash flow in the same quarter a year earlier
— Trailing 12-month dividend yield is 1.6%, below what we consider a fair yield
— The portal's model implies a -56% downside from the current price
Attractiveness
Key figures, USD bn
| Metric | Q2 2025 | Q2 2026 | Change |
|---|---|---|---|
| Revenue | 0.22 | 0.29 | +31.9% |
| EBITDA | 0.01 | 0.09 | +944.5% |
| Operating profit | -0.00 | 0.07 | to profit |
| Net profit | 0.01 | 0.06 | +871.0% |
| Operating cash flow | 0.04 | — | — |
| Capex | 0.10 | 0.12 | +20.0% |
| EBITDA margin | 3.9% | 31.0% | +27.1 pp |
| Net margin | 2.8% | 20.9% | +18.1 pp |
Q2 2026 revenue grew 31.9% YoY – accelerating from +22.3% in Q1
In Q2 2026, ID_INCO's revenue reached 290.4 million USD, up 31.9% from the same quarter a year earlier. This is an acceleration from Q1 2026, when growth was 22.3% versus Q1 2025. Sequentially, revenue also rose from 252.7 million USD in Q1 2026 to 290.4 million USD in Q2.
The acceleration in the top line is the key positive signal in the report. It suggests that demand for the company's products is not weakening but rather gaining momentum. If this pace persists, it should support margins and cash flow in the coming periods.
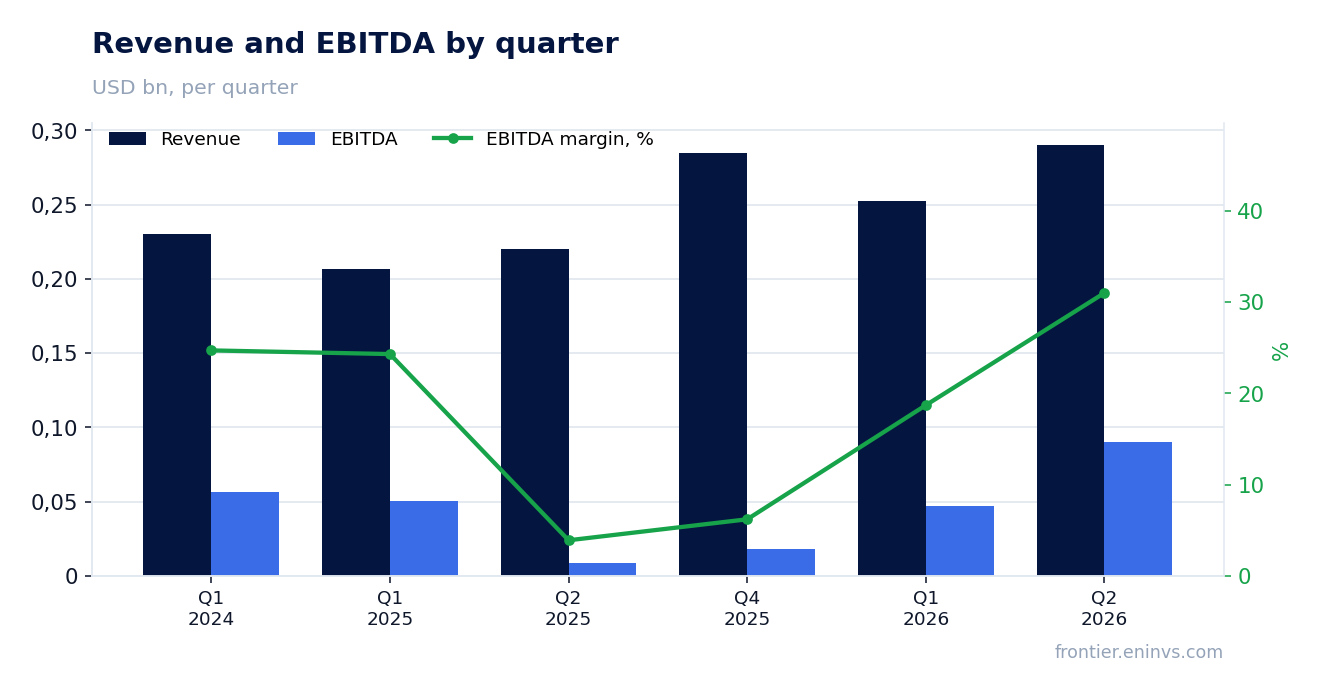
Q2 EBITDA jumped 944.5% – margin reached 31.0% versus 3.9% a year ago
EBITDA for Q2 2026 grew 944.5% YoY to 89.9 million USD. A year earlier, the figure was only 8.6 million USD – an abnormally weak quarter, so the high percentage growth is due to a low base. Nevertheless, the absolute level of EBITDA is the best in recent quarters: Q2 2025 – 8.6 million USD, Q4 – 17.8 million USD, Q1 2026 – 47.3 million USD.
The EBITDA margin in Q2 2026 reached 31.0% versus 3.9% a year earlier. This indicates a significant improvement in operating efficiency. Operating profit also rose from -0.8 million USD to 74.4 million USD YoY, confirming that EBITDA growth is not due to one-off items but reflects improved core business.
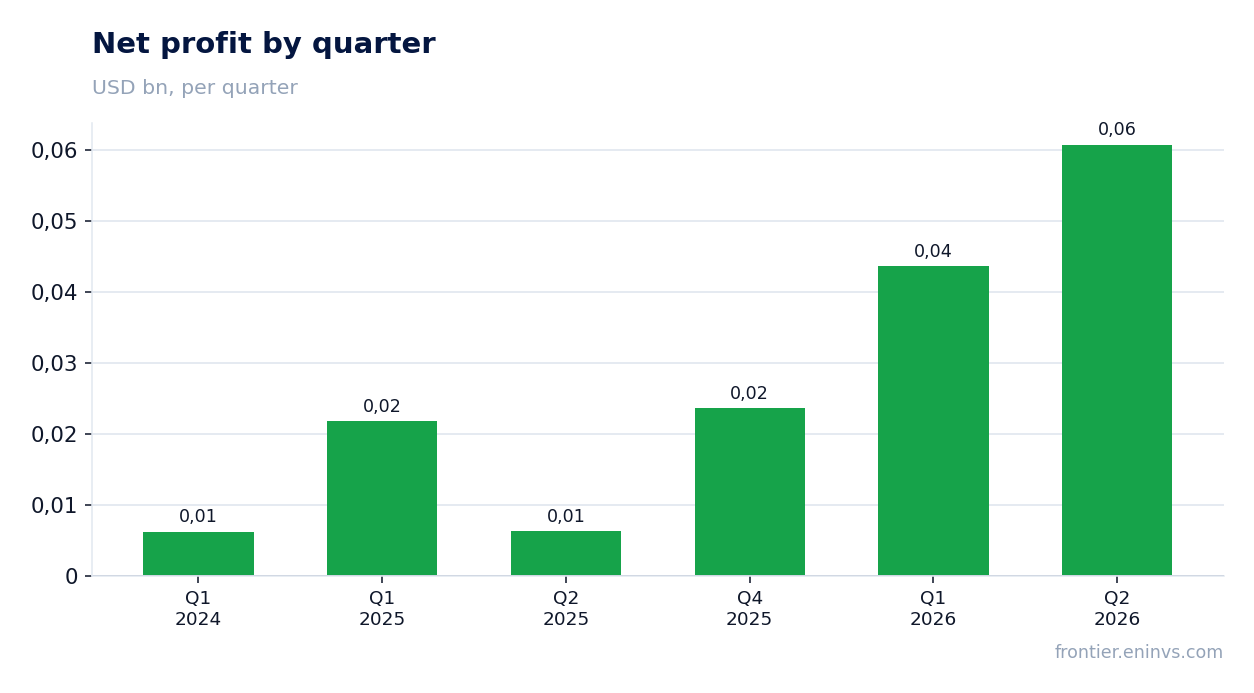
Net profit rose 871.0%, but operating cash flow over the last 12 months lags it by 60.5 million USD
Net profit in Q2 2026 reached 60.8 million USD, up 871.0% from 6.3 million USD a year earlier. Over the last 12 months, net profit totaled 174.2 million USD. However, operating cash flow for the same period was 234.7 million USD, which is 60.5 million USD less than net profit. This discrepancy means that part of the profit has not yet materialized into cash.
The gap between profit and cash flow is typical for fast-growing companies that are building working capital. But if it persists, it will limit the company's ability to fund capex and dividends from operating flow. In Q2 2026, operating cash flow was not disclosed, so we cannot assess the trend.
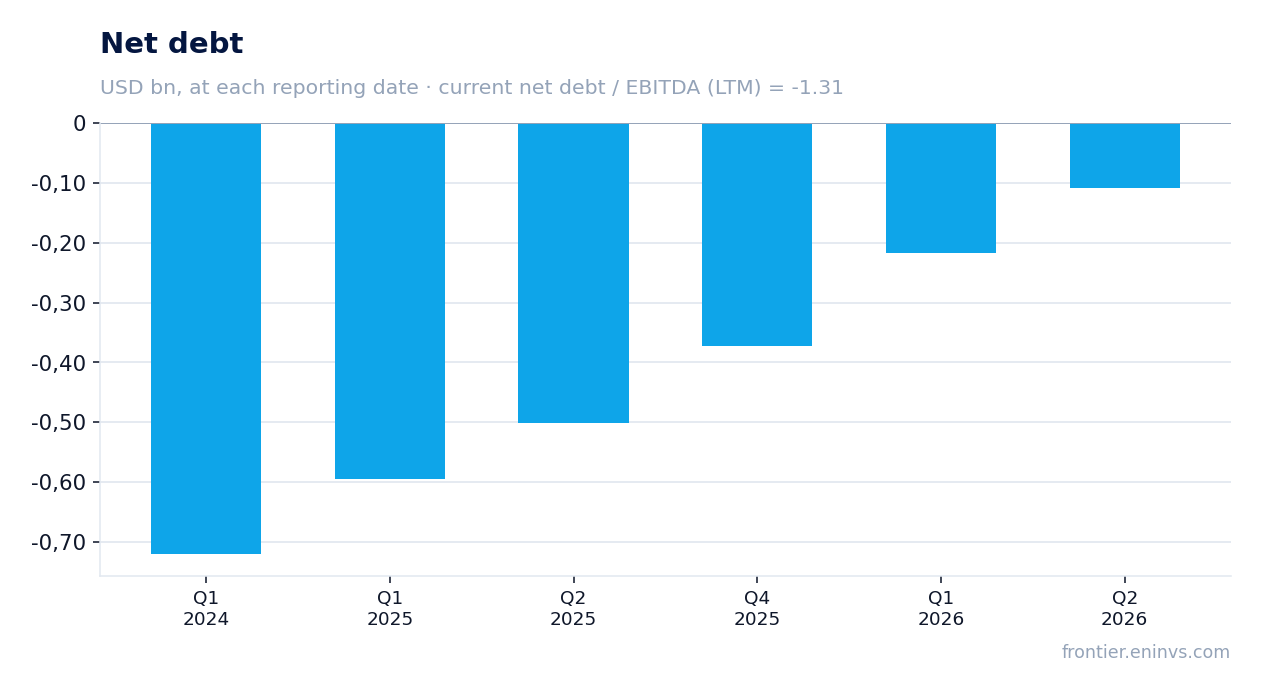
Leverage stands at -1.31 net debt/EBITDA LTM – the company remains a net creditor
As of the latest balance sheet date, net debt is negative: -372.9 million USD. The net debt/EBITDA ratio for the last 12 months is -1.31. A negative value means that cash and financial investments exceed debt, so the company is a net creditor.
During the quarter, net debt increased by 0.1 billion USD, and over the last 12 months by 0.4 billion USD. This means the company is spending more than it generates, but the safety margin remains significant. However, if the trend continues, the company may lose its net creditor status.
Capex in Q2 was 115.9 million USD – more than the operating cash flow in the same quarter a year earlier
Capital expenditures in Q2 2026 were 115.9 million USD. For comparison, in Q2 2025 they were 96.6 million USD, while operating cash flow then was only 37.5 million USD. Thus, the company is investing significantly more than it generates operationally, covering the difference with existing cash.
High capex is a sign of an active expansion phase. It may drive future revenue growth, but it currently pressures free cash flow. Over the last 12 months, operating cash flow was 234.7 million USD, while total capex over four quarters (including Q2 2025, Q4 2025, Q1 2026, and Q2 2026) was 506.1 million USD, significantly exceeding operating flow.
Trailing 12-month dividend yield is 1.6%, below what we consider a fair yield
The trailing 12-month dividend yield is 1.6%. This is below the level we consider fair for a stock with such growth characteristics and risk profile. The low yield is explained by the company directing significant funds to investments rather than shareholder payouts.
For a dividend-oriented investor, the stock is currently unattractive. However, if the company maintains high growth rates and starts increasing payouts, the yield could rise. For now, the stock's main value lies in capital appreciation potential, not current income.
The portal's model implies a -56% downside from the current price
According to the portal's model, which reprices EBITDA at current commodity prices and applies a target EV/EBITDA multiple, the fair value of the share is 56% below the current market price. This means the market has already priced in a very optimistic growth scenario, and even if current performance persists, the stock is overvalued.
It is important to emphasize that this is not a consensus forecast or a target price, but the result of the portal's own model. Nevertheless, the signal is alarming: it suggests that the current price leaves little room for error in executing the growth strategy.
Valuation on the latest reported figures
| Metric | Value |
|---|---|
| Market cap | 2.93 bn USD |
| P/E (LTM) | 16.8 |
| EV/EBITDA (LTM) | 9.0 |
| P/B | 1.05 |
| Net debt / EBITDA (LTM) | -1.31 |
| Operating cash flow (LTM) | 0.23 bn |
| ROE | 8.6% |
| Dividend yield (12m) | 1.6% |
| EV/EBITDA, 3-year average | 10.7 |
Bottom line
The Q2 2026 report is strong: revenue accelerated to +31.9%, EBITDA margin reached 31.0%, and net profit grew more than eightfold. However, the quality of this profit raises questions: operating cash flow over the last 12 months is 60.5 million USD below net profit, and capex significantly exceeds operating flow. At the same time, the stock's valuation remains high: the portal's model implies a -56% downside, and a dividend yield of 1.6% does not compensate for this risk. Our verdict is rather unattractive: we would like to see profit conversion into cash flow and a more moderate valuation before changing our view.
Open the company's financial profile INCO →
See also: market overview · valuation map · stock screeners