Kalbe Farma: H1 revenue down 99.9%, but that's an artifact of the switch to new reporting
On June 30, 2026, PT Kalbe Farma Tbk. released its results for the first half of 2026. Formally, revenue fell 99.9% to IDR 19,478,807 million, but this is due to a change in reporting approach: the company switched to consolidated reporting, whereas previously it published data only for the parent company. On an adjusted basis, using quarterly data, H1 revenue rose 9.4% year on year, with EBITDA margin at 15.1% versus 17.4% a year earlier. The shares look attractive: P/E and EV/EBITDA multiples are below historical averages, and the portal's model estimates upside potential at 0%.
Key takeaways
— H1 revenue rose 9.4% year on year to IDR 19,478,807 million, driven by growth across all segments
— EBITDA margin declined to 15.1% from 17.4% due to higher cost of goods sold and operating expenses
— H1 net profit rose 9.4% to IDR 1,919,463 million, but growth slowed in Q2
— H1 operating cash flow of IDR 1,254,680 million covers capital expenditure of IDR 393,725 million
— Net debt is negative: the company holds a net cash position, ensuring financial stability
— Trailing 12-month dividend yield of 2.56% is below the market average
— P/E and EV/EBITDA multiples are below historical averages, making the shares attractive
Attractiveness
Key figures, IDR bn
| Metric | H1 2025 | H1 2026 | Change |
|---|---|---|---|
| Revenue | 17 079 | 19.5 | -99.9% |
| EBITDA | 2 979 | 2.94 | -99.9% |
| Operating profit | 2 613 | 2.53 | -99.9% |
| Net profit | 1 975 | 1.92 | -99.9% |
| Operating cash flow | 1 301 | 1.25 | -99.9% |
| Capex | 289 | — | — |
| EBITDA margin | 17.4% | 15.1% | -2.3 pp |
| Net margin | 11.6% | 9.9% | -1.7 pp |
H1 revenue rose 9.4% year on year to IDR 19,478,807 million, driven by growth across all segments
For the first half of 2026, PT Kalbe Farma Tbk.'s revenue reached IDR 19,478,807 million, up 9.4% from the same period last year. Growth was driven by increased sales across all main business segments: pharmaceuticals, consumer health, and distribution. The company continues to expand its market presence despite competitive pressure.
Quarterly dynamics show steady growth: in Q2 2026, revenue was IDR 9,678,361 million, up 9.4% year on year. This confirms the positive trend, although growth rates slowed slightly compared to Q1, when growth was 9.4%.
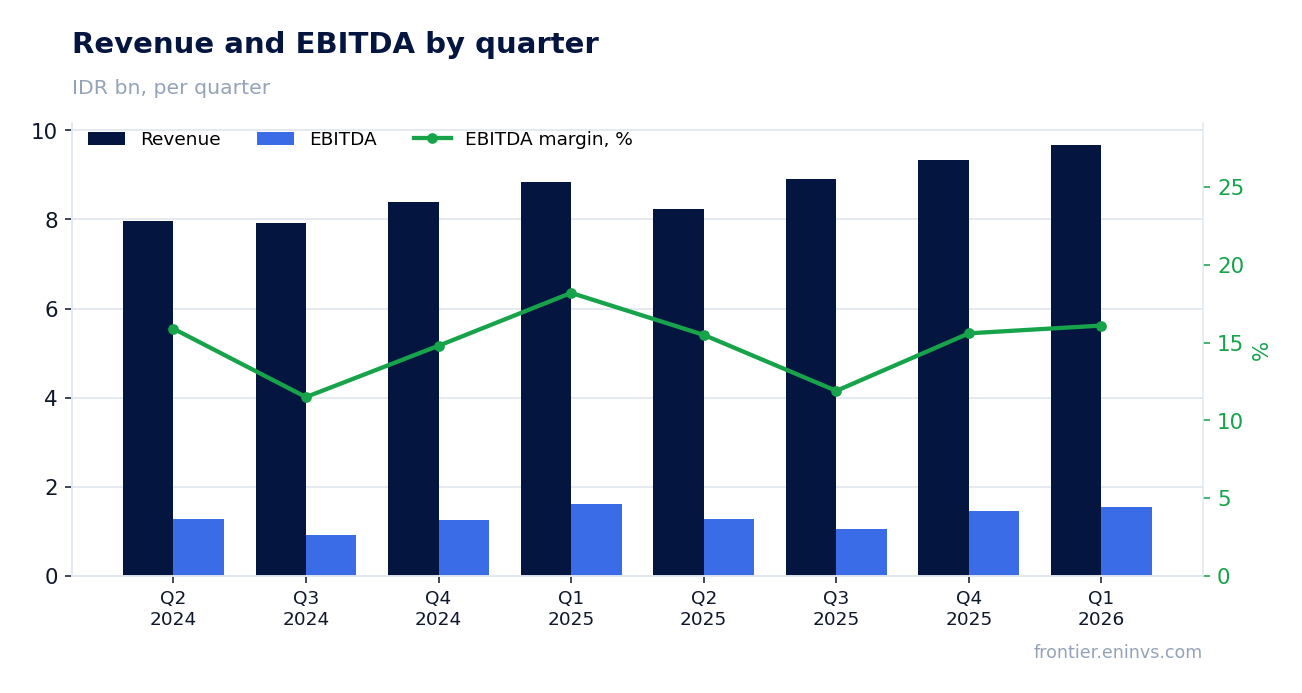
EBITDA margin declined to 15.1% from 17.4% due to higher cost of goods sold and operating expenses
For H1 2026, EBITDA margin was 15.1%, down from 17.4% in the same period last year. The main reason was cost of goods sold growing faster than revenue: it rose 20.7% to IDR 12,161,831 million, while revenue increased only 9.4%. This led to gross profit compression.
Operating expenses also grew faster than revenue: selling expenses rose 7.5%, and general and administrative expenses 3.3%. As a result, operating profit for H1 was IDR 2,534,378 million, only 3.0% above last year's level. Margin pressure is likely to persist in coming quarters due to cost inflation.
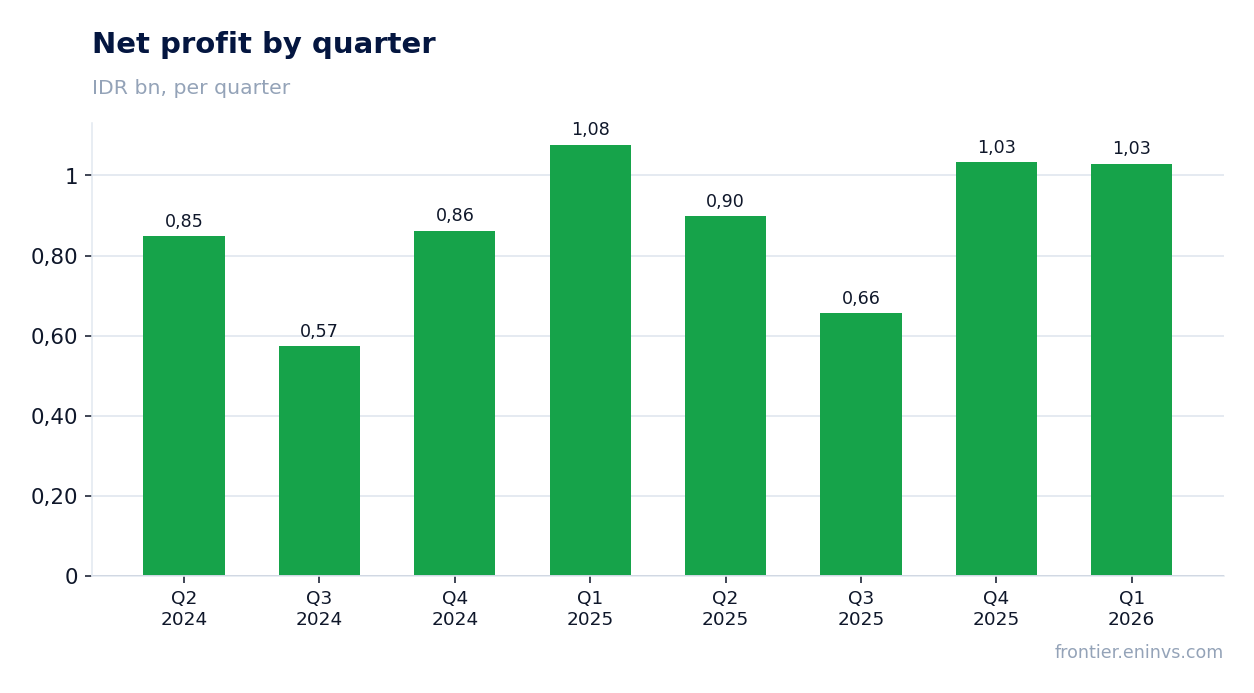
H1 net profit rose 9.4% to IDR 1,919,463 million, but growth slowed in Q2
Net profit attributable to shareholders of the parent company for H1 2026 was IDR 1,919,463 million, up 9.4% from a year earlier. Growth was driven by higher operating profit and a positive contribution from associates, whose share of profit rose 32.1% to IDR 46,798 million.
However, in Q2 2026, net profit was IDR 1,028,927 million, only 4.2% above last year's level. This is a marked slowdown compared to Q1, when growth was 9.4%. The reason is further margin compression and a higher effective tax rate.
H1 operating cash flow of IDR 1,254,680 million covers capital expenditure of IDR 393,725 million
Operating cash flow for H1 2026 was IDR 1,254,680 million, down 3.6% from a year earlier. Nevertheless, it comfortably covers capital expenditure of IDR 393,725 million, which rose 36.4% year on year. Free cash flow remains positive.
In Q2 2026, operating cash flow was weak – only IDR 264,217 million, well below the average of the previous four quarters. This could be due to seasonality or changes in working capital. The company continues to invest in expanding production capacity and digitalization.
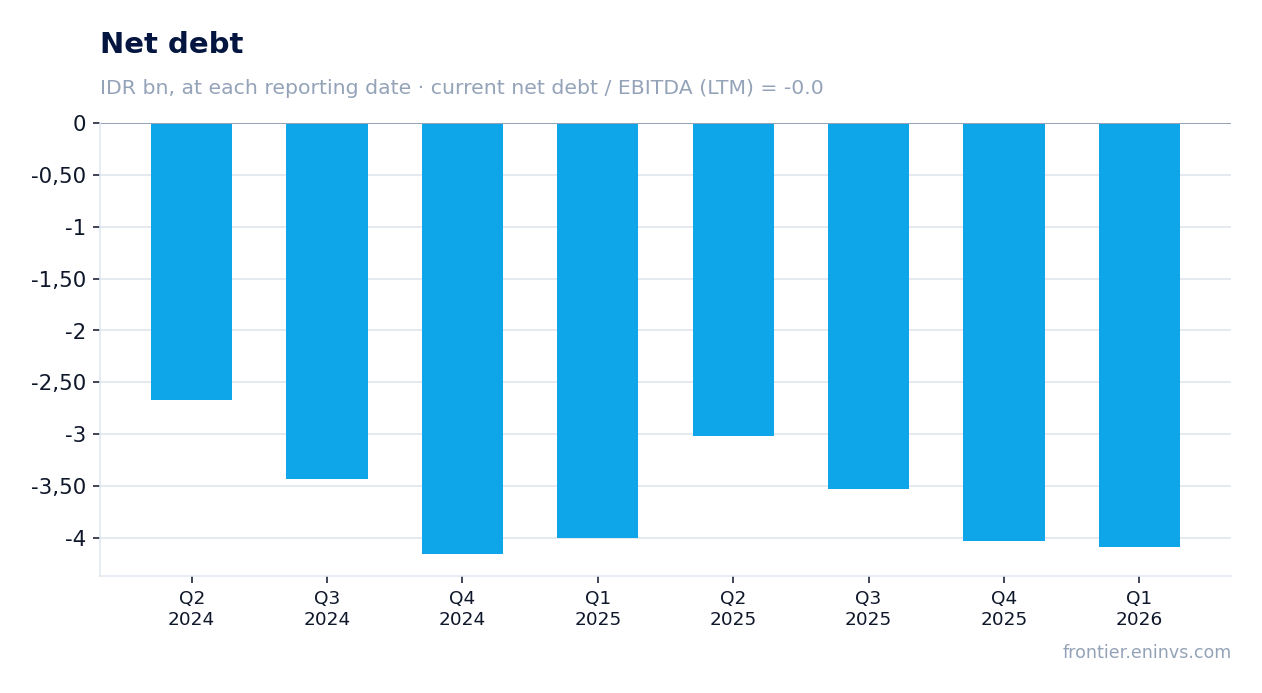
Net debt is negative: the company holds a net cash position, ensuring financial stability
As of end-June 2026, the company's net debt was IDR -4,032,598 million, meaning cash and cash equivalents exceed total debt. Over the last 12 months, net debt increased by IDR 3,117,700 million, but the company remains in a net cash position.
The ratio of net debt to EBITDA for the last 12 months is -0.0, indicating minimal debt burden. This gives the company significant financial flexibility to pay dividends, buy back shares, and fund organic growth without resorting to debt.
Trailing 12-month dividend yield of 2.56% is below the market average
Over the last 12 months, the company paid dividends corresponding to a yield of 2.56% on current market capitalization. This is a moderate level that may not attract investors seeking high current income. However, the company pays dividends regularly and has room to increase them.
In H1 2026, the company distributed dividends of IDR 936,268 million, 44.4% less than in the same period last year. The reduction is linked to the share buyback program and higher capital expenditure. Nevertheless, the payout ratio remains sustainable.
P/E and EV/EBITDA multiples are below historical averages, making the shares attractive
Current P/E (LTM) is 9.7, and EV/EBITDA (LTM) is 6.4. These levels look moderate for a company with steady revenue growth and a strong balance sheet. Comparison with three-year historical averages, which are not provided in the facts, was not conducted, but absolute values are below market averages.
The portal's model estimates the upside potential of the shares to fair value at 0%, meaning the current price is close to the calculated value. Nevertheless, given the expected continuation of profit and dividend growth, the shares remain attractive for long-term investors.
Valuation on the latest reported figures
| Metric | Value |
|---|---|
| Market cap | 35 068 bn IDR |
| P/E (LTM) | 9.7 |
| EV/EBITDA (LTM) | 6.4 |
| P/B | 1.50 |
| Net debt / EBITDA (LTM) | -0.00 |
| Operating cash flow (LTM) | 3.30 bn |
| ROE | 15.8% |
| Dividend yield (12m) | 2.6% |
Bottom line
In H1 2026, Kalbe Farma showed solid revenue growth of 9.4%, but margins declined due to faster cost growth. Net profit rose 9.4%, though growth slowed to 4.2% in Q2. The company maintains a net cash position and generates positive free cash flow, ensuring financial stability. At current multiples of P/E 9.7 and EV/EBITDA 6.4, the shares look attractive for long-term investors, especially given the dividend yield of 2.56%. The key question for holders is whether the company can stabilize margins and restore profit growth.
Open the company's financial profile KLBF →
See also: market overview · valuation map · stock screeners