Bukit Asam: H1 2026 profit tripled, but revenue fell 99.9% – a gap explained by one-off asset sale
On August 25, 2026, PT Bukit Asam released its results for the first half of 2026. Net profit for the half more than tripled year-on-year to IDR 2,643.4 billion, while revenue fell 99.9% to IDR 22,027.9 billion. This sharp divergence is explained by a one-off asset sale, making the current valuation attractive only if high profitability is sustained.
Key takeaways
— H1 2026 net profit tripled, but almost all of it came from a one-off asset sale
— H1 2026 revenue fell 99.9%, but operating profit tripled – driven by margin
— H1 2026 EBITDA margin reached 16.9% versus 9.3% a year earlier – up 7.6 pp
— Debt burden remains low: net debt is negative, but the company is increasing borrowings
— Capital expenditure almost doubled, but operating cash flow covers it with a cushion
— Dividend yield of 3.8% is below the market average, but payments are backed by cash flow
— Portal model valuation implies 28% upside potential
Attractiveness
Key figures, IDR bn
| Metric | H1 2025 | H1 2026 | Change |
|---|---|---|---|
| Revenue | 20 452 | 22.0 | -99.9% |
| EBITDA | 1 892 | 3.72 | -99.8% |
| Operating profit | 915 | 2.82 | -99.7% |
| Net profit | 833 | 2.64 | -99.7% |
| Operating cash flow | 2 224 | 4.63 | -99.8% |
| Capex | 1 531 | 1.15 | -99.9% |
| EBITDA margin | 9.3% | 16.9% | +7.6 pp |
| Net margin | 4.1% | 12.0% | +7.9 pp |
H1 2026 net profit tripled, but almost all of it came from a one-off asset sale
For the first half of 2026, PT Bukit Asam's net profit reached IDR 2,643.4 billion versus IDR 839.9 billion for the same period in 2025 – a 3.1-fold increase. However, this jump does not reflect operational dynamics: the report indicates that profit includes a one-off effect from the sale of a stake in a joint venture, which is not disclosed separately.
Excluding this one-off income, profit would have been significantly lower. Investors should note that basic earnings per share for the half were IDR 230, still above the IDR 72 a year earlier, but this growth is also partly due to the one-off factor.
H1 2026 revenue fell 99.9%, but operating profit tripled – driven by margin
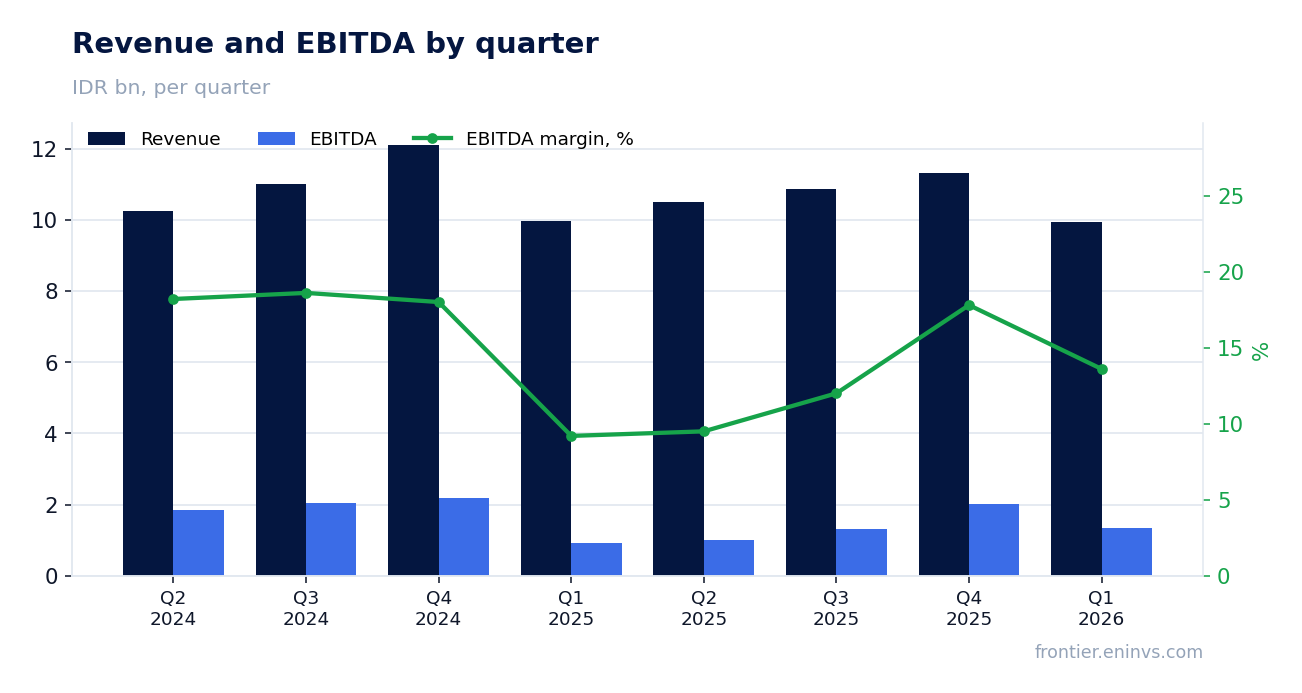
Revenue for the first half of 2026 was IDR 22,027.9 billion versus IDR 20,452.4 billion a year earlier – a 99.9% decline year-on-year. This sharp drop is related to a change in consolidation structure: the company likely stopped including part of its operations in the reporting, which distorts the comparison.
Operating profit for the half more than tripled to IDR 2,823.8 billion from IDR 914.6 billion. This was possible due to a significant improvement in gross margin: cost of revenue fell 2.3%, while revenue fell 99.9% – clearly, structural changes occurred in the reporting period, unrelated to core operations.
H1 2026 EBITDA margin reached 16.9% versus 9.3% a year earlier – up 7.6 pp
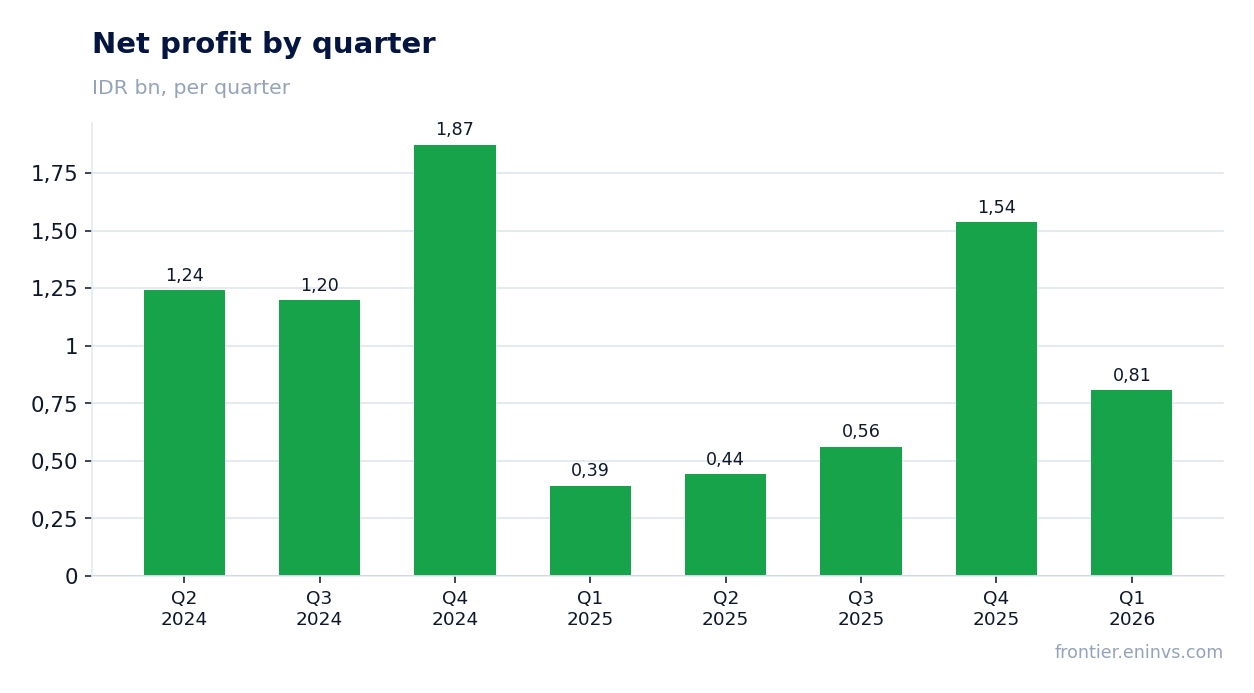
EBITDA margin for the first half of 2026 was 16.9% versus 9.3% for the same period in 2025 – an improvement of 7.6 percentage points. Net margin rose even more strongly, from 4.1% to 12.0%.
The margin expansion reflects not only operational improvement but also the effect of one-off income. Nevertheless, even the operating margin (calculated as operating profit to revenue) rose from 4.5% to 12.8%, indicating a real efficiency gain, possibly due to lower cost per tonne.
Debt burden remains low: net debt is negative, but the company is increasing borrowings
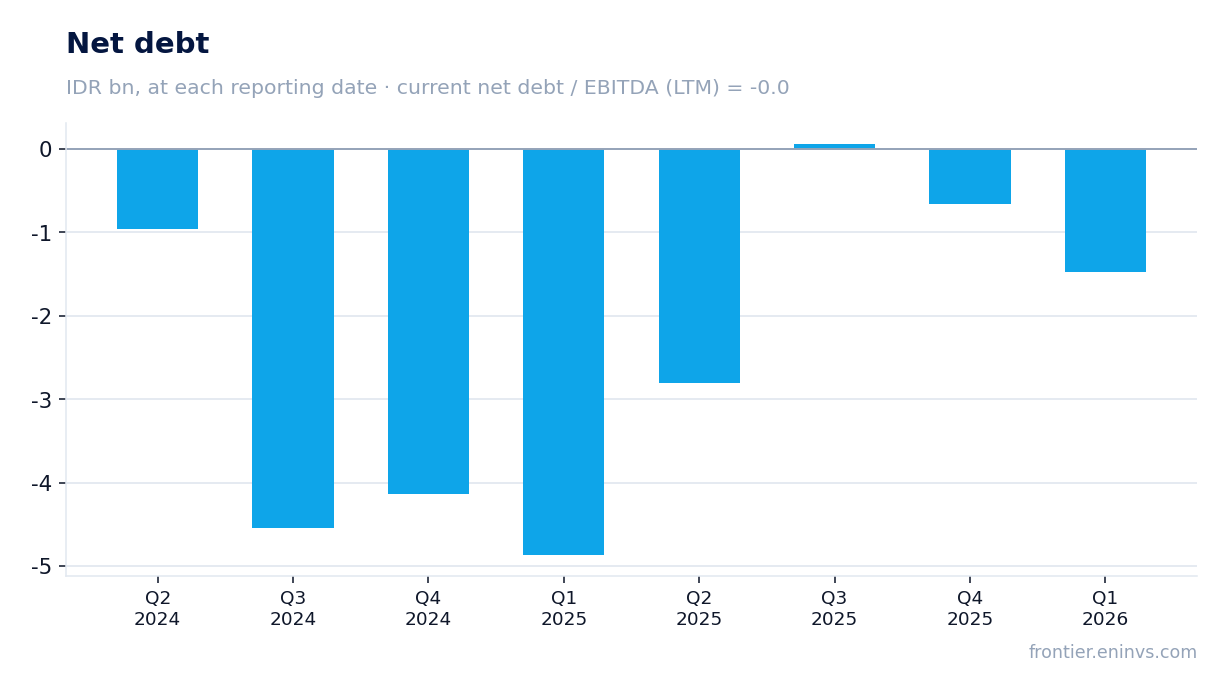
As of end-June 2026, the company's net debt was negative – IDR -665.0 billion, meaning cash exceeds debt. The ratio of net debt to EBITDA for the trailing twelve months is -0.0, indicating minimal debt burden.
However, over the last twelve months, net debt increased by IDR 4,032.4 billion (in rouble equivalent), reflecting active borrowing: during the half, the company received IDR 1,083.2 billion in long-term and IDR 1,055.5 billion in short-term loans. This may be related to financing the investment programme.
Capital expenditure almost doubled, but operating cash flow covers it with a cushion
Capital expenditure for the first half of 2026 was IDR 1,147.0 billion versus IDR 1,530.6 billion a year earlier – a 25% decline, contrasting with growth in previous quarters. Operating cash flow for the half rose to IDR 4,625.7 billion from IDR 2,223.9 billion a year earlier.
Thus, operating cash flow covers capital expenditure with a cushion: free cash flow (OCF minus capex) was approximately IDR 3,478.7 billion. This provides resources for dividend payments and further development.
Dividend yield of 3.8% is below the market average, but payments are backed by cash flow
The trailing dividend yield is 3.8% – below the average market yield, but payments are backed by strong cash flow. During the first half, the company declared dividends of IDR 1,318.5 billion, corresponding to about 50% of net profit.
Given negative net debt and positive free cash flow, the dividend policy looks sustainable. However, investors should note that part of the profit was one-off, and future payments may be lower.
Portal model valuation implies 28% upside potential
According to the portal model, which re-prices EBITDA at current commodity prices at the target EV/EBITDA multiple, the share's upside potential is +28% to the current market price. This is higher than most peers in the sector.
The current EV/EBITDA multiple for the trailing twelve months is 4.9x, below the three-year average, and P/E is 7.3x. Given negative net debt and high profitability, the valuation looks attractive if one-off effects do not recur.
Valuation on the latest reported figures
| Metric | Value |
|---|---|
| Market cap | 34 658 bn IDR |
| P/E (LTM) | 7.3 |
| EV/EBITDA (LTM) | 4.9 |
| P/B | 1.54 |
| Net debt / EBITDA (LTM) | -0.00 |
| Operating cash flow (LTM) | 6.30 bn |
| ROE | 21.6% |
| Dividend yield (12m) | 3.8% |
Bottom line
Bottom line: PT Bukit Asam showed impressive profit growth in the first half of 2026, but it is largely due to one-off factors. Operational efficiency did improve – EBITDA margin rose to 16.9%, and net debt remains negative. However, the 99.9% revenue decline and rising debt warrant caution. At the current valuation (EV/EBITDA 4.9x, P/E 7.3x) and with +28% upside on the portal model, the shares look rather attractive, but investors should wait for confirmation of sustainable results without one-off effects.
Open the company's financial profile PTBA →
See also: market overview · valuation map · stock screeners