Aurobindo Pharma: revenue accelerated to +16.9%, but EBITDA margin compressed to 20.7%
25 августа Aurobindo Pharma раскрыла результаты за первый квартал 2026 финансового года. Выручка выросла на 16,9% год к году, до 91 058,2 млн INR, чистая прибыль – на 25,2%, до 10 325,6 млн INR. EBITDA-маржа снизилась с 21,9% до 20,7%, что отражает давление на операционную эффективность. При текущей цене акция выглядит скорее привлекательно: мультипликатор EV/EBITDA 13,6 выше собственного трёхлетнего среднего 11,4, но модель портала даёт потенциал роста +15%.
Key takeaways
— Revenue accelerated to +16.9% on strong generic demand
— EBITDA margin fell to 20.7% due to higher costs
— Net profit rose 25.2%, outpacing revenue
— Leverage remains low: net debt/EBITDA LTM at 0.07
— Free cash flow positive, but capex not disclosed
— Valuation above its own history, but portal model implies +15% upside
Attractiveness
Key figures, INR bn
| Metric | Q1 2025 | Q1 2026 | Change |
|---|---|---|---|
| Revenue | 77.9 | 91.1 | +16.9% |
| EBITDA | 17.1 | 18.8 | +10.0% |
| Operating profit | 12.0 | 13.9 | +16.4% |
| Net profit | 8.25 | 10.3 | +25.2% |
| EBITDA margin | 21.9% | 20.7% | -1.2 pp |
| Net margin | 10.6% | 11.3% | +0.7 pp |
Revenue accelerated to +16.9% on strong generic demand
In the first quarter of fiscal 2026, Aurobindo Pharma's revenue reached 91,058.2 million INR, up 16.9% year-over-year. This marks a notable acceleration from the 4.4% growth in the previous quarter and 3.0% in the same quarter last year. The company continues to expand sales, supported by sustained demand for generics in key markets.
Sequential dynamics are also positive: revenue rose from 87,515.0 million INR in Q4 2026 to 91,058.2 million INR in Q1 2026. This is the fourth consecutive quarter of growth, indicating a sustained upward trend.
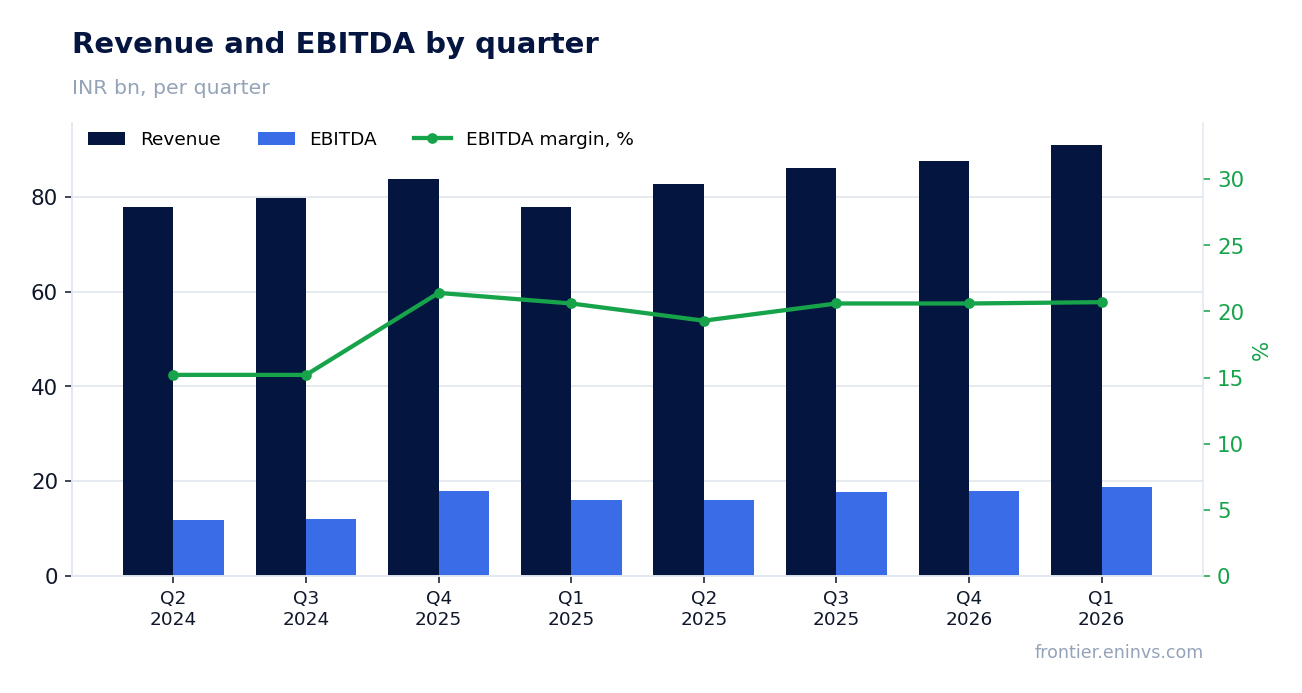
EBITDA margin fell to 20.7% due to higher costs
EBITDA in the reported quarter rose 10.0% year-over-year to 18,810.6 million INR, but the margin contracted from 21.9% to 20.7%. This indicates that operating expenses grew faster than revenue, typical for pharmaceutical companies facing pricing pressure and rising raw material costs.
The margin decline signals that the company is not fully offsetting cost increases with price hikes. However, absolute EBITDA continues to grow, supporting cash flow.
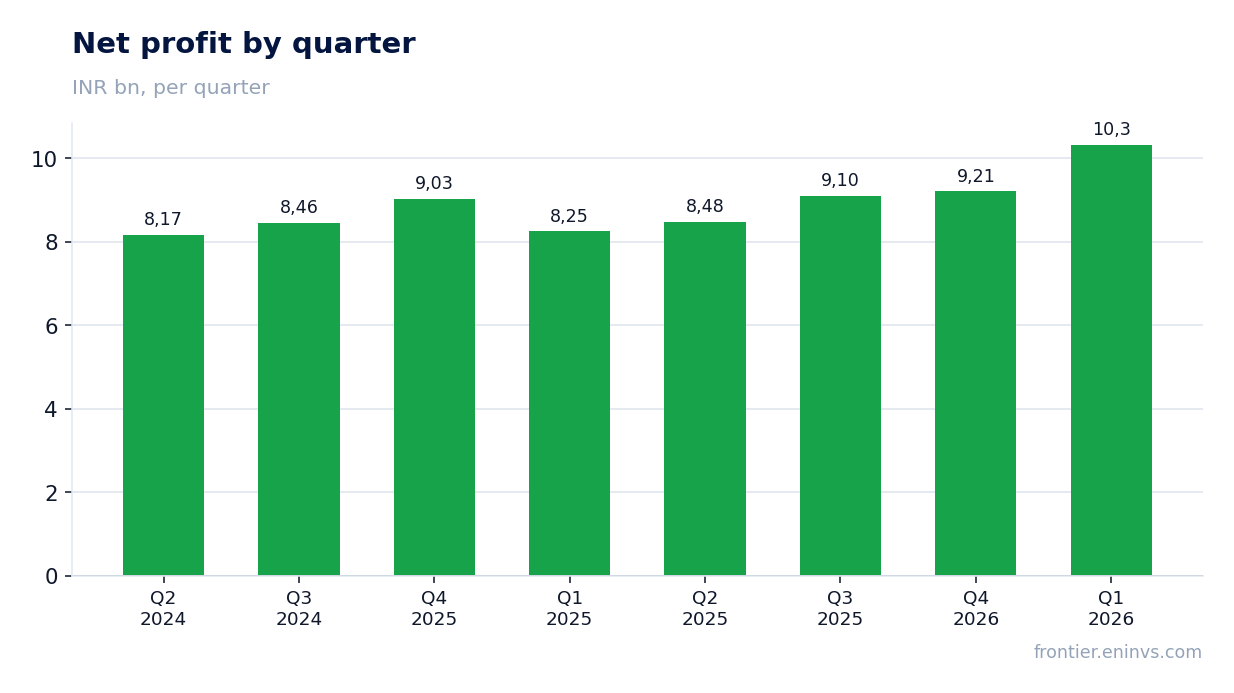
Net profit rose 25.2%, outpacing revenue
Net profit for Q1 2026 reached 10,325.6 million INR, up 25.2% year-over-year. Profit growth outpaced revenue due to operating leverage and possibly one-off factors such as taxes or other income.
Net margin improved from 10.6% to 11.3%, indicating better cost control and tax efficiency. However, part of the increase may be non-operational.
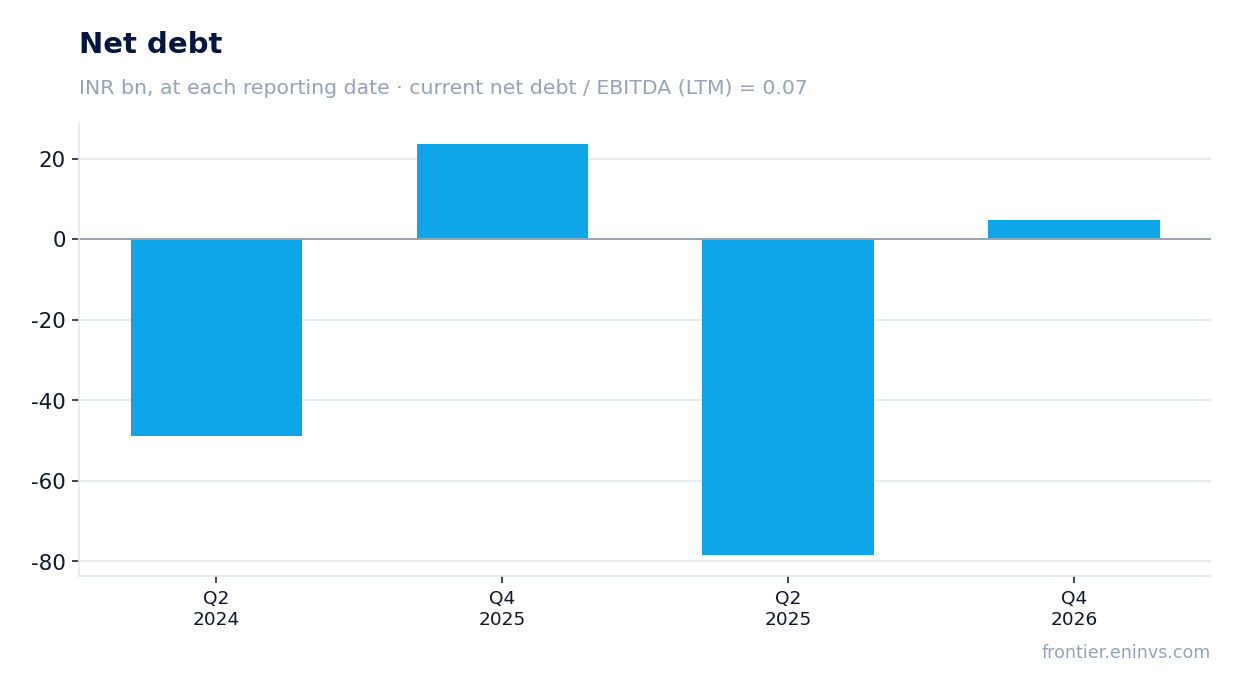
Leverage remains low: net debt/EBITDA LTM at 0.07
As of the latest balance sheet date, net debt stood at 4,848.0 million INR, and with LTM EBITDA of 72,311.6 million INR, the net debt/EBITDA ratio is 0.07. This is a very low leverage, leaving ample room to finance growth or pay dividends.
Net debt increased by 83.4 billion RUB over the quarter (in ruble terms), but decreased by 18.9 billion RUB over 12 months. This reflects seasonal working capital fluctuations rather than a deterioration in financial stability.
Free cash flow positive, but capex not disclosed
Operating cash flow for the trailing twelve months reached 55,300.0 million INR, significantly exceeding net profit for the same period (37,125.6 million INR). This indicates high earnings quality and efficient working capital management.
Capex data is not disclosed in the report, so exact free cash flow cannot be estimated. Nevertheless, positive operating cash flow and low debt create prerequisites for stable dividends.
Valuation above its own history, but portal model implies +15% upside
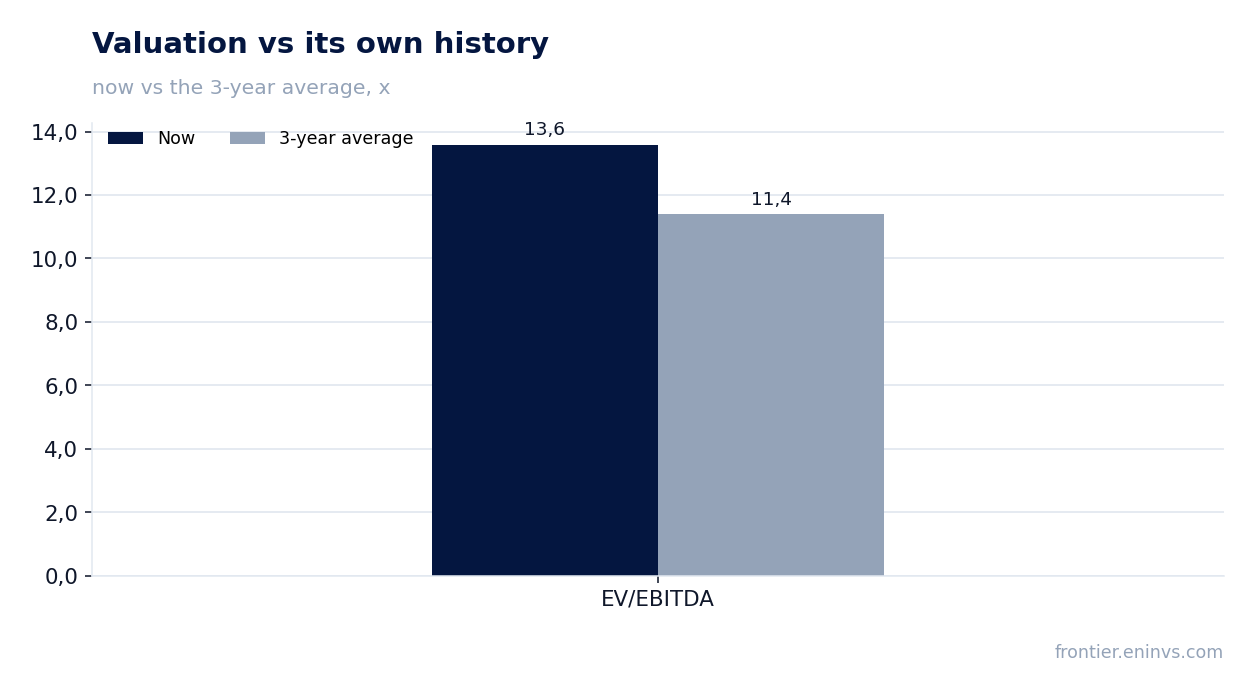
The current EV/EBITDA multiple is 13.6, above the three-year average of 11.4. P/E LTM is 26.3, also implying a premium to historical levels. This reflects market expectations for further growth but leaves little room for disappointment.
According to the portal's model, based on EBITDA growth and target multiple, the stock's upside potential is +15% from the current price. This is a moderately positive signal supporting a 'rather attractive' verdict.
Valuation on the latest reported figures
| Metric | Value |
|---|---|
| Market cap | 978 bn INR |
| P/E (LTM) | 26.3 |
| EV/EBITDA (LTM) | 13.6 |
| P/B | 2.58 |
| Net debt / EBITDA (LTM) | 0.07 |
| Operating cash flow (LTM) | 55.3 bn |
| ROE | 10.9% |
| EV/EBITDA, 3-year average | 11.4 |
Bottom line
Aurobindo Pharma delivered a strong quarter: revenue accelerated to +16.9%, net profit rose 25.2%, and leverage remains minimal. However, the EBITDA margin decline to 20.7% points to operational pressure that could limit profit growth going forward. Valuation is above its own history, but the portal model implies +15% upside, making the stock rather attractive. To confirm the trend, watch margin dynamics and the company's ability to sustain revenue growth.
Open the company's financial profile AUROPHARMA →
See also: market overview · valuation map · stock screeners