Bajaj Auto: revenue up 65%, yet 12-month cash flow is only INR 26 bn against net profit of INR 117.6 bn
25 августа Bajaj Auto раскрыла результаты за первый квартал 2026 финансового года. Выручка выросла на 65,0% год к году, до 208 702,3 млн INR, EBITDA — на 62,2%, до 45 311,5 млн INR, чистая прибыль — на 45,9%, до 32 256,3 млн INR. Акции торгуются по мультипликатору EV/EBITDA 22,5 против собственного трёхлетнего среднего 24,0, и по модели портала потенциал роста составляет +26%, что делает бумагу привлекательной при текущей цене.
Key takeaways
— Quarterly revenue jumped 65% to INR 208.7 bn — the best result in the last four quarters
— EBITDA margin slipped from 22.1% to 21.7% — rising costs weighed on profitability
— Net profit grew 45.9%, but 12-month cash flow was only INR 26 bn — less than a quarter of net profit
— Debt burden: net debt of INR 189.9 bn, or 1.25 times trailing-twelve-month EBITDA
— Trailing dividend yield of 1.27% is below the key rate, limiting appeal for income investors
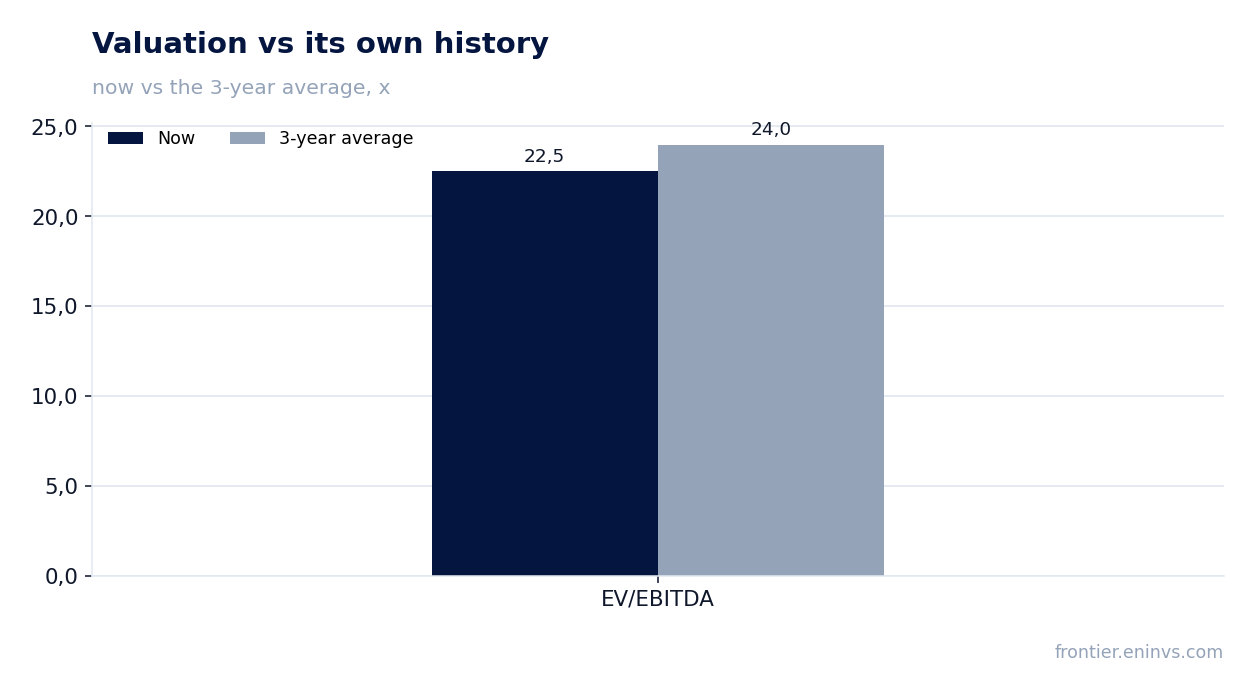
— Shares trade at a discount to their own three-year history: EV/EBITDA of 22.5 versus the 24.0 average
— The portal's model sees 26% upside to fair value
Attractiveness
Key figures, INR bn
| Metric | Q1 2025 | Q1 2026 | Change |
|---|---|---|---|
| Revenue | 126 | 209 | +65.0% |
| EBITDA | 27.9 | 45.3 | +62.2% |
| Operating profit | 26.8 | 41.3 | +54.2% |
| Net profit | 22.1 | 32.3 | +45.9% |
| EBITDA margin | 22.1% | 21.7% | -0.4 pp |
| Net margin | 17.5% | 15.5% | -2.0 pp |
Quarterly revenue jumped 65% to INR 208.7 bn — the best result in the last four quarters
In the first quarter of fiscal 2026, revenue reached INR 208,702.3 million, up 65.0% from the same quarter a year earlier. This is the highest quarterly figure in the last four quarters; the previous peak was INR 171,079.6 million in Q4 fiscal 2026.
Growth accelerated versus earlier quarters: Q2 fiscal 2025 revenue was INR 152,536.4 million and Q3 fiscal 2025 was INR 153,782.4 million. The company is expanding sales, and this shows across all reporting lines.
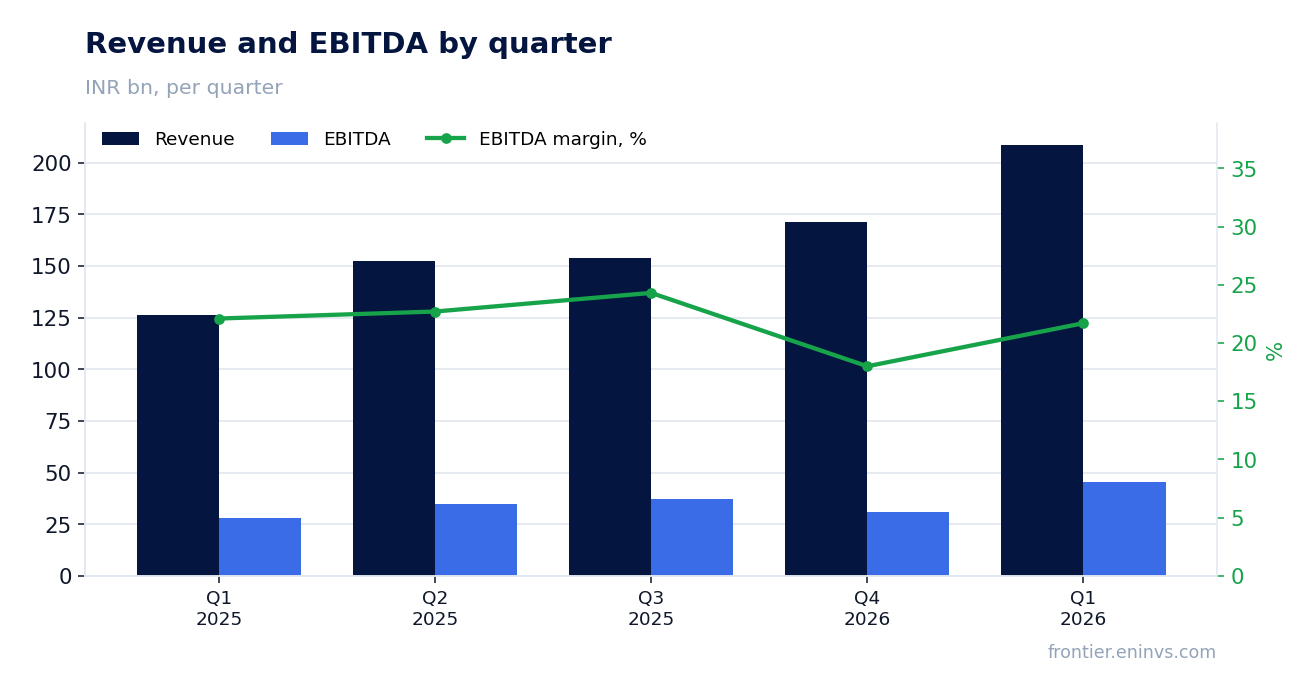
EBITDA margin slipped from 22.1% to 21.7% — rising costs weighed on profitability
Quarterly EBITDA rose 62.2% year on year to INR 45,311.5 million, but the margin slipped slightly to 21.7% from 22.1% in the year-ago quarter. The reason is that costs grew faster than revenue, although the exact cost structure is not disclosed.
The 0.4 percentage point margin decline is not critical, but it suggests the company is not fully offsetting cost inflation with price increases. In a high-inflation environment, this could continue to pressure profitability in coming quarters.
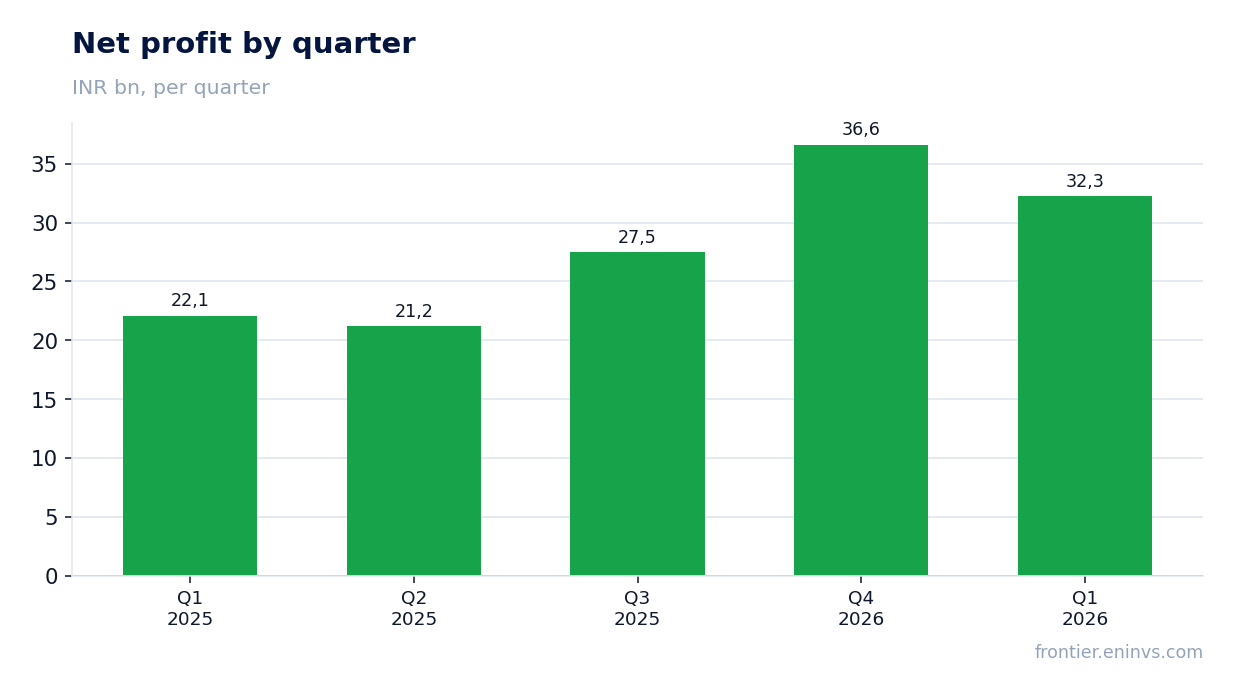
Net profit grew 45.9%, but 12-month cash flow was only INR 26 bn — less than a quarter of net profit
Quarterly net profit was INR 32,256.3 million, up 45.9% year on year. However, trailing twelve-month operating cash flow was only INR 26,000.0 million — roughly 22% of net profit over the same period (INR 117,594.0 million).
The gap between profit and cash flow signals that a large portion of earnings is not converting into cash. This could be due to working-capital build-up or other non-cash items, but in any case it limits the company's ability to fund investments and dividends from operations.
Debt burden: net debt of INR 189.9 bn, or 1.25 times trailing-twelve-month EBITDA
As of the latest balance sheet date, net debt stood at INR 189,906.2 million. The ratio of net debt to trailing-twelve-month EBITDA is 1.25 — a moderate level that does not threaten financial stability.
Over the past twelve months, net debt increased by INR 120.9 billion, possibly to fund capital expenditure or dividends. However, without the earlier ratio value, we cannot say whether leverage has improved or deteriorated.
Trailing dividend yield of 1.27% is below the key rate, limiting appeal for income investors
Over the last twelve months, the company paid dividends yielding 1.27% at the current price. This is well below the key rate, making the stock unattractive for income-focused investors.
At this yield, dividends are unlikely to drive the share price. The main value lies in business growth potential, not in payouts.
Shares trade at a discount to their own three-year history: EV/EBITDA of 22.5 versus the 24.0 average
The current EV/EBITDA multiple is 22.5, below the three-year average of 24.0. This means the market values the company somewhat cheaper than its own three-year average, despite strong revenue and profit growth.
The discount to its own history may be justified by concerns over cash flow or margins, but it also creates room for re-rating if the company keeps delivering high growth.
The portal's model sees 26% upside to fair value
Our value-creation model, based on EBITDA growth and a target multiple, suggests the shares have 26% upside to fair value. This is the portal's calculation, not a market consensus or target price.
Such potential makes the stock attractive for long-term growth investors, especially given the current discount to its own history.
Valuation on the latest reported figures
| Metric | Value |
|---|---|
| Market cap | 3 240 bn INR |
| P/E (LTM) | 27.6 |
| EV/EBITDA (LTM) | 22.5 |
| P/B | 8.34 |
| Net debt / EBITDA (LTM) | 1.25 |
| Operating cash flow (LTM) | 26.0 bn |
| ROE | 37.7% |
| Dividend yield (12m) | 1.3% |
| EV/EBITDA, 3-year average | 24.0 |
Bottom line
Bajaj Auto delivered a strong quarter: revenue up 65%, EBITDA up 62%, net profit up 46%. Yet behind these figures lies a worrying signal: trailing twelve-month operating cash flow was only INR 26 billion — less than a quarter of net profit. This raises questions about earnings quality and whether the company can sustain high growth without increasing debt. At the current valuation (EV/EBITDA of 22.5 versus the 24.0 average) and with 26% upside on the portal's model, the shares look attractive, but investors should watch cash-flow dynamics and margins.
Open the company's financial profile BAJAJAUTO →
See also: market overview · valuation map · stock screeners