Cipla: revenue grows, profit falls — margin compresses to 16.8%
On August 25, Cipla reported results for the first quarter of fiscal 2026. Revenue grew 3.5% year on year to 70,770.2 million INR, but EBITDA fell 32.9% and net profit dropped 39.2% to 7,890.5 million INR. EBITDA margin narrowed from 26.0% to 16.8%, making the shares rather unattractive at the current price.
Key takeaways
— Revenue grew 3.5% year on year, but this is a slowdown after 7.0% growth in the previous quarter
— EBITDA fell 32.9% due to margin compression to 16.8% from 26.0%
— Net profit declined 39.2% to 7,890.5 million INR amid rising costs
— The company maintains a net cash position: net debt is negative at -7,602.5 million INR
— Trailing twelve-month dividend yield is 0.95%, below historical levels
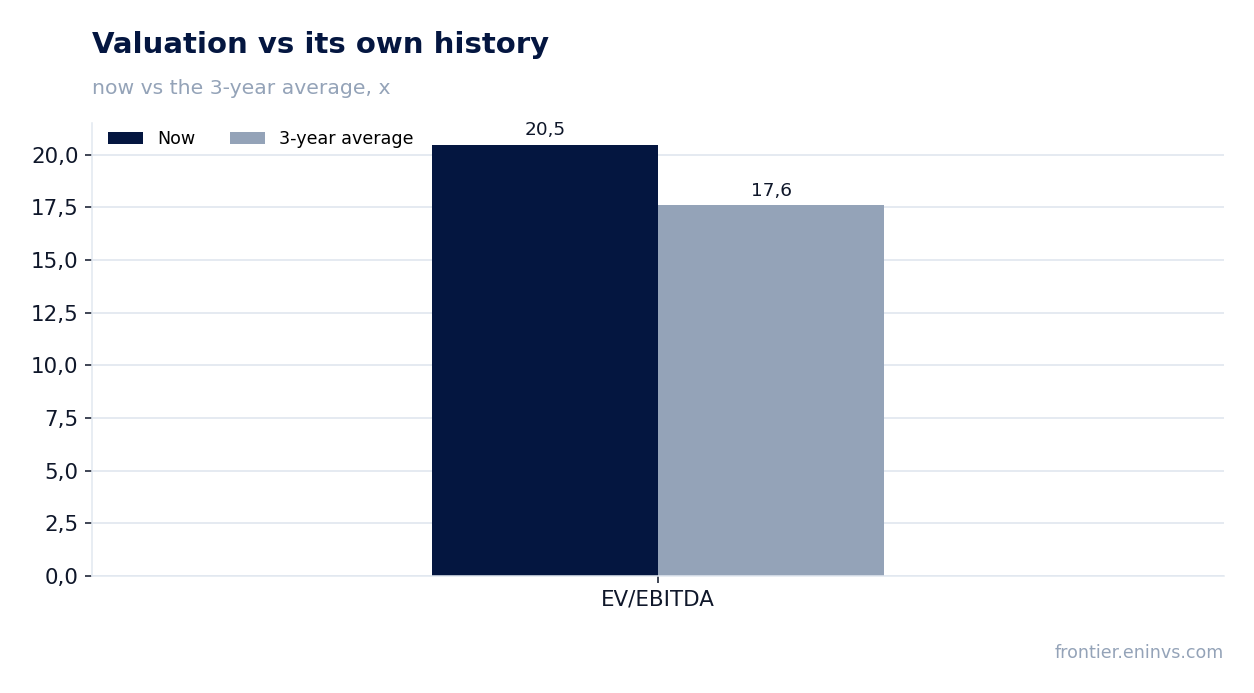
— EV/EBITDA multiple (20.5x) is above its own three-year average (17.6x)
— On the portal's model, the share's upside potential is -40%
Attractiveness
Key figures, INR bn
| Metric | Q1 2025 | Q1 2026 | Change |
|---|---|---|---|
| Revenue | 68.4 | 70.8 | +3.5% |
| EBITDA | 17.8 | 11.9 | -32.9% |
| Operating profit | 15.3 | 8.88 | -41.8% |
| Net profit | 13.0 | 7.89 | -39.2% |
| EBITDA margin | 26.0% | 16.8% | -9.2 pp |
| Net margin | 19.0% | 11.1% | -7.9 pp |
Revenue grew 3.5% year on year, but this is a slowdown after 7.0% growth in the previous quarter
In the first quarter of fiscal 2026, Cipla's revenue reached 70,770.2 million INR, up 3.5% year on year. However, in the previous quarter (Q4 FY2025) growth was 7.0%, and earlier it was 6.9% and 3.2% in Q3 and Q2 respectively. Thus, growth has slowed.
Over the trailing twelve months, revenue reached 279,500.0 million INR. This level reflects the sum of four quarters ending June 30, 2026, and should not be interpreted as a quarterly figure.
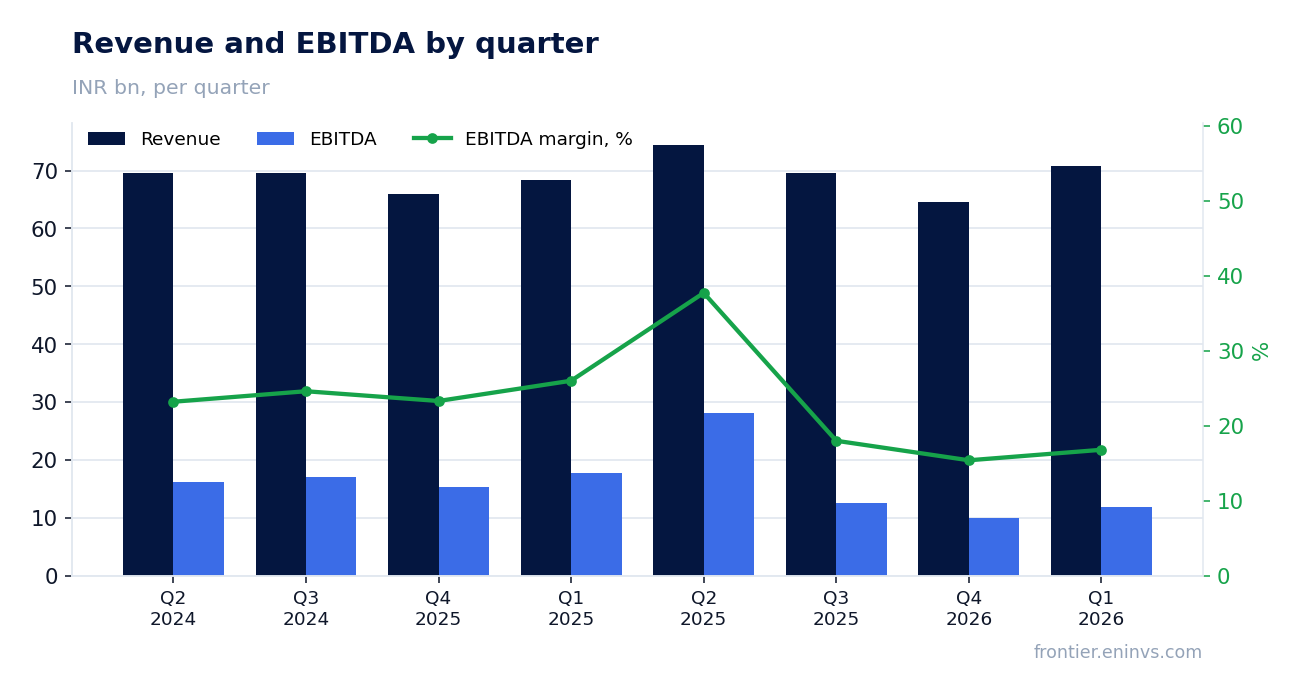
EBITDA fell 32.9% due to margin compression to 16.8% from 26.0%
EBITDA for Q1 FY2026 was 11,923.0 million INR, down 32.9% year on year. EBITDA margin contracted from 26.0% to 16.8%. This sharp decline in profitability is the key negative factor in the report.
Over the trailing twelve months, EBITDA reached 53,433.0 million INR. This includes both strong quarters (e.g., Q2 FY2025 with EBITDA of 28,110.4 million INR) and weak ones (Q4 FY2026 with 9,969.7 million INR).
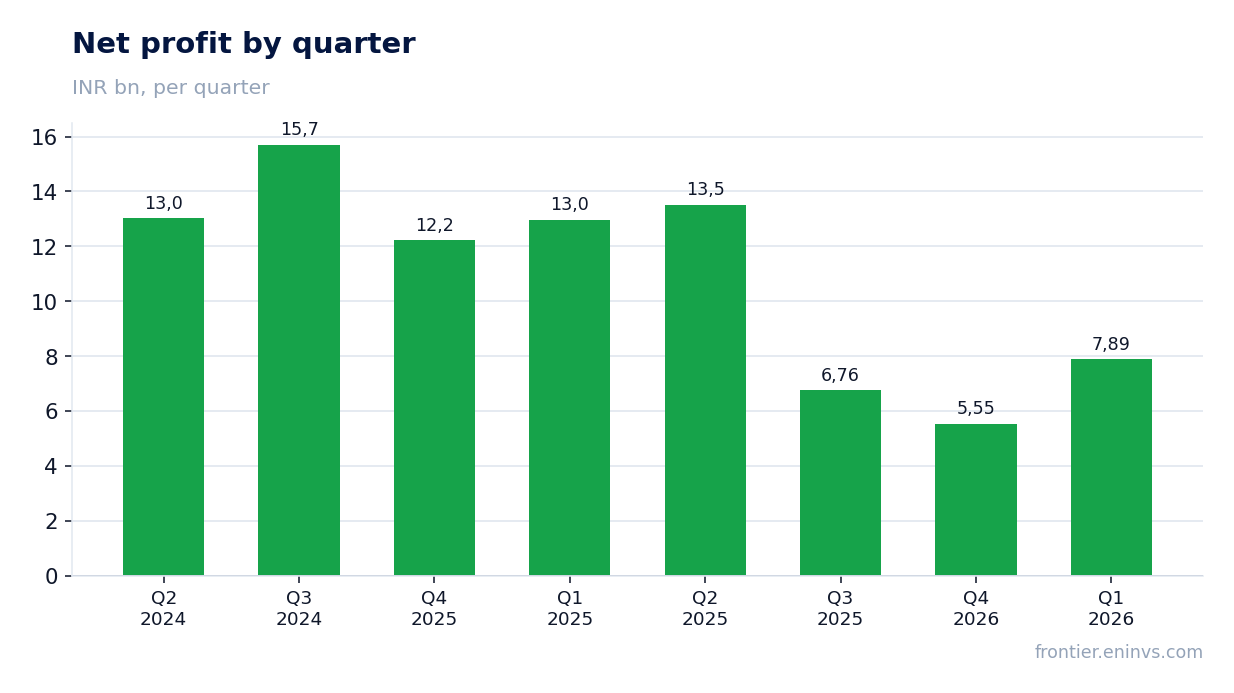
Net profit declined 39.2% to 7,890.5 million INR amid rising costs
Net profit for Q1 FY2026 was 7,890.5 million INR, down 39.2% year on year. Net margin narrowed from 19.0% to 11.1%. The decline in profit was deeper than the EBITDA drop, indicating additional pressure on the bottom line.
Over the trailing twelve months, net profit reached 33,706.6 million INR. This period includes quarters with profit above 13,000 million INR (e.g., Q2 FY2025 — 13,511.7 million INR) and quarters with profit below 6,000 million INR (Q4 FY2026 — 5,546.4 million INR).
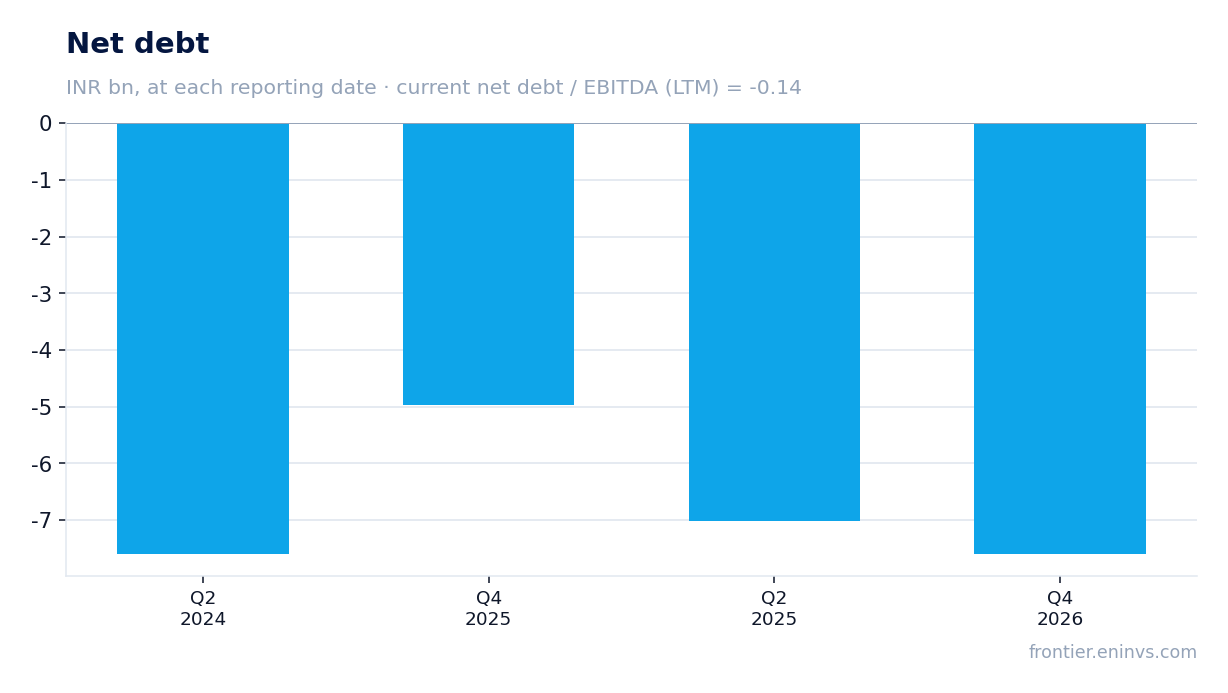
The company maintains a net cash position: net debt is negative at -7,602.5 million INR
As of the latest balance sheet date, Cipla's net debt was -7,602.5 million INR, meaning the company has more cash than debt. The net debt to EBITDA ratio for the trailing twelve months is -0.14, indicating a solid financial position.
Over the trailing twelve months, operating cash flow reached 39,400.0 million INR. These funds cover capital expenditures and dividends without additional borrowing.
Trailing twelve-month dividend yield is 0.95%, below historical levels
Over the trailing twelve months, Cipla paid dividends providing a yield of 0.95% at the current price. This is a modest level, especially for income-oriented investors.
At such a yield, dividends are unlikely to be a key reason to buy the shares. More important is the company's ability to restore margins and generate profit.
EV/EBITDA multiple (20.5x) is above its own three-year average (17.6x)
The current EV/EBITDA multiple is 20.5x, above its own three-year average of 17.6x. This means the market values the company more expensively than the average over the past three years, despite falling profitability.
The trailing twelve-month P/E is 32.7x, also indicating a premium valuation. With declining margins, such a valuation looks vulnerable.
On the portal's model, the share's upside potential is -40%
According to our value-creation model, which multiplies EBITDA growth by a target multiple and compares it with market capitalization, the share's upside potential is -40%. This means the current price is significantly above the fair value according to our model.
The portal's model considers not only current financials but also expected EBITDA growth. With such a significant negative potential, the shares look overvalued.
Valuation on the latest reported figures
| Metric | Value |
|---|---|
| Market cap | 1 101 bn INR |
| P/E (LTM) | 32.7 |
| EV/EBITDA (LTM) | 20.5 |
| P/B | 3.20 |
| Net debt / EBITDA (LTM) | -0.14 |
| Operating cash flow (LTM) | 39.4 bn |
| ROE | 9.2% |
| Dividend yield (12m) | 1.0% |
| EV/EBITDA, 3-year average | 17.6 |
Bottom line
In Q1 FY2026, Cipla showed moderate revenue growth but a sharp decline in profitability: EBITDA margin contracted to 16.8%, and net profit fell 39.2%. The company maintains a net cash position, providing a safety cushion, but the valuation remains high: EV/EBITDA of 20.5x versus its own average of 17.6x, and the portal's model indicates a downside potential of -40%. Given this combination, the shares look rather unattractive. A change in the verdict would require margin recovery and a slowdown in profit decline.
Open the company's financial profile CIPLA →
See also: market overview · valuation map · stock screeners