Mphasis: revenue accelerates to +17.5%, but net profit grows half as fast
On July 22, 2026, Mphasis reported results for the first quarter of fiscal 2026. Revenue grew 17.5% year on year, EBITDA 25.0%, but net profit rose only 10.8%. At the current price, the share looks rather attractive: growth is accelerating, margins are expanding, and the EV/EBITDA multiple of 14.5 is below its own three-year average of 17.5.
Key takeaways
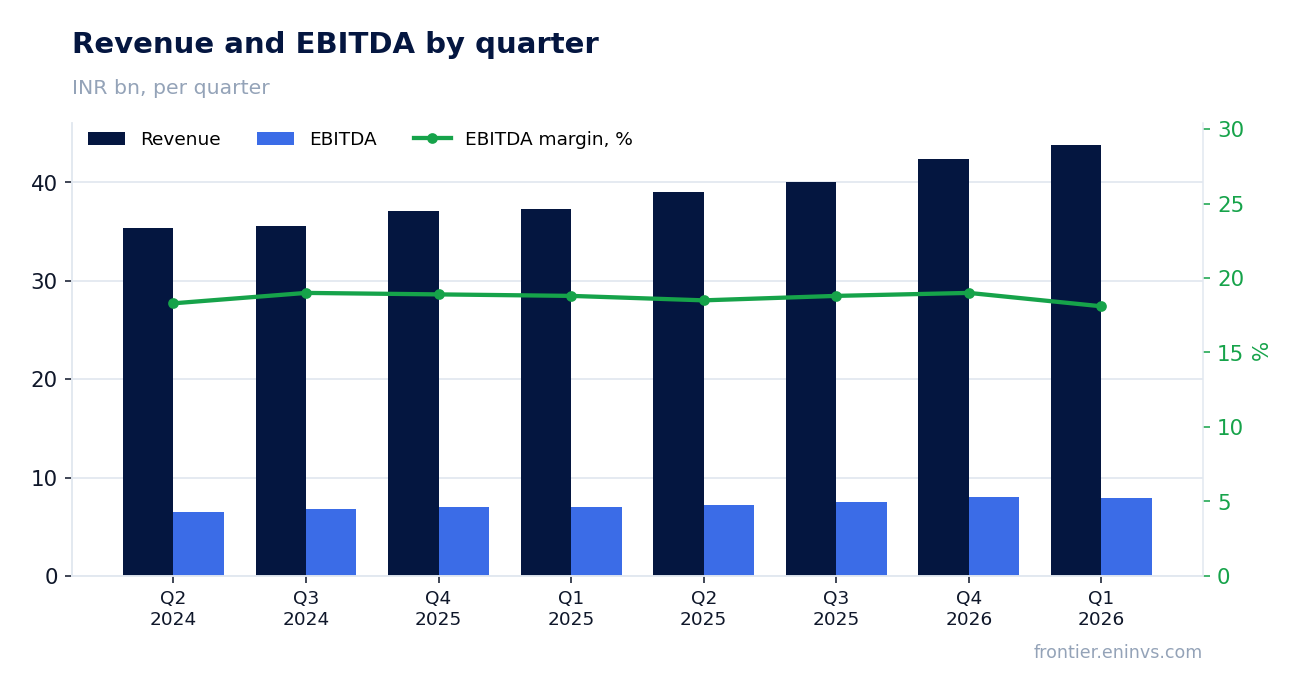
— Revenue accelerated to +17.5% – the best pace in five quarters
— EBITDA margin expanded to 20.0% from 18.8% a year ago
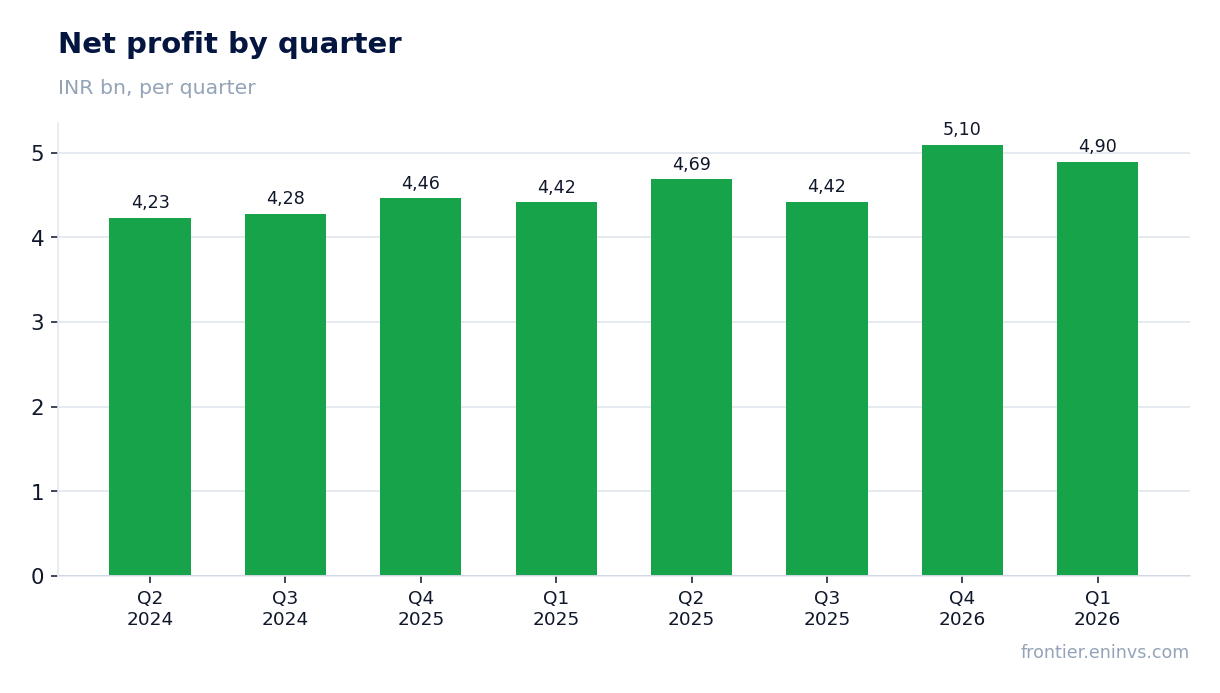
— Net profit grows slower than revenue due to higher depreciation and financial items
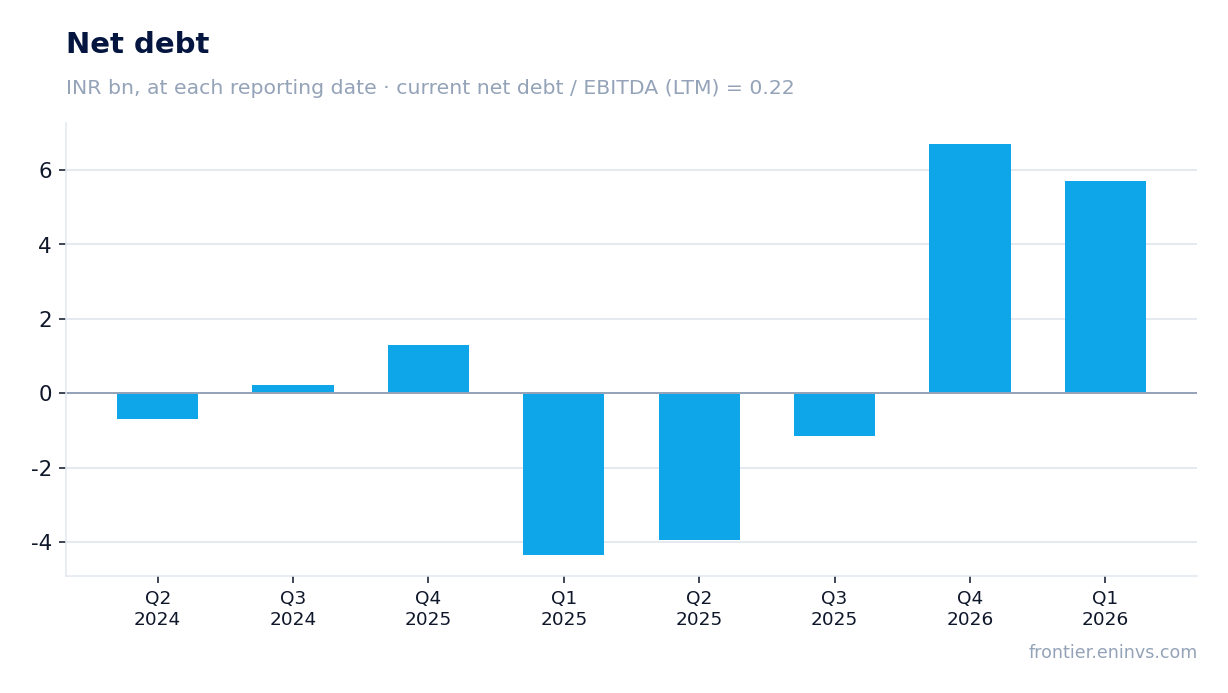
— Debt rose by INR 10 bn over the year, but net debt/EBITDA remains low at 0.22
— Operating cash flow for the quarter was INR 3.7 bn, capex only INR 0.1 bn
— Dividend yield of 2.7% is below historical levels, but the payout is covered by cash flow
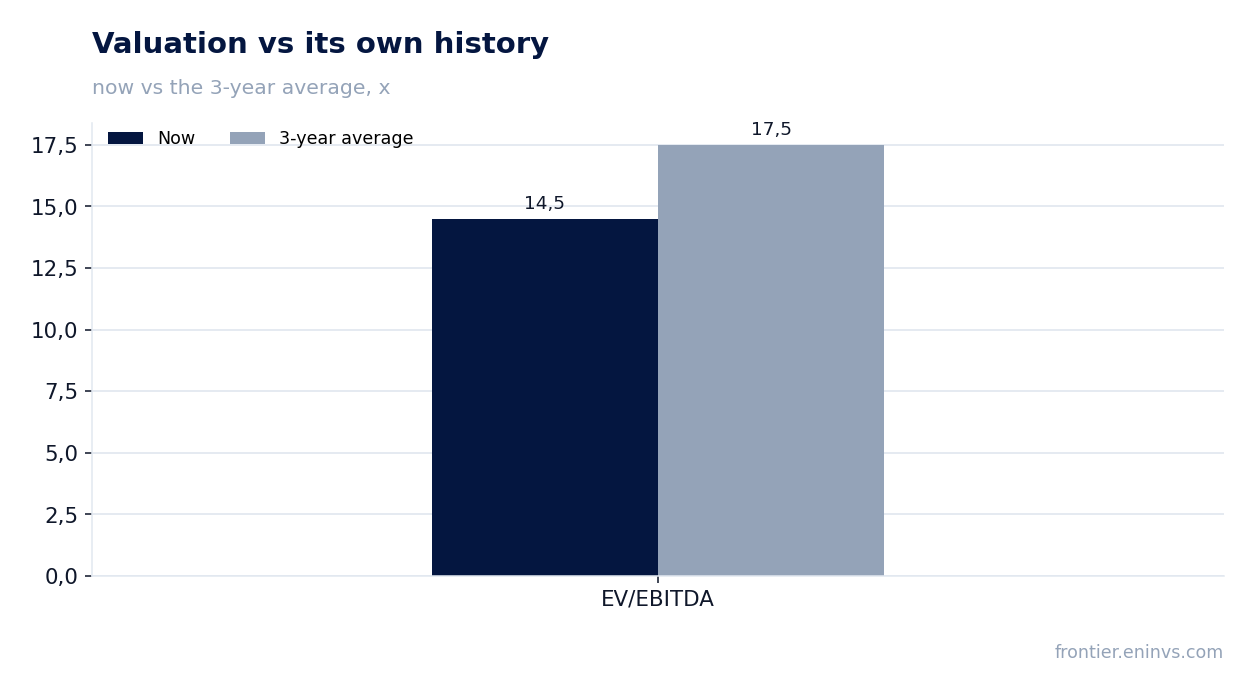
— Valuation below its own history: EV/EBITDA 14.5 vs 17.5 three-year average
Attractiveness
Key figures, INR bn
| Metric | Q1 2025 | Q1 2026 | Change |
|---|---|---|---|
| Revenue | 37.3 | 43.8 | +17.5% |
| EBITDA | 7.03 | 8.78 | +25.0% |
| Operating profit | 5.71 | 6.48 | +13.5% |
| Net profit | 4.42 | 4.90 | +10.8% |
| Operating cash flow | 1.93 | 3.66 | +89.6% |
| Capex | 0.08 | 0.12 | +49.7% |
| EBITDA margin | 18.8% | 20.0% | +1.2 pp |
| Net margin | 11.8% | 11.2% | -0.6 pp |
Revenue accelerated to +17.5% – the best pace in five quarters
In the first quarter of fiscal 2026, Mphasis revenue reached INR 43,840.54 million, up 17.5% year on year. This is an acceleration from previous quarters: Q2 2025 grew +10.3%, Q3 2025 +12.4%, Q4 2025 +14.4%. The company has been gaining momentum for four consecutive quarters.
Sequential dynamics are also positive: revenue rose 3.3% from the previous quarter (from INR 42,426.68 million in Q4 2025). This confirms the trend is sustainable, not a one-off.
EBITDA margin expanded to 20.0% from 18.8% a year ago
EBITDA for the reported quarter grew 25.0% year on year to INR 7,951.69 million. EBITDA margin reached 20.0% versus 18.8% in the same quarter last year. The 1.2 percentage point margin expansion is the result of revenue growing faster than costs.
Sequential dynamics are slightly less rosy: EBITDA fell 1.3% from the previous quarter (from INR 8,052.58 million), reflecting some pressure on operating efficiency at the start of the year.
Net profit grows slower than revenue due to higher depreciation and financial items
Net profit for Q1 2026 rose 10.8% year on year to INR 4,895.06 million. This is noticeably slower than revenue (+17.5%) and EBITDA (+25.0%). The gap is explained by higher depreciation and, likely, financial expenses, which eat into operating profit.
Operating profit grew 13.5% (from INR 5,709.46 million to INR 6,481.14 million), but net margin fell to 11.2% from 11.8% a year ago. The company earns more but retains a smaller share of revenue on the bottom line.
Debt rose by INR 10 bn over the year, but net debt/EBITDA remains low at 0.22
Net debt at the end of Q1 2026 stood at INR 5,689.83 million. Over the year it rose by INR 10.0 billion (from a negative INR -4,353.67 million in Q1 2025). The company moved from a net cash position to moderate debt.
Nevertheless, net debt/EBITDA for the trailing twelve months is only 0.22 – a low level that poses no servicing problems. The debt burden remains comfortable despite the rise in absolute debt.
Operating cash flow for the quarter was INR 3.7 bn, capex only INR 0.1 bn
Operating cash flow in Q1 2026 was INR 3,663.28 million, notably higher than in the previous quarter (INR 1,981.48 million). Capital expenditure was minimal – INR 121.29 million, resulting in strong free cash flow.
Over the trailing twelve months, operating cash flow was INR 12,500 million with capex significantly lower in aggregate over the four quarters. This means the company generates enough cash to fund growth and pay dividends.
Dividend yield of 2.7% is below historical levels, but the payout is covered by cash flow
Over the trailing twelve months, Mphasis paid dividends yielding 2.69% at the current price. This is lower than in previous years, when the company likely paid more generously. Nevertheless, the payout is fully covered by operating cash flow: over twelve months it was INR 12,500 million, many times the dividend payments.
We expect the company to maintain its dividend policy of distributing a significant portion of profit in the current year. However, the payout will depend on whether net profit growth continues and whether funds are needed to repay debt, which rose by INR 10 billion over the year.
Valuation below its own history: EV/EBITDA 14.5 vs 17.5 three-year average
The current EV/EBITDA multiple is 14.5 – notably below the three-year average of 17.5. The share trades at a discount to its own history despite accelerating revenue growth and margin expansion.
On the portal's model, the upside to fair value is +8%. This moderate potential, combined with a dividend yield of 2.7%, makes the share attractive. P/E for the trailing twelve months is 23.1, which does not look excessive for a company with such growth rates.
Valuation on the latest reported figures
| Metric | Value |
|---|---|
| Market cap | 440 bn INR |
| P/E (LTM) | 23.1 |
| EV/EBITDA (LTM) | 14.5 |
| P/B | 4.10 |
| Net debt / EBITDA (LTM) | 0.22 |
| Operating cash flow (LTM) | 12.5 bn |
| ROE | 17.7% |
| Dividend yield (12m) | 2.7% |
| EV/EBITDA, 3-year average | 17.5 |
Bottom line
Mphasis reported a strong quarter: revenue accelerated to +17.5%, EBITDA margin expanded to 20.0%, and leverage remains minimal (net debt/EBITDA 0.22). However, net profit is growing half as fast as revenue, and the dividend yield of 2.7% is modest. The share trades at a discount to its own history (EV/EBITDA 14.5 vs 17.5), supporting a 'rather attractive' verdict. The key question for holders is whether the company can sustain growth and convert it into net profit growth, not just revenue.
Open the company's financial profile MPHASIS →
See also: market overview · valuation map · stock screeners