Persistent Systems: 29.1% revenue growth fails to save margin — EBITDA margin drops to 17.8%
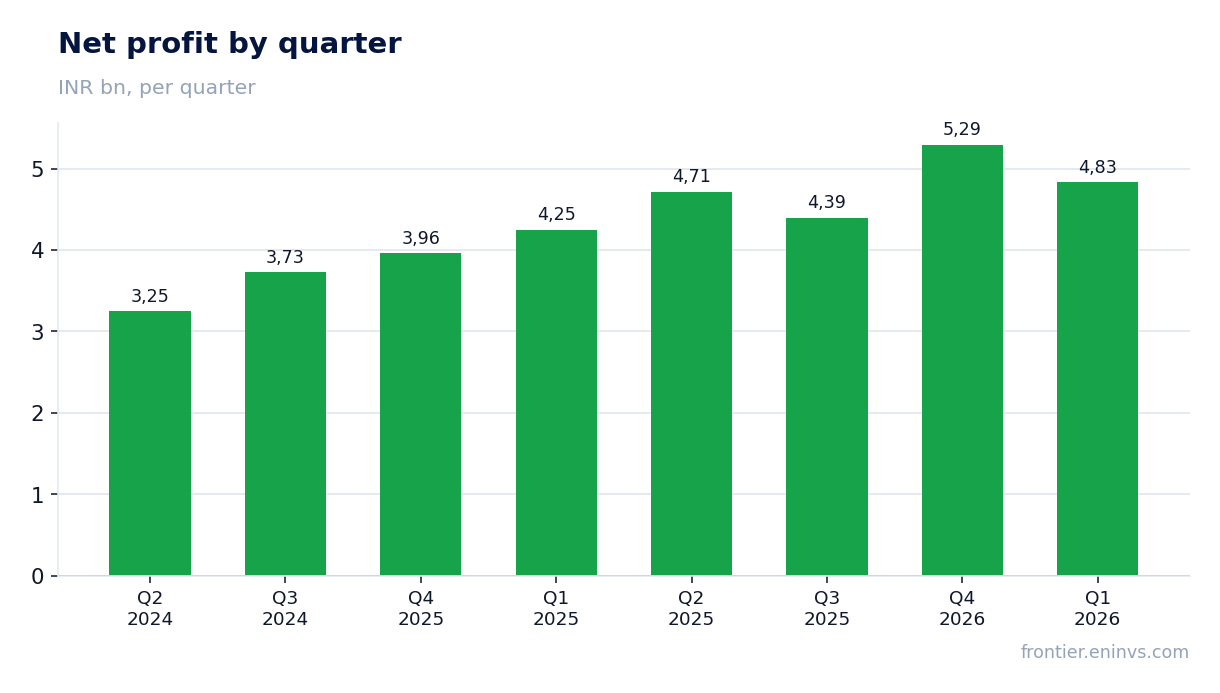
Persistent Systems раскрыла результаты за первый квартал 2026 года: выручка выросла на 29,1% год к году, до 43 032,27 млн INR, но EBITDA-маржа сократилась с 20,0% до 17,8%, а чистая прибыль прибавила лишь 13,7%. Акции торгуются с мультипликатором EV/EBITDA 29,2 против среднего за три года 38,1, что выглядит привлекательно, однако замедление роста прибыли и давление на рентабельность требуют осторожности.
Key takeaways
— Revenue accelerated to +29.1% YoY, but operating profit grew only 13.7% due to margin compression
— EBITDA margin fell 2.2 p.p. to 17.8% — costs are growing faster than revenue
— Operating cash flow in Q1 2026 was only 1,167.77 million INR — 3.6 times lower than the average of the previous four quarters
— Net debt decreased by 2.5 billion INR in the quarter — the company remains a net creditor
— Dividend yield over the last 12 months — 0.74% — is below the key rate, making the stock unattractive for income seekers
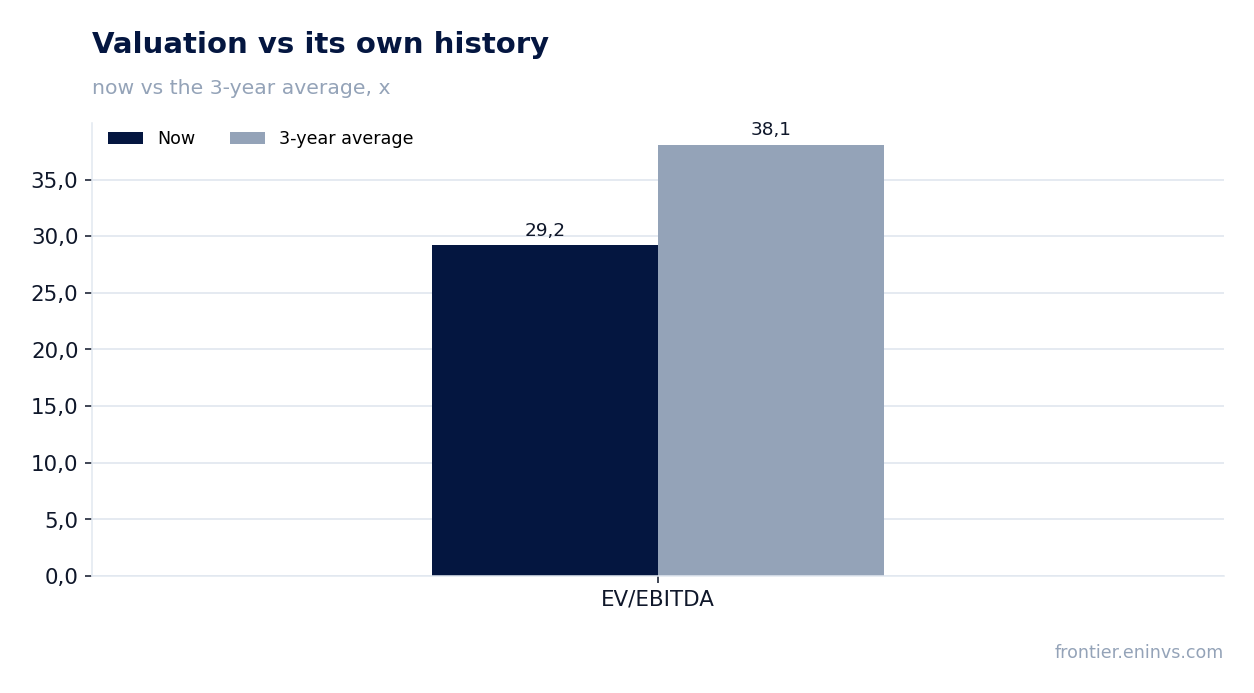
— EV/EBITDA multiple of 29.2 is below the three-year average of 38.1, implying 8% upside on the portal's model
Attractiveness
Key figures, INR bn
| Metric | Q1 2025 | Q1 2026 | Change |
|---|---|---|---|
| Revenue | 33.3 | 43.0 | +29.1% |
| EBITDA | 6.66 | 7.68 | +15.2% |
| Operating profit | 5.18 | 5.82 | +12.3% |
| Net profit | 4.25 | 4.83 | +13.7% |
| Operating cash flow | 4.19 | 1.17 | -72.1% |
| Capex | 0.42 | 0.99 | +133.2% |
| EBITDA margin | 20.0% | 17.8% | -2.2 pp |
| Net margin | 12.7% | 11.2% | -1.5 pp |
Revenue accelerated to +29.1% YoY, but operating profit grew only 13.7% due to margin compression
In Q1 2026, Persistent Systems' revenue reached 43,032.27 million INR, up 29.1% year-over-year. This is an acceleration compared to previous quarters: Q2 2025 grew 23.6%, Q3 2025 23.4%, and Q4 2025 25.1%.
However, operating profit rose only 13.7% to 4,830.43 million INR. The gap between revenue and profit growth is explained by declining profitability: operating margin fell from 12.7% to 11.2% year-over-year.
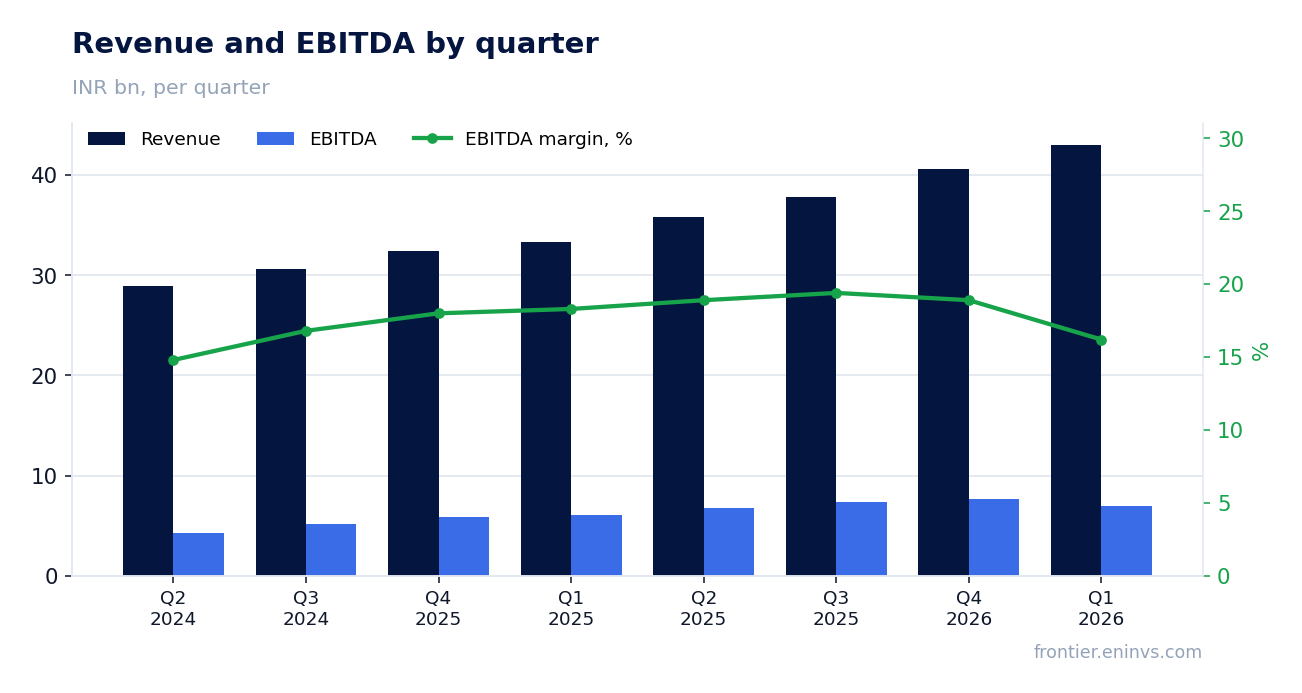
EBITDA margin fell 2.2 p.p. to 17.8% — costs are growing faster than revenue
EBITDA in the reported quarter was 6,968.95 million INR, up 15.2% year-over-year. But revenue grew 29.1%, so EBITDA margin declined from 20.0% to 17.8%.
The margin squeeze indicates that the company is increasing costs — likely on personnel and infrastructure — faster than it earns from new contracts. If the trend continues, profit growth will lag revenue in the coming quarters.
Operating cash flow in Q1 2026 was only 1,167.77 million INR — 3.6 times lower than the average of the previous four quarters
Operating cash flow for January–March 2026 was 1,167.77 million INR versus 4,191.88 million INR a year earlier. This is a sharp slowdown: the average over the previous four quarters was about 4,200 million INR.
At the same time, capital expenditures rose to 986.35 million INR from 422.93 million INR a year ago. Free cash flow thus fell to 181.42 million INR — the lowest level in the last five quarters. The company earns profit on paper, but this is not yet reflected in cash.
Net debt decreased by 2.5 billion INR in the quarter — the company remains a net creditor
At the end of Q1 2026, Persistent Systems' net debt was minus 6,744.04 million INR (at the end of Q4 2025 it was minus 4,323.89 million INR). Thus, the company reduced net debt by 2.5 billion INR in the quarter and remains a net creditor.
Over the last 12 months, net debt decreased by 2.2 billion INR. This means the company generates enough cash to finance growth and pay dividends, despite the weak operating flow in the reported quarter.
Dividend yield over the last 12 months — 0.74% — is below the key rate, making the stock unattractive for income seekers
Over the last 12 months, Persistent Systems paid dividends amounting to 0.74% of the current price. This is significantly below the key rate, making the stock unattractive for income-oriented investors.
The company maintains a net cash position, so theoretically it could increase payouts, but the current yield gives no reason for optimism. If the company does not raise dividends, the stock remains more of a growth story than a source of income.
EV/EBITDA multiple of 29.2 is below the three-year average of 38.1, implying 8% upside on the portal's model
The current EV/EBITDA multiple is 29.2, notably below the three-year average of 38.1. This indicates that the market values the company cheaper than the average over the past three years.
On the portal's model, based on EBITDA growth and target multiple, the upside potential is +8% from the current price. Meanwhile, P/E LTM is 44.4, reflecting high expectations for future earnings.
Valuation on the latest reported figures
| Metric | Value |
|---|---|
| Market cap | 855 bn INR |
| P/E (LTM) | 44.4 |
| EV/EBITDA (LTM) | 29.2 |
| P/B | 10.91 |
| Operating cash flow (LTM) | 17.7 bn |
| ROE | 23.8% |
| Dividend yield (12m) | 0.7% |
| EV/EBITDA, 3-year average | 38.1 |
Bottom line
Persistent Systems showed strong revenue growth of 29.1% YoY, but profit grew only 13.7%, and EBITDA margin fell to 17.8%. Operating cash flow in the reported quarter was the lowest in five quarters, raising questions about earnings quality. The company remains a net creditor, and the dividend yield is low. At the same time, the stock trades at a discount to its own three-year history on EV/EBITDA, offering moderate upside. Verdict — 'rather attractive': the stock is interesting for long-term investors but requires confirmation of margin stabilization and cash flow recovery.
Open the company's financial profile PERSISTENT →
See also: market overview · valuation map · stock screeners