Reliance Industries: выручка ускорилась до +27%, но EBITDA-маржа упала до 12,6%
25 августа Reliance Industries раскрыла результаты за первый квартал 2026 финансового года: выручка выросла на 27,0% год к году, до 3 094,7 млрд индийских рупий, однако EBITDA снизилась на 11,8%, а чистая прибыль – на 22,4%. На фоне падения маржинальности и скромной дивидендной доходности акции выглядят скорее непривлекательно: модель портала оценивает потенциал снижения в 14%.
Главные тезисы
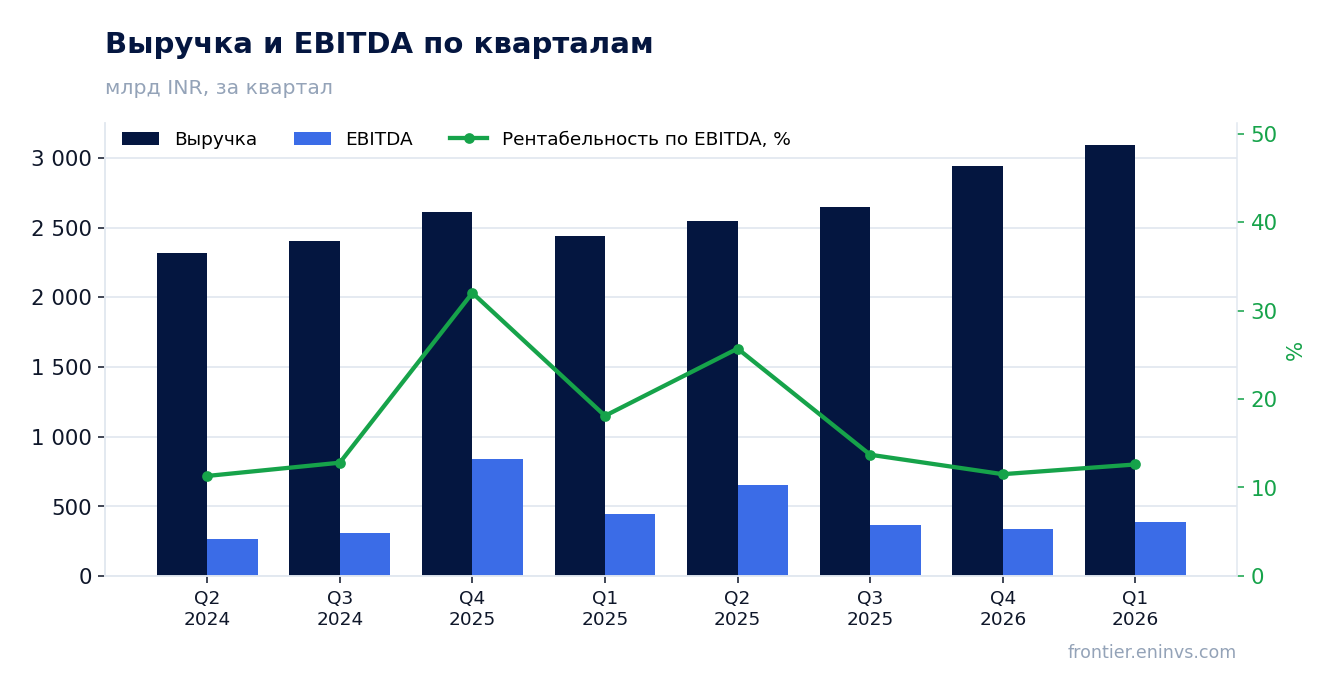
— Выручка выросла на 27,0% благодаря расширению во всех сегментах, но маржа EBITDA упала до 12,6% с 18,1% годом ранее
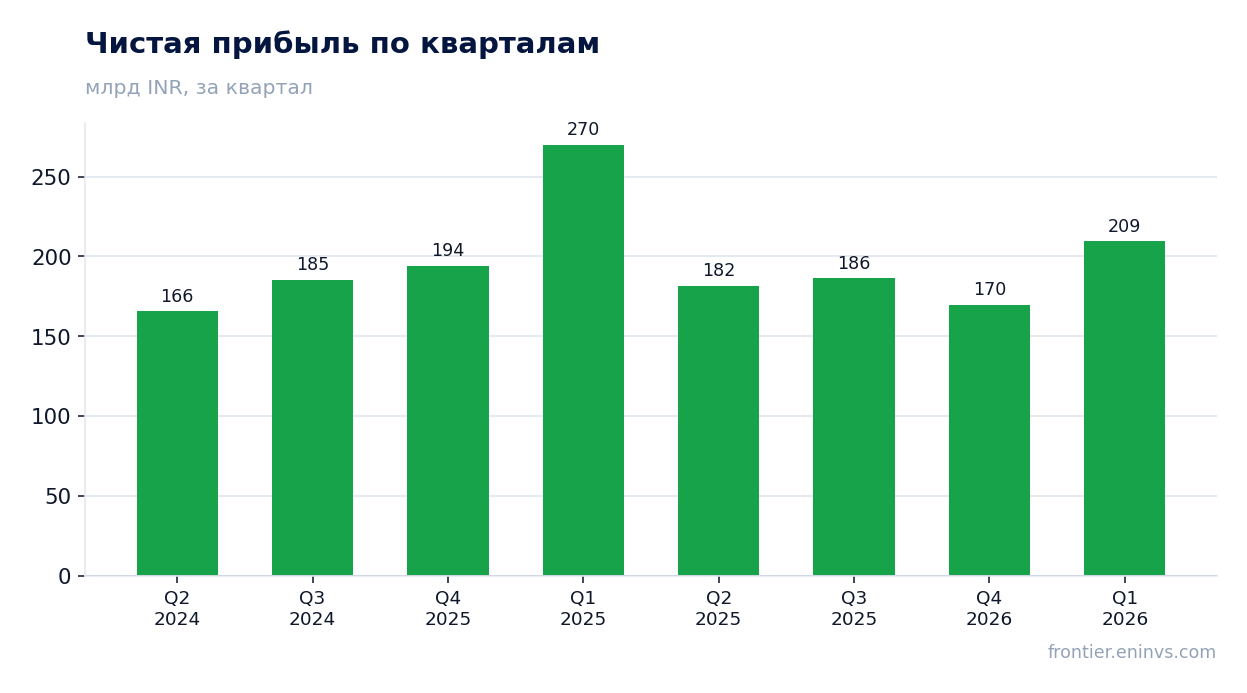
— Чистая прибыль снизилась на 22,4% из-за операционного рычага и, вероятно, разовых статей
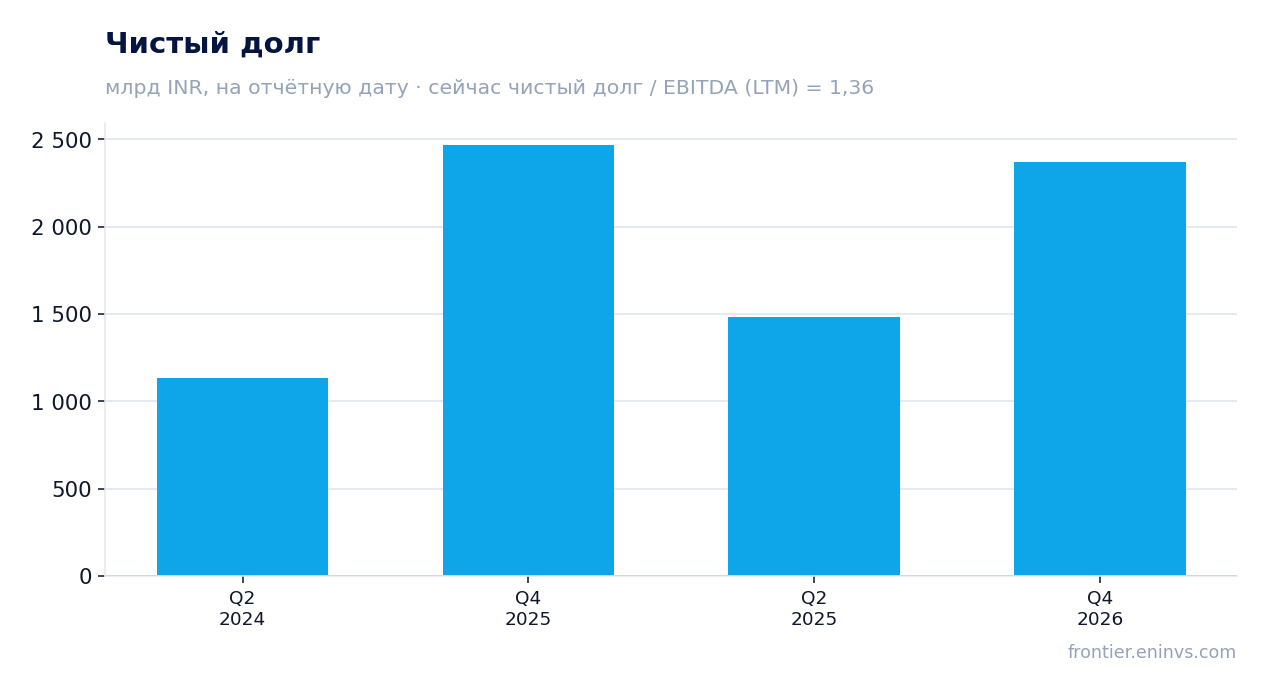
— Долговая нагрузка составляет 1,36 EBITDA за последние 12 месяцев, при этом чистый долг вырос на 891,4 млрд рупий за квартал
— Капитальные затраты и дивиденды: свободный денежный поток остаётся под давлением, дивидендная доходность – всего 0,47%
— Оценка: EV/EBITDA 11,3 против среднего 12,9 за три года, но модель портала даёт минус 14%
Оценка привлекательности
Ключевые показатели, млрд INR
| Показатель | Q1 2025 | Q1 2026 | Изм. |
|---|---|---|---|
| Выручка | 2 436 | 3 095 | +27,0% |
| EBITDA | 442 | 390 | -11,8% |
| Операционная прибыль | 291 | 324 | +11,5% |
| Чистая прибыль | 270 | 209 | -22,4% |
| Рентабельность по EBITDA | 18,1% | 12,6% | -5,5 п.п. |
| Чистая маржа | 11,1% | 6,8% | -4,3 п.п. |
Выручка выросла на 27,0% благодаря расширению во всех сегментах, но маржа EBITDA упала до 12,6% с 18,1% годом ранее
В первом квартале 2026 финансового года выручка Reliance Industries достигла 3 094,7 млрд рупий, что на 27,0% больше, чем годом ранее. Это самое сильное ускорение за последние четыре квартала: предыдущие темпы роста составляли от 5,1% до 12,5%.
Однако EBITDA за квартал составила 389,7 млрд рупий, что на 11,8% ниже прошлогоднего уровня. Маржа EBITDA сократилась до 12,6% с 18,1% – это указывает на то, что рост выручки сопровождался непропорциональным ростом затрат, возможно, в сегментах розницы и цифровых услуг, где конкуренция высока.
Чистая прибыль снизилась на 22,4% из-за операционного рычага и, вероятно, разовых статей
Чистая прибыль за первый квартал составила 209,5 млрд рупий, что на 22,4% меньше, чем год назад. Падение оказалось глубже, чем снижение EBITDA, что говорит о возросших финансовых расходах или неоперационных потерях.
Маржа чистой прибыли сократилась до 6,8% с 11,1% – это самый низкий уровень за последние четыре квартала. В предыдущих кварталах маржа колебалась в диапазоне 6,4–11,1%, что указывает на волатильность, но текущее значение находится у нижней границы.
Долговая нагрузка составляет 1,36 EBITDA за последние 12 месяцев, при этом чистый долг вырос на 891,4 млрд рупий за квартал
На конец квартала чистый долг Reliance Industries составил 2 370,9 млрд рупий, увеличившись на 891,4 млрд рупий по сравнению с предыдущей отчётной датой. За последние 12 месяцев чистый долг снизился на 97,9 млрд рупий, но квартальный скачок значителен.
Отношение чистого долга к EBITDA за последние 12 месяцев находится на уровне 1,36 – это умеренный показатель для компании с масштабными инвестициями. Тем не менее, резкий квартальный рост долга требует внимания: он может быть связан с капитальными затратами или изменениями в оборотном капитале.
Капитальные затраты и дивиденды: свободный денежный поток остаётся под давлением, дивидендная доходность – всего 0,47%
За последние 12 месяцев операционный денежный поток составил 1 921,1 млрд рупий, что обеспечивает покрытие капитальных затрат, однако свободный денежный поток, вероятно, остаётся ограниченным из-за активной инвестиционной программы в новых энергетических и цифровых проектах.
Дивидендная доходность за последние 12 месяцев составляет всего 0,47% – это низкий уровень для инвесторов, ориентированных на доход. Компания платит дивиденды, но размер выплат незначителен по сравнению с рыночной капитализацией, что делает акцию скорее историей роста, чем источником текущего дохода.
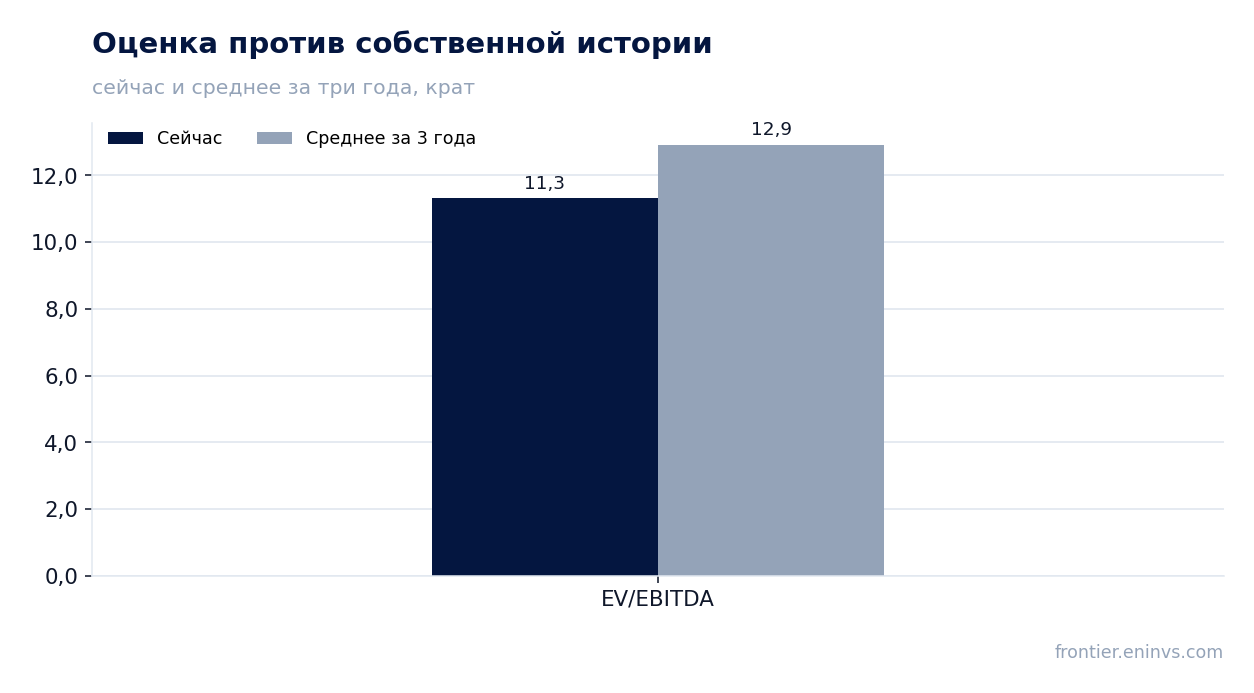
Оценка: EV/EBITDA 11,3 против среднего 12,9 за три года, но модель портала даёт минус 14%
Текущий мультипликатор EV/EBITDA составляет 11,3, что ниже среднего значения за три года (12,9). Формально акции выглядят дешевле своей собственной истории, однако это не учитывает падение маржинальности.
По модели портала, основанной на росте EBITDA и целевом мультипликаторе, потенциал снижения составляет -14% от текущей рыночной цены. Это означает, что даже при кажущейся дешевизне относительно прошлых значений, фундаментальная оценка не поддерживает текущий уровень капитализации.
Оценка по последним отчётным данным
| Метрика | Значение |
|---|---|
| Капитализация | 17 308 млрд INR |
| P/E (LTM) | 23,2 |
| EV/EBITDA (LTM) | 11,3 |
| P/B | 1,91 |
| Чистый долг / EBITDA | 1,36 |
| Операционный денежный поток (LTM) | 1 921 млрд |
| ROE | 8,4% |
| Дивидендная доходность (12 мес) | 0,5% |
| EV/EBITDA, среднее за 3 года | 12,9 |
Итог
В отчёте за первый квартал 2026 финансового года Reliance Industries показала впечатляющий рост выручки на 27,0%, но этот рост не транслировался в прибыль: EBITDA и чистая прибыль снизились, а маржа упала до минимумов. Долговая нагрузка остаётся умеренной, но квартальный скачок долга и низкая дивидендная доходность делают акцию менее привлекательной для консервативных инвесторов. При текущей оценке, несмотря на дисконт к собственной истории, модель портала указывает на потенциал снижения, что формирует вердикт «скорее непривлекательно».
Перейти к финансовой карточке компании RELIANCE →
Смотрите также: обзор рынка · карта оценки рынков · скринеры акций