Sun Pharmaceutical: revenue accelerates to +10.1%, but EBITDA margin contracts and debt rises by 18.8 bn
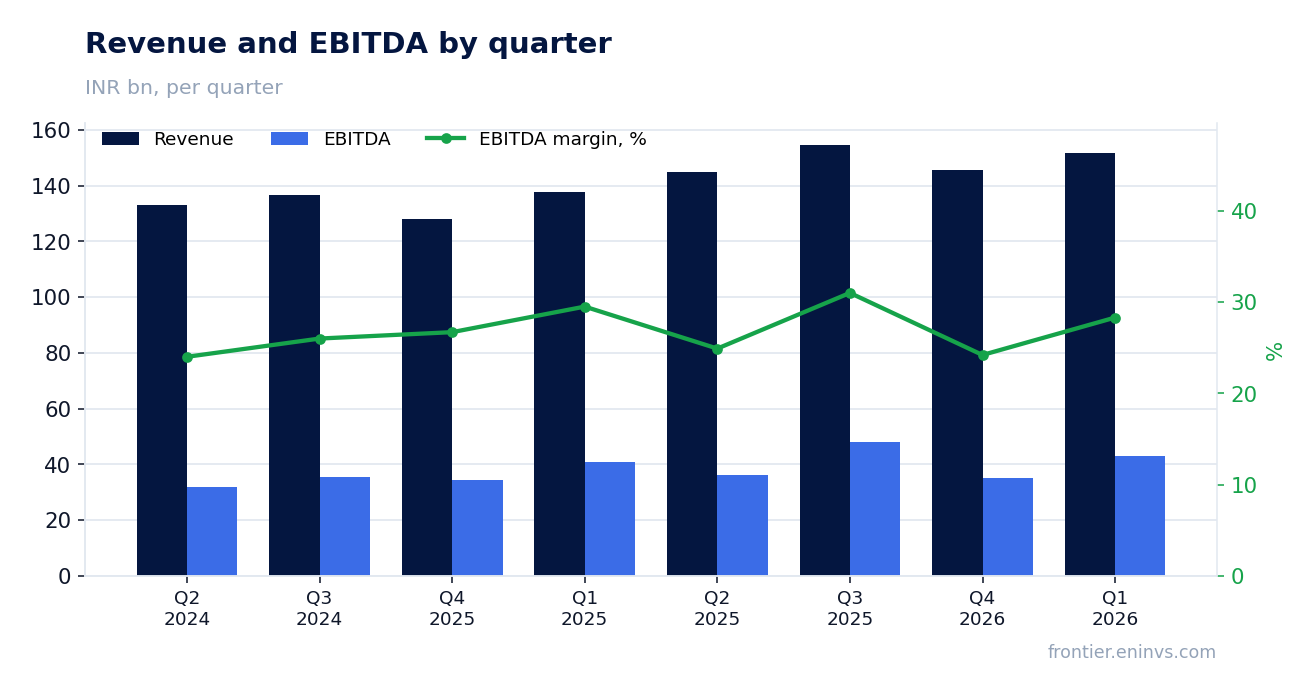
25 августа Sun Pharmaceutical раскрыла результаты за первый квартал 2026 финансового года: выручка выросла на 10,1% год к году, до 151 835,5 млн INR, EBITDA – на 8,8%, до 42 956,8 млн INR, чистая прибыль – на 27,0%, до 28 947,9 млн INR. Акции торгуются по мультипликатору EV/EBITDA 26,4 против среднего за три года 27,2, что выглядит справедливо, но с учётом роста долга и сжатия маржи вердикт – «скорее привлекательно».
Key takeaways
— Revenue grows double-digit, but EBITDA margin fell from 28.6% to 28.3%
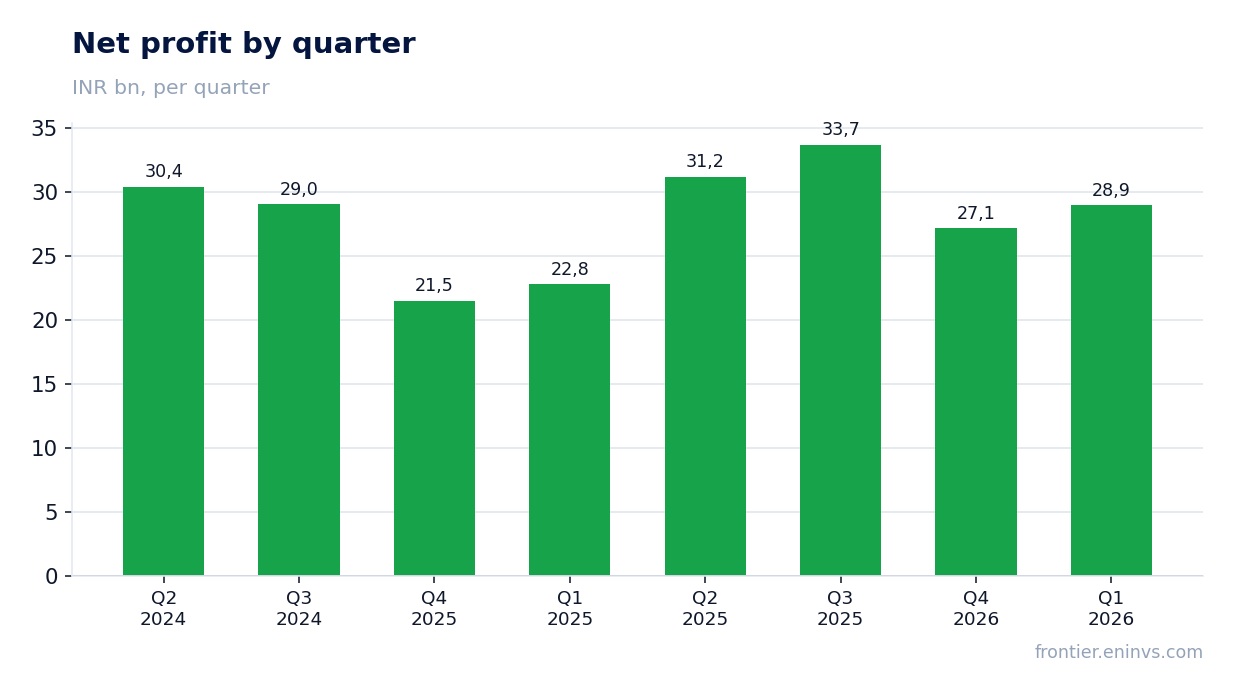
— Net profit rose 27% thanks to one-offs and operational efficiency
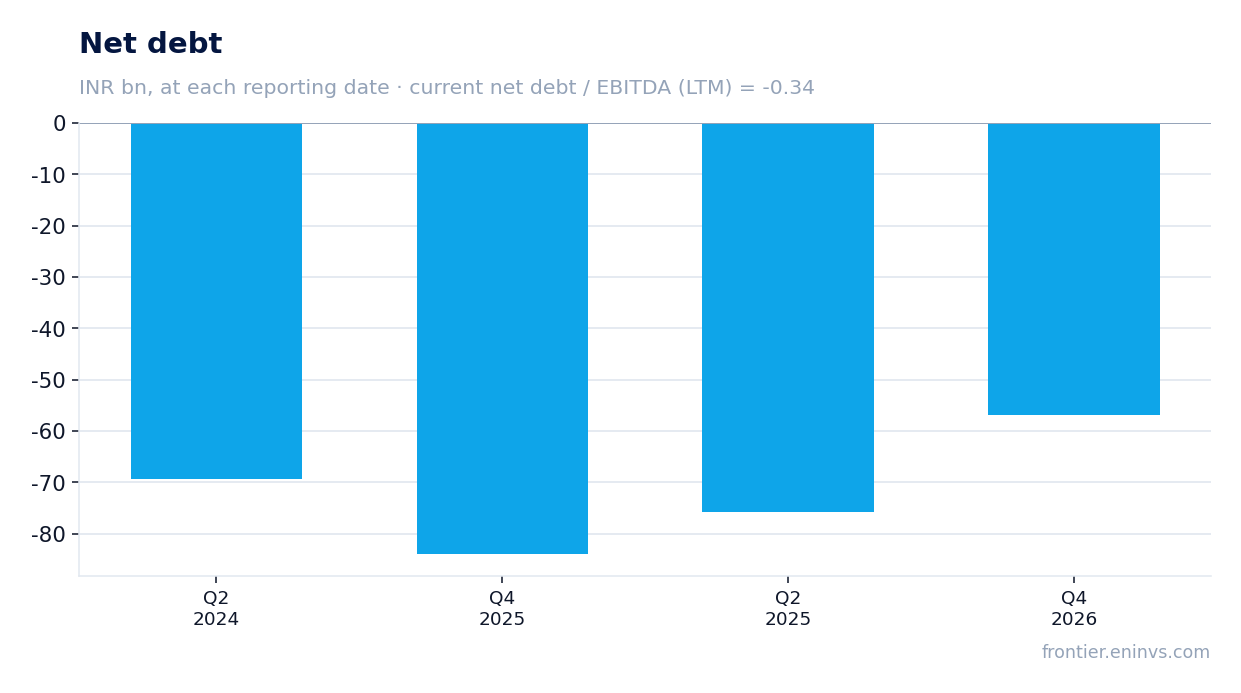
— Debt increased by 18.8 bn INR in the quarter and 27.1 bn over the year, but debt-to-EBITDA remains negative
— Dividend yield of 0.86% is below the key rate, limiting appeal for investors
— Portal model valuation implies 3% upside
— Operating cash flow over the last 12 months was 124,200 mn INR, covering investments and dividends
Attractiveness
Key figures, INR bn
| Metric | Q1 2025 | Q1 2026 | Change |
|---|---|---|---|
| Revenue | 138 | 152 | +10.1% |
| EBITDA | 39.5 | 43.0 | +8.8% |
| Operating profit | 33.7 | 35.6 | +5.5% |
| Net profit | 22.8 | 28.9 | +27.0% |
| EBITDA margin | 28.6% | 28.3% | -0.3 pp |
| Net margin | 16.5% | 19.1% | +2.6 pp |
Revenue grows double-digit, but EBITDA margin fell from 28.6% to 28.3%
In the first quarter of fiscal 2026, Sun Pharmaceutical's revenue reached 151,835.5 mn INR, up 10.1% year-on-year. This continues double-digit growth: in the previous quarter (Q4 FY2025) growth was 13.6%, and in Q1 FY2025 it was 9.0%. Thus, the trend remains solid, albeit slower than the prior quarter.
EBITDA for the quarter came in at 42,956.8 mn INR, up 8.8% year-on-year. However, the EBITDA margin fell from 28.6% to 28.3%: cost growth outpaced revenue growth. This suggests some pressure on operational efficiency despite strong demand.
Net profit rose 27% thanks to one-offs and operational efficiency
Net profit for Q1 FY2026 stood at 28,947.9 mn INR, up 27.0% year-on-year. The growth significantly outpaced revenue and EBITDA dynamics, indicating improved efficiency or one-off gains. Net margin expanded from 16.5% to 19.1%.
In the prior quarter (Q4 FY2025), net profit was 27,140.3 mn INR, also reflecting sustained high profitability. However, assessing the sustainability of this growth requires accounting for possible one-offs not disclosed in the provided data.
Debt increased by 18.8 bn INR in the quarter and 27.1 bn over the year, but debt-to-EBITDA remains negative
Net debt at the latest balance sheet date was -56,889.0 mn INR, meaning the company retains a net cash position. During the quarter, debt increased by 18.8 bn INR, and over the last 12 months by 27.1 bn INR. Despite the increase, the net debt-to-EBITDA ratio for the trailing twelve months remains negative at -0.34.
The debt increase may be related to investments or dividend payments, but the exact reasons are not disclosed. Nevertheless, the negative debt-to-EBITDA ratio indicates that the company remains financially sound and has a safety cushion.
Dividend yield of 0.86% is below the key rate, limiting appeal for investors
Over the last 12 months, Sun Pharmaceutical paid dividends providing a yield of 0.86% at the current price. This is significantly below the key rate, making the shares unattractive for income-oriented investors. However, for a company with a strong balance sheet and growth potential, this may be acceptable.
The size of dividends for the current year will depend on profit and payout policy. With trailing net profit of 120,955.8 mn INR and a possible payout ratio of 30–40%, the dividend per share could yield around 0.5–0.7%, still below the key rate. The main risk to payouts is rising debt or capital expenditures.
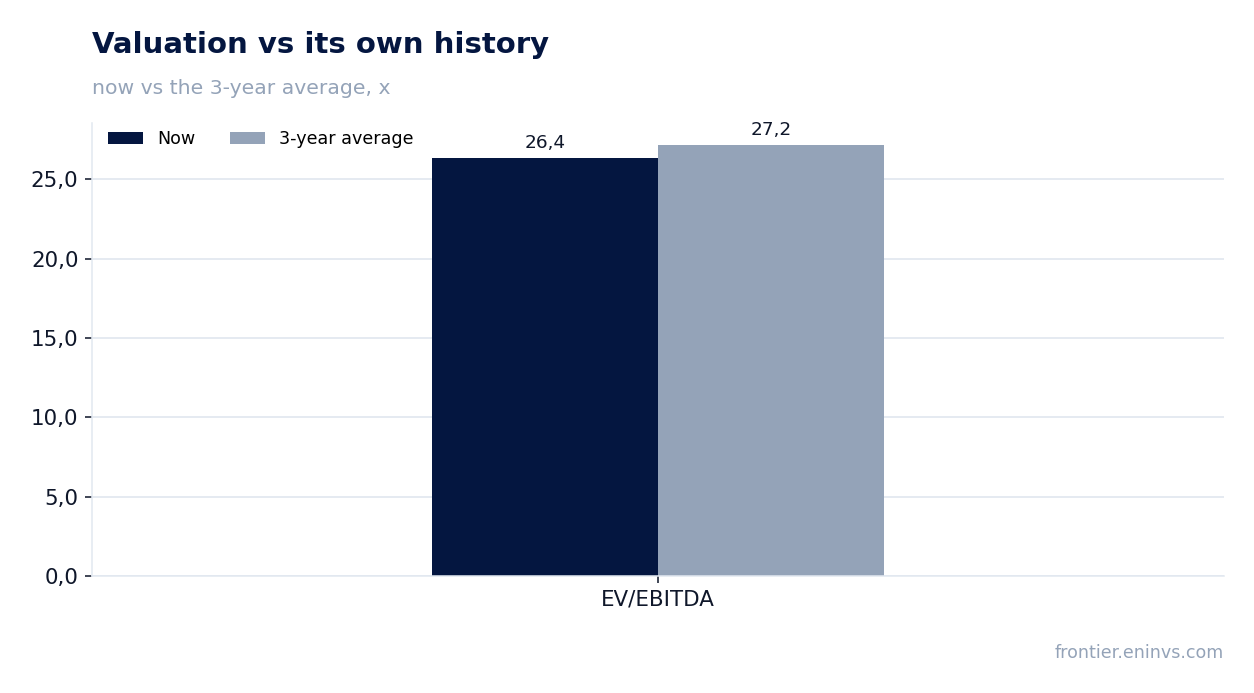
Portal model valuation implies 3% upside
According to the portal model, based on EBITDA growth and target multiple, the fair value of Sun Pharmaceutical shares is only 3% above the current market price. This suggests that the market has already priced in much of the expected growth, and the potential for further appreciation is limited.
The current EV/EBITDA multiple is 26.4, slightly below the three-year average of 27.2. The trailing P/E is 37.0, reflecting high investor expectations. Thus, the shares trade near their historical valuation, and significant upside would require improved operational performance.
Operating cash flow over the last 12 months was 124,200 mn INR, covering investments and dividends
Over the last 12 months, Sun Pharmaceutical's operating cash flow amounted to 124,200.0 mn INR. This is a significant volume, allowing the company to finance capital expenditures and dividend payments without taking on additional debt. However, exact capex data is unavailable, making a full assessment difficult.
The increase in net debt by 27.1 bn INR over the year may indicate that the company is stepping up investments or returning capital to shareholders. Nevertheless, operating cash flow remains strong, underpinning business resilience.
Valuation on the latest reported figures
| Metric | Value |
|---|---|
| Market cap | 4 474 bn INR |
| P/E (LTM) | 37.0 |
| EV/EBITDA (LTM) | 26.4 |
| P/B | 5.35 |
| Net debt / EBITDA (LTM) | -0.34 |
| Operating cash flow (LTM) | 124 bn |
| ROE | 13.8% |
| Dividend yield (12m) | 0.9% |
| EV/EBITDA, 3-year average | 27.2 |
Bottom line
Sun Pharmaceutical continues to show solid revenue and profit growth, but EBITDA margin is contracting and debt is rising. Net profit grew 27% largely due to one-offs, warranting caution about sustainability. The shares trade near their three-year average valuation, and the portal model implies only 3% upside. Dividend yield is low, making the stock more of a growth story than an income source. Verdict: 'rather attractive' – the company is strong, but the current price already reflects most positive expectations.
Open the company's financial profile SUNPHARMA →
See also: market overview · valuation map · stock screeners