Tech Mahindra: revenue accelerates to +17.7%, but margin pressure eats profit growth
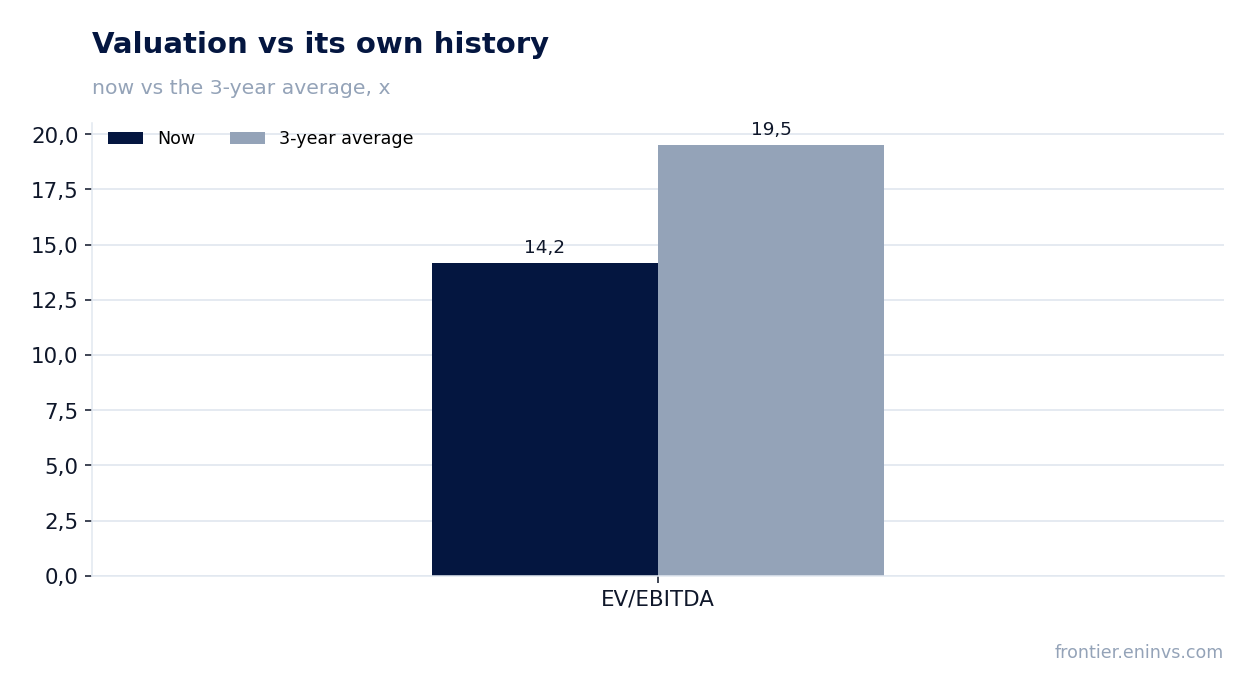
11 августа Tech Mahindra раскрыла результаты за первый квартал 2026 финансового года: выручка выросла на 17,7% год к году, до 157,1 млрд индийских рупий, EBITDA – на 22,2%, чистая прибыль – на 28,4%. Несмотря на ускорение роста, маржа EBITDA расширилась лишь до 16,8% с 16,1% годом ранее, что отражает сохраняющееся давление на рентабельность. При текущей цене акция выглядит скорее привлекательно: мультипликатор EV/EBITDA 14,2 ниже собственного трёхлетнего среднего 19,5, а дивидендная доходность 3,4% остаётся умеренной.
Key takeaways
— Revenue accelerated to +17.7% – the best pace in recent quarters
— EBITDA margin rose to 16.8%, but still below pre-crisis levels
— Net profit +28.4% – supported by operating leverage and tax effects
— Free cash flow remains positive, but capex is rising
— Low debt burden: net debt/EBITDA at -0.49
— Dividend yield of 3.4% – above the three-year average
— Valuation below its own history: EV/EBITDA 14.2 vs. average 19.5
Attractiveness
Key figures, INR bn
| Metric | Q1 2025 | Q1 2026 | Change |
|---|---|---|---|
| Revenue | 134 | 157 | +17.7% |
| EBITDA | 21.5 | 26.3 | +22.2% |
| Operating profit | 14.8 | 22.6 | +53.3% |
| Net profit | 11.4 | 14.7 | +28.4% |
| EBITDA margin | 16.1% | 16.8% | +0.7 pp |
| Net margin | 8.5% | 9.3% | +0.8 pp |
Revenue accelerated to +17.7% – the best pace in recent quarters
In the first quarter of fiscal 2026 (April–June 2026), Tech Mahindra reported revenue of INR 157.1 billion, up 17.7% year-on-year. This is a marked acceleration from +12.6% in Q4 2025 and +8.3% in Q3 2025. Growth is underpinned by sustained demand for digital services and cloud solutions, though segment-specific drivers are not disclosed.
Sequential dynamics are also positive: revenue rose from INR 150.8 billion in Q4 2025 to INR 157.1 billion in Q1 2026, up 4.2%. This indicates continued momentum, but growth could decelerate in the second half if clients trim IT budgets amid macroeconomic uncertainty.
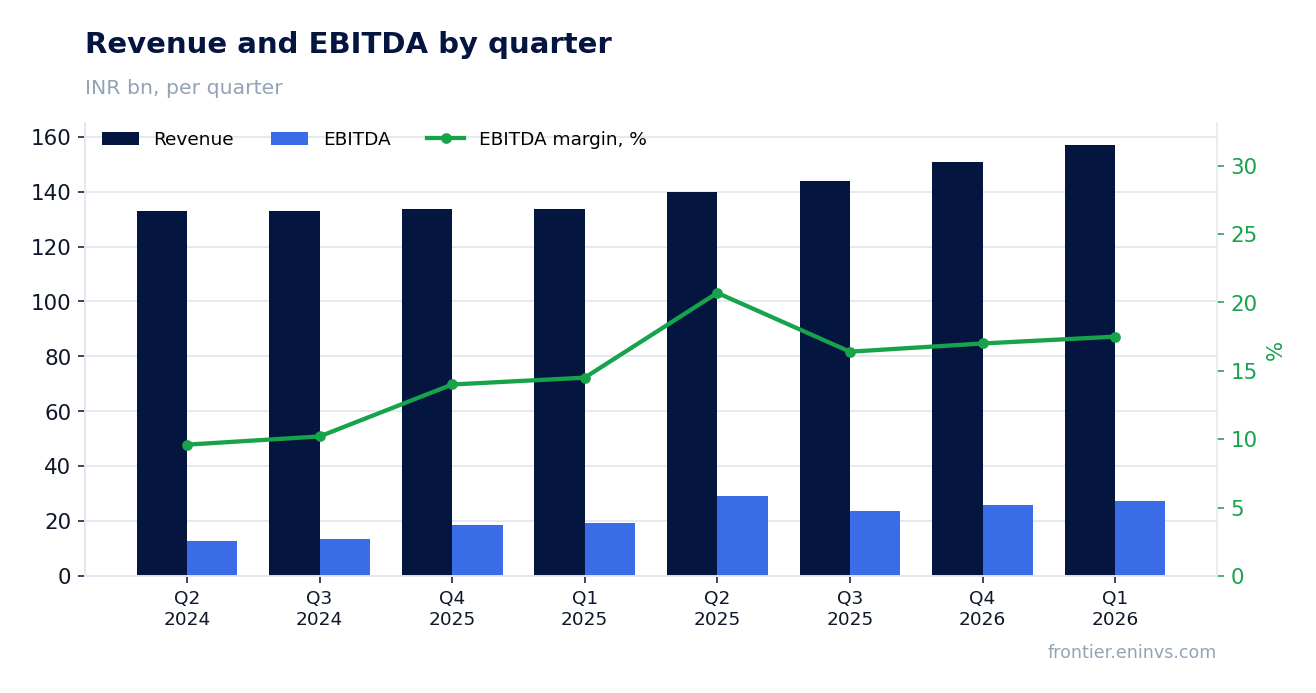
EBITDA margin rose to 16.8%, but still below pre-crisis levels
EBITDA in the reported quarter reached INR 27.4 billion, up 22.2% year-on-year. EBITDA margin expanded to 16.8% from 16.1% in Q1 2025. The improvement is driven by operating leverage on revenue growth and cost control, but the margin remains below levels seen in 2023–2024, when it exceeded 20%.
Over the trailing twelve months (LTM), EBITDA stood at INR 100.8 billion, implying a margin of about 17.0%. This is still well below historical peaks, indicating persistent pricing pressure and cost structure challenges in the industry.
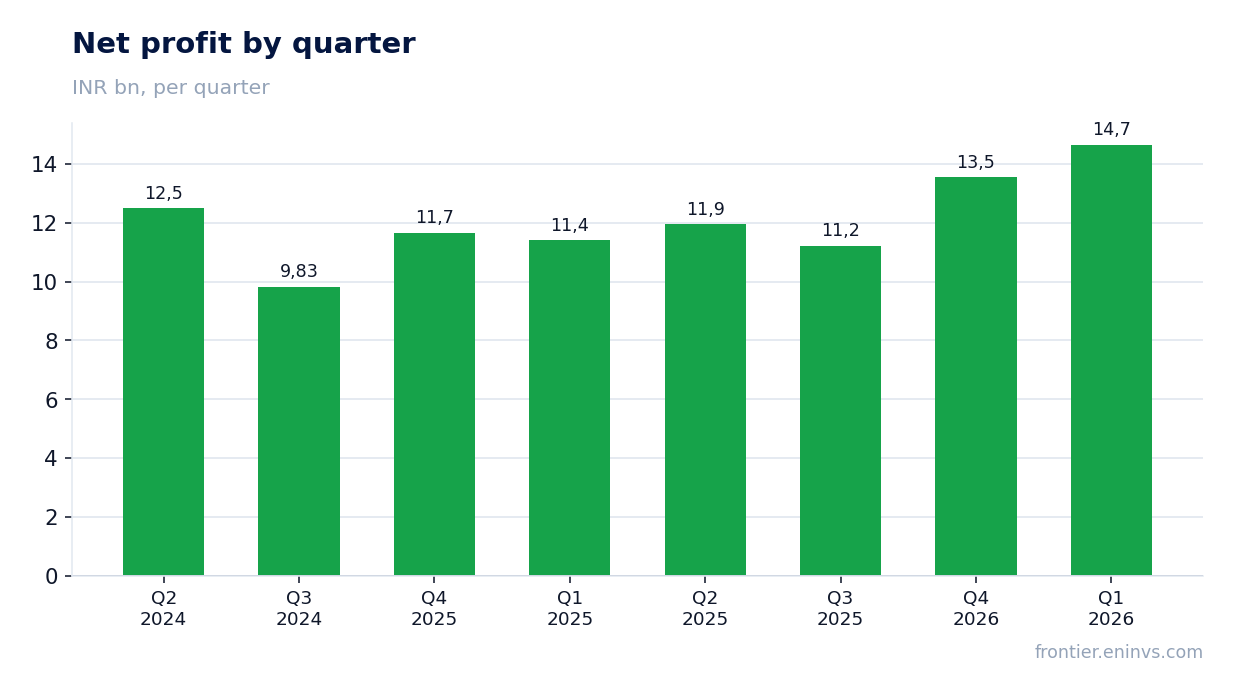
Net profit +28.4% – supported by operating leverage and tax effects
Net profit in Q1 2026 rose 28.4% year-on-year to INR 14.7 billion. Growth outpaced EBITDA, indicating positive operating leverage and possibly one-off tax items. Net margin increased to 9.3% from 8.5% a year earlier.
Over the trailing twelve months, net profit reached INR 51.4 billion, implying a net margin of about 8.7%. The company maintains healthy profitability, though it is sensitive to currency fluctuations and tax rates across jurisdictions.
Free cash flow remains positive, but capex is rising
Operating cash flow over the trailing twelve months was INR 61.7 billion, well above net profit. This supports positive free cash flow even after capital expenditures, which have been increasing in recent quarters as the company invests in cloud infrastructure and data centers.
Rising capex is a deliberate choice: the company is expanding capacity to serve growing demand. However, if capital spending continues to outpace revenue growth, free cash flow could shrink, limiting room for higher dividends.
Low debt burden: net debt/EBITDA at -0.49
At the end of Q1 2026, net debt was negative at INR -49.8 billion, meaning cash exceeds debt. The net debt/EBITDA (LTM) ratio stands at -0.49, indicating a significant financial cushion.
Over the trailing twelve months, net debt decreased by INR 11.3 billion, reflecting cash generation. The low debt burden gives the company flexibility for investments, M&A, and returning capital to shareholders.
Dividend yield of 3.4% – above the three-year average
Over the trailing twelve months, Tech Mahindra paid dividends yielding 3.4% at the current price. This is above the three-year average dividend yield, making the stock attractive for income-oriented investors.
The company has historically allocated a significant portion of free cash flow to dividends. If current payout levels are maintained and profits grow, the dividend could be increased, but the decision rests with the board and capital needs for growth.
Valuation below its own history: EV/EBITDA 14.2 vs. average 19.5
The current EV/EBITDA (LTM) multiple is 14.2, well below the three-year average of 19.5. This suggests the market is valuing the company at a discount to its own history, despite accelerating revenue growth.
The P/E (LTM) ratio is 28.8, reflecting expectations of further earnings growth. According to the portal's model, the upside to fair value is +27%, supporting the growth potential. If the company continues to improve margins and generate cash flow, the current valuation may prove undemanding.
Valuation on the latest reported figures
| Metric | Value |
|---|---|
| Market cap | 1 478 bn INR |
| P/E (LTM) | 28.8 |
| EV/EBITDA (LTM) | 14.2 |
| P/B | 4.99 |
| Net debt / EBITDA (LTM) | -0.49 |
| Operating cash flow (LTM) | 61.7 bn |
| ROE | 19.6% |
| Dividend yield (12m) | 3.4% |
| EV/EBITDA, 3-year average | 19.5 |
Bottom line
Tech Mahindra reported a strong quarter: revenue accelerated to +17.7%, EBITDA margin expanded, and net profit grew 28.4%. The company maintains low leverage (net debt/EBITDA at -0.49) and generates positive free cash flow. However, margins remain below historical levels, and rising capex warrants attention. At 14.2 EV/EBITDA versus its own average of 19.5 and a dividend yield of 3.4%, the stock looks rather attractive. The key question is whether the company can sustain growth momentum and continue improving profitability without sacrificing cash flow.
Open the company's financial profile TECHM →
See also: market overview · valuation map · stock screeners