Samsung Electronics: revenue doubled, profit up 14-fold – but sustainability is the question
On August 25, Samsung Electronics reported Q2 2026 results. Revenue grew 130.0% YoY to KRW 171.5 trillion, EBITDA rose 539.3% to KRW 102.5 trillion, and net profit surged 1344.4% to KRW 71.3 trillion. The shares look attractive: multiples are below their own history, and the portal's model implies +93% upside.
Key takeaways
— Revenue doubled YoY, but the main driver was explosive growth in Q2
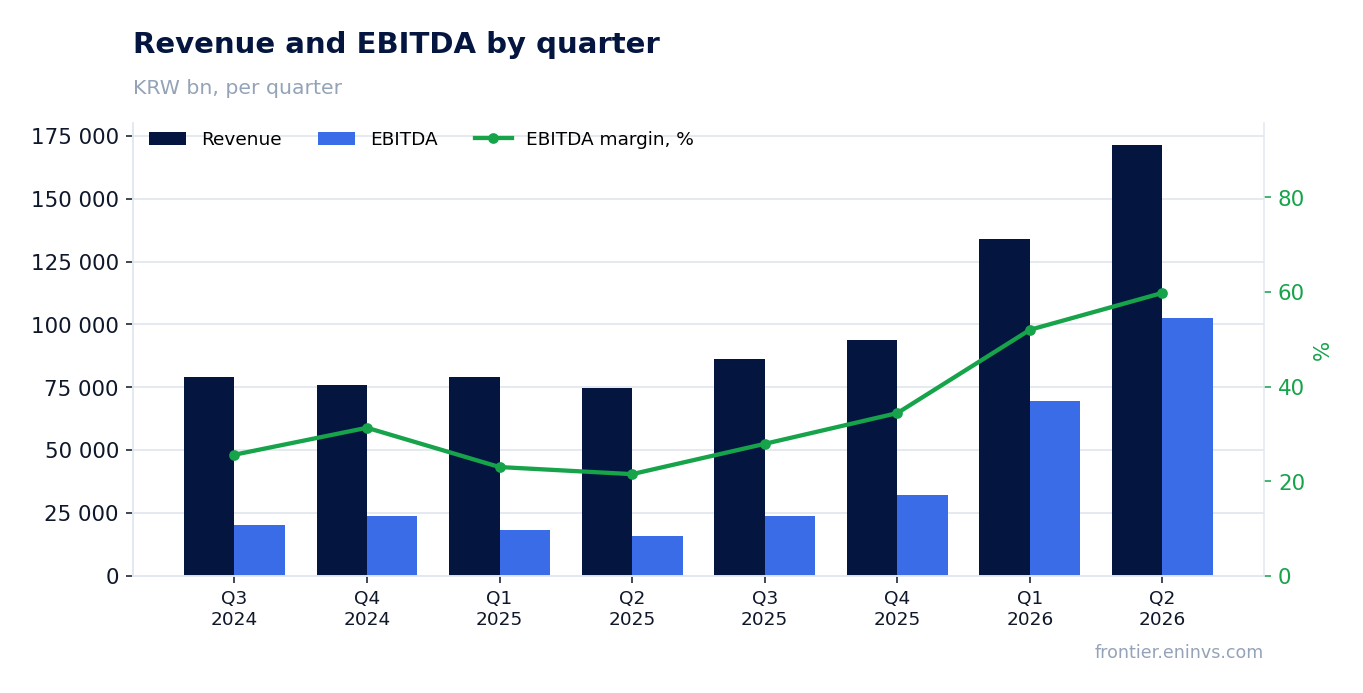
— EBITDA margin expanded from 21.5% to 59.8% – operating leverage fully kicked in
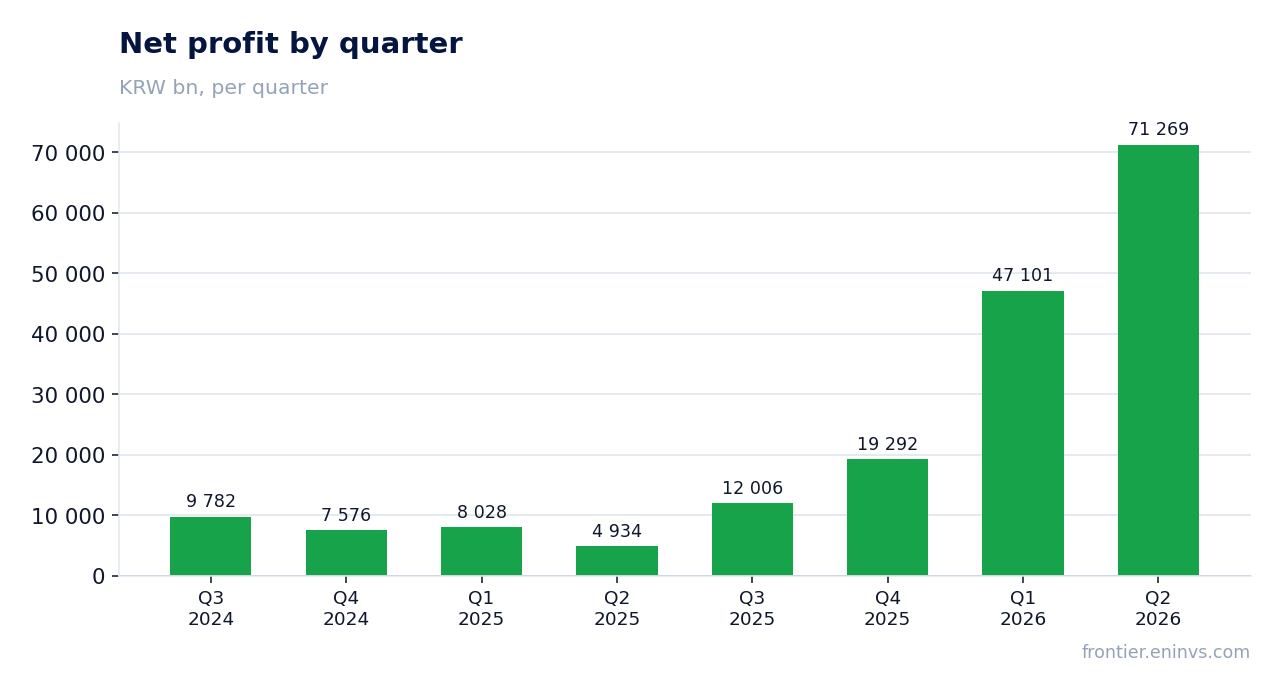
— Net profit grew 14-fold, but nearly half is one-off effects
— Operating cash flow 1.5x EBITDA – high earnings quality
— Capex rose, but free cash flow remains substantial
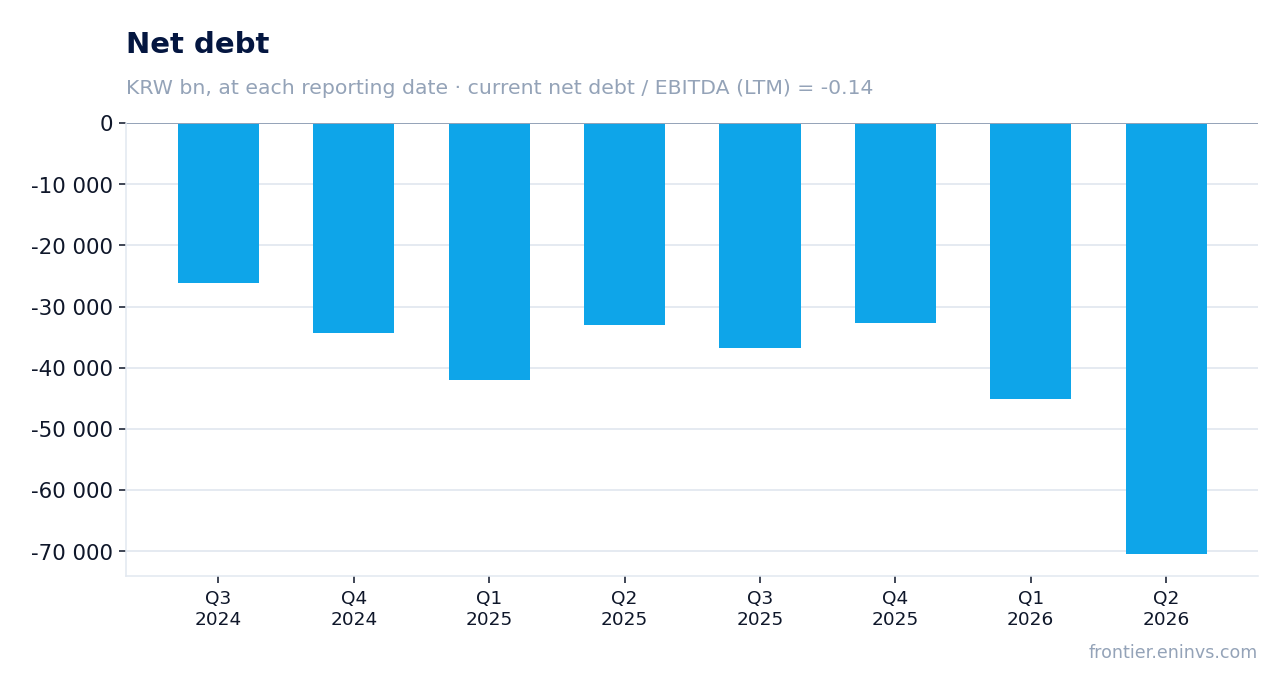
— Net debt is negative – the company funds growth without borrowing
— Dividend yield is low, but payout growth potential is high
Attractiveness
Key figures, KRW bn
| Metric | Q2 2025 | Q2 2026 | Change |
|---|---|---|---|
| Revenue | 74 566 | 171 499 | +130.0% |
| EBITDA | 16 033 | 102 500 | +539.3% |
| Operating profit | 4 676 | 89 492 | +1813.8% |
| Net profit | 4 934 | 71 269 | +1344.4% |
| Operating cash flow | 17 360 | 105 081 | +505.3% |
| Capex | 13 817 | 14 783 | +7.0% |
| EBITDA margin | 21.5% | 59.8% | +38.3 pp |
| Net margin | 6.6% | 41.6% | +35.0 pp |
Revenue doubled YoY, but the main driver was explosive growth in Q2
In Q2 2026, Samsung Electronics' revenue reached KRW 171,499,470 million, up 130.0% from the same quarter a year earlier. This is a sharp acceleration from previous quarters: Q1 2026 saw 69.2% growth, while Q2 2025 was only 0.7%.
Quarterly dynamics show growth gaining momentum in late 2025: Q4 2025 revenue rose 23.8%, followed by two quarters of double-digit growth. The semiconductor division, recovering from a downturn, likely contributed the most, though the report does not break this down.
EBITDA margin expanded from 21.5% to 59.8% – operating leverage fully kicked in
EBITDA for Q2 2026 reached KRW 102,499,904 million, up 539.3% YoY. EBITDA margin expanded from 21.5% to 59.8% – indicating that revenue growth came from high-margin products, likely memory and HBM, where prices and demand surged.
This margin jump is a result of operating leverage: fixed costs were spread over a much larger revenue base. However, it is worth remembering that in Q2 2025 the margin was abnormally low – 21.5% – making the comparison impressive but less sustainable.
Net profit grew 14-fold, but nearly half is one-off effects
Net profit for Q2 2026 reached KRW 71,269,468 million, up 1344.4% YoY. However, such explosive growth is partly due to a low base: Q2 2025 profit was only KRW 4,934,034 million.
The report does not disclose one-off items, but given the scale, part of the profit may relate to tax or investment gains. Without these, growth would be less dramatic but still substantial.
Operating cash flow 1.5x EBITDA – high earnings quality
In Q2 2026, operating cash flow was KRW 105,081,086 million, 1.5x EBITDA for the same period. This is a rare sign of earnings quality: the company not only shows high profit but actually receives cash.
Over the trailing twelve months, operating cash flow reached KRW 85,315,100 million, also above EBITDA for the same period (KRW 234,225,704.6 million). This indicates that profit growth is backed by real cash inflows, not just accounting effects.
Capex rose, but free cash flow remains substantial
Capex in Q2 2026 was KRW 14,783,327 million, lower than Q1 (KRW 18,176,955 million) but higher than Q2 2025 (KRW 13,817,083 million). The company continues to invest in production capacity, especially advanced chips.
Free cash flow (operating cash flow minus capex) for the quarter was about KRW 90.3 trillion – a substantial amount that allows funding dividends and building cash reserves.
Net debt is negative – the company funds growth without borrowing
At the end of Q2 2026, Samsung Electronics' net debt was KRW -70,507,661 million, meaning cash and equivalents significantly exceed debt. This is an improvement from KRW -45,167,957 million at the end of Q1 2026.
Net debt to EBITDA for the trailing twelve months is -0.14, indicating a very conservative financial policy. The company can fund its investments and dividends without borrowing.
Dividend yield is low, but payout growth potential is high
Over the trailing twelve months, Samsung Electronics paid dividends yielding 0.62% of the current share price. This is below the market average, but the company has historically increased payouts as profits grow.
Given current trailing net profit (KRW 149,669,173 million) and a conservative 30% payout ratio, the dividend per share could be significantly higher. However, the company has not yet disclosed its 2026 policy, so our estimates are only a projection.
Valuation: multiples below own history, portal's model gives +93%
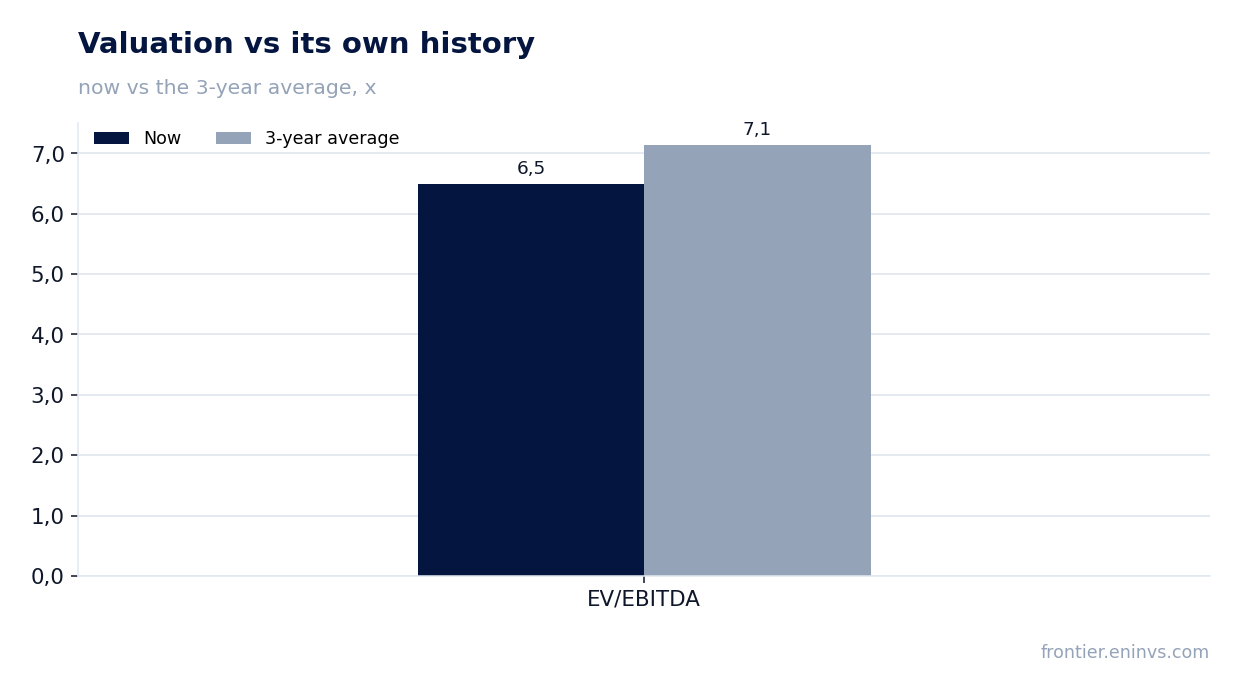
Current P/E LTM is 10.38, and EV/EBITDA LTM is 6.49. The three-year average EV/EBITDA is 7.14, meaning the stock trades at a discount to its own history. This looks attractive given accelerating revenue and margin growth.
According to the portal's model, based on EBITDA growth and target multiple, the upside potential is +93% from the current price. This is our own calculation, not a market consensus.
Valuation on the latest reported figures
| Metric | Value |
|---|---|
| Market cap | 1 553 450 bn KRW |
| P/E (LTM) | 10.4 |
| EV/EBITDA (LTM) | 6.5 |
| P/B | 3.56 |
| Net debt / EBITDA (LTM) | -0.14 |
| Operating cash flow (LTM) | 85 315 bn |
| ROE | 53.5% |
| Dividend yield (12m) | 0.6% |
| EV/EBITDA, 3-year average | 7.1 |
Bottom line
Samsung Electronics delivered an impressive quarter: revenue doubled, EBITDA margin reached 59.8%, and net profit grew 14-fold. However, part of the growth is due to a low base and possibly one-off gains. Operating cash flow confirms earnings quality, and negative net debt provides financial flexibility. With multiples below own history and +93% upside on the portal's model, the shares look attractive. The key question is whether such growth pace can be sustained in coming quarters.
Open the company's financial profile 005930 →
See also: market overview · valuation map · stock screeners