KT Corporation: revenue down 10.1%, and the portal's model sees 78% downside
On August 11, KT Corporation reported Q2 2026 results: revenue fell 10.1% year-on-year, EBITDA dropped 20.3%, and net profit declined 36.0%. Amid falling operating metrics and rising debt, the stock trades at an EV/EBITDA multiple of 3.6, above its own three-year average of 3.3, and the portal's model implies 78% downside. Verdict: the share looks unattractive at the current price.
Key takeaways
— Revenue in Q2 2026 fell 10.1% year-on-year to KRW 6,679,866 million
— EBITDA dropped 20.3%, and the EBITDA margin declined from 26.8% to 23.7%
— Net profit fell 36.0% to KRW 440,083 million, driven by lower operating profit
— Debt rose by KRW 244.5 billion over the quarter and by KRW 1,265.2 billion over 12 months, to KRW 7,278,601 million
— Operating cash flow in Q2 2026 was KRW 1,521,480 million, covering capital expenditure of KRW 178,048 million
— Trailing twelve-month dividend yield is 4.5%, above the key rate, but payments are at risk due to falling profit
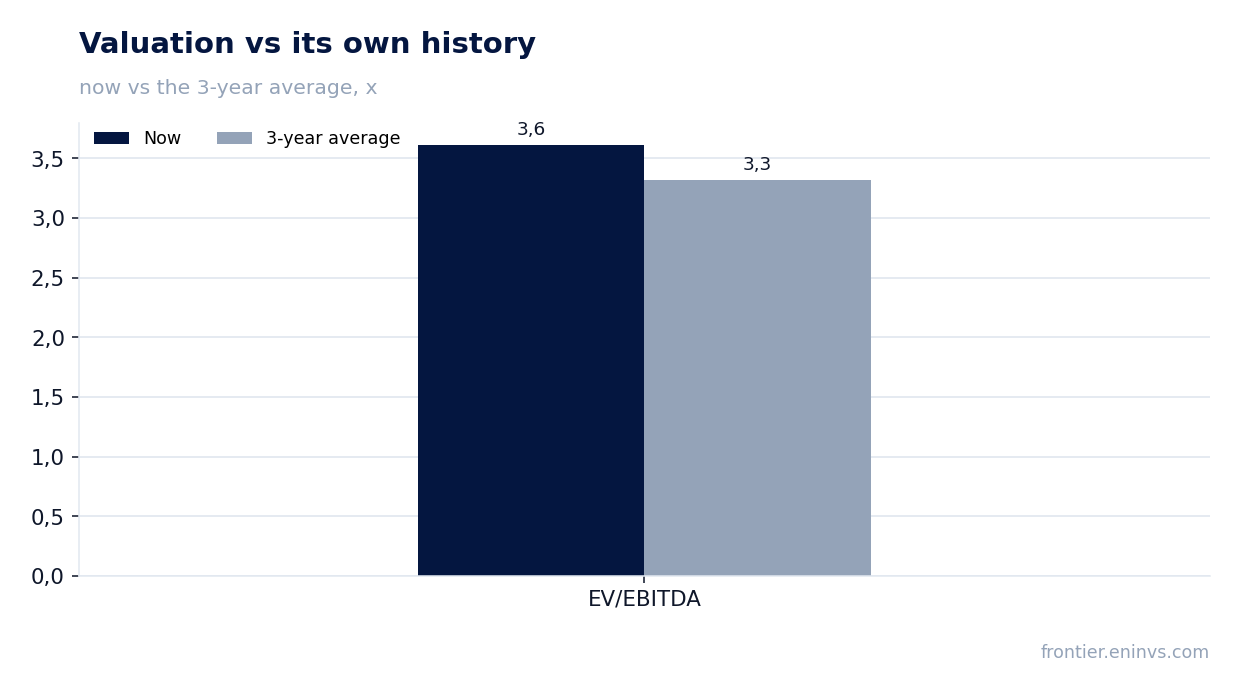
— EV/EBITDA multiple of 3.6 is above its own three-year average of 3.3, and the portal's model implies 78% downside
Attractiveness
Key figures, KRW bn
| Metric | Q2 2025 | Q2 2026 | Change |
|---|---|---|---|
| Revenue | 7 427 | 6 680 | -10.1% |
| EBITDA | 1 991 | 1 586 | -20.3% |
| Operating profit | 1 015 | 648 | -36.1% |
| Net profit | 688 | 440 | -36.0% |
| Operating cash flow | 2 056 | 1 521 | -26.0% |
| Capex | 41.0 | 178 | +334.2% |
| EBITDA margin | 26.8% | 23.7% | -3.1 pp |
| Net margin | 9.3% | 6.6% | -2.7 pp |
Revenue in Q2 2026 fell 10.1% year-on-year to KRW 6,679,866 million
In Q2 2026, KT Corporation's revenue reached KRW 6,679,866 million, down 10.1% from the same quarter a year earlier. This continues the negative trend: in Q1 2026, revenue also fell 1.0% year-on-year, while in Q2 2025 growth was 13.5%.
The revenue decline reflects deteriorating operational dynamics. Over the last four quarters (LTM), revenue was KRW 27,430,000 million, only 0.1% higher than the previous twelve months, but growth has slowed from double-digit to negative.
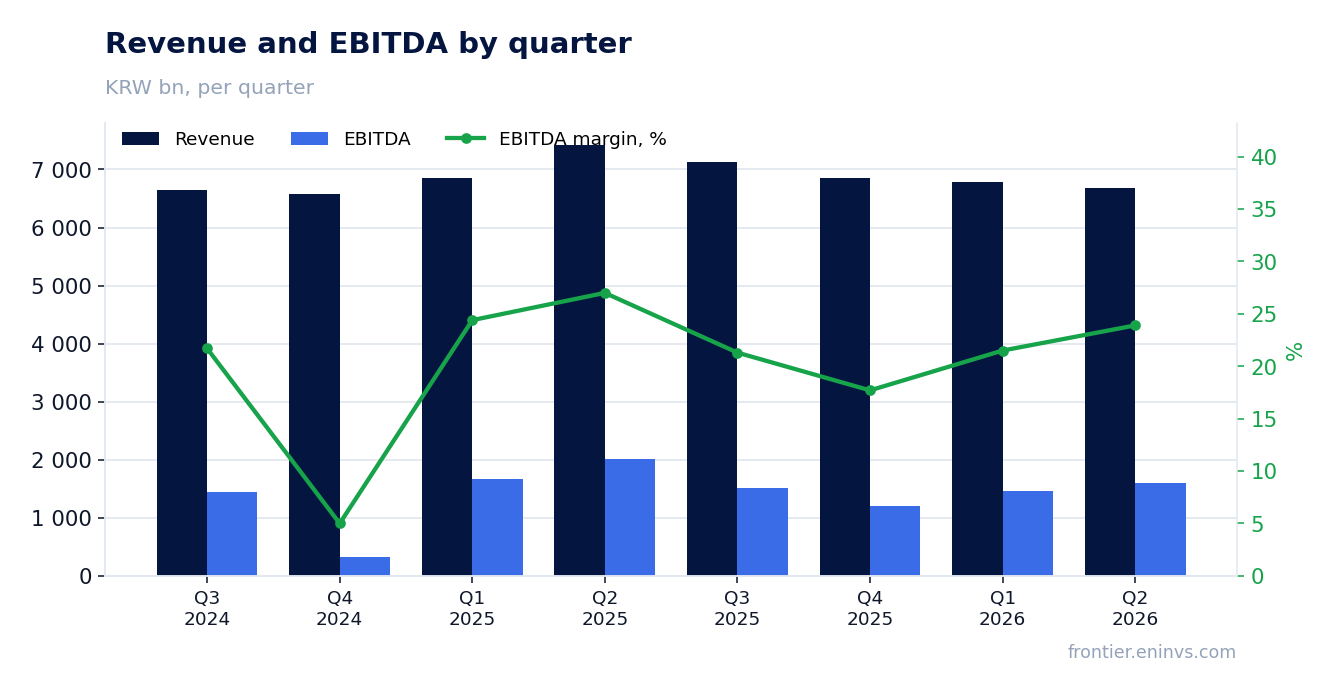
EBITDA dropped 20.3%, and the EBITDA margin declined from 26.8% to 23.7%
EBITDA in Q2 2026 was KRW 1,593,482 million, down 20.3% from a year earlier. The EBITDA margin fell from 26.8% to 23.7%, indicating pressure on operational efficiency.
Over the last twelve months, EBITDA reached KRW 5,518,376.5 million, up 3.4% from the previous four quarters, but growth has slowed. The margin decline in Q2 2026 is a key signal for investors, as it reflects a deteriorating cost structure.
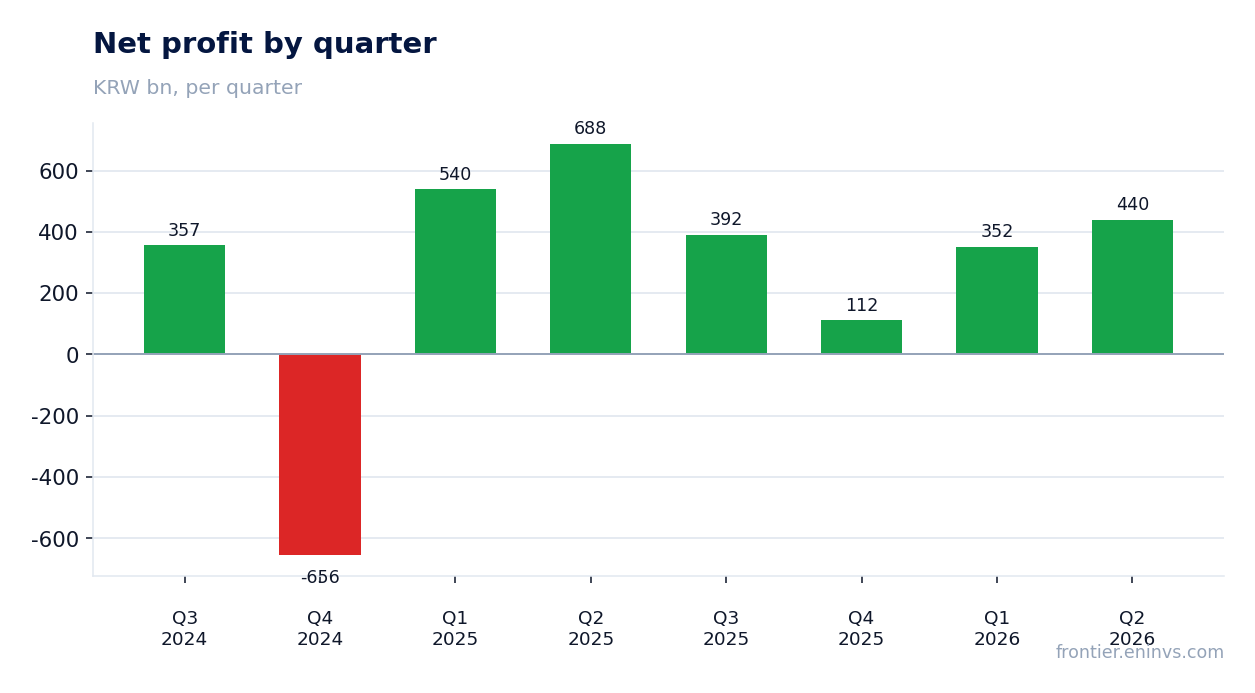
Net profit fell 36.0% to KRW 440,083 million, driven by lower operating profit
Net profit in Q2 2026 was KRW 440,083 million, down 36.0% from a year earlier. Operating profit for the quarter was KRW 648,315 million, 36.1% lower than in Q2 2025, when it stood at KRW 1,014,818 million.
The decline in operating profit is the main driver of lower net profit. Over the last twelve months, net profit was KRW 1,295,588 million, down 12.6% from the previous four quarters.
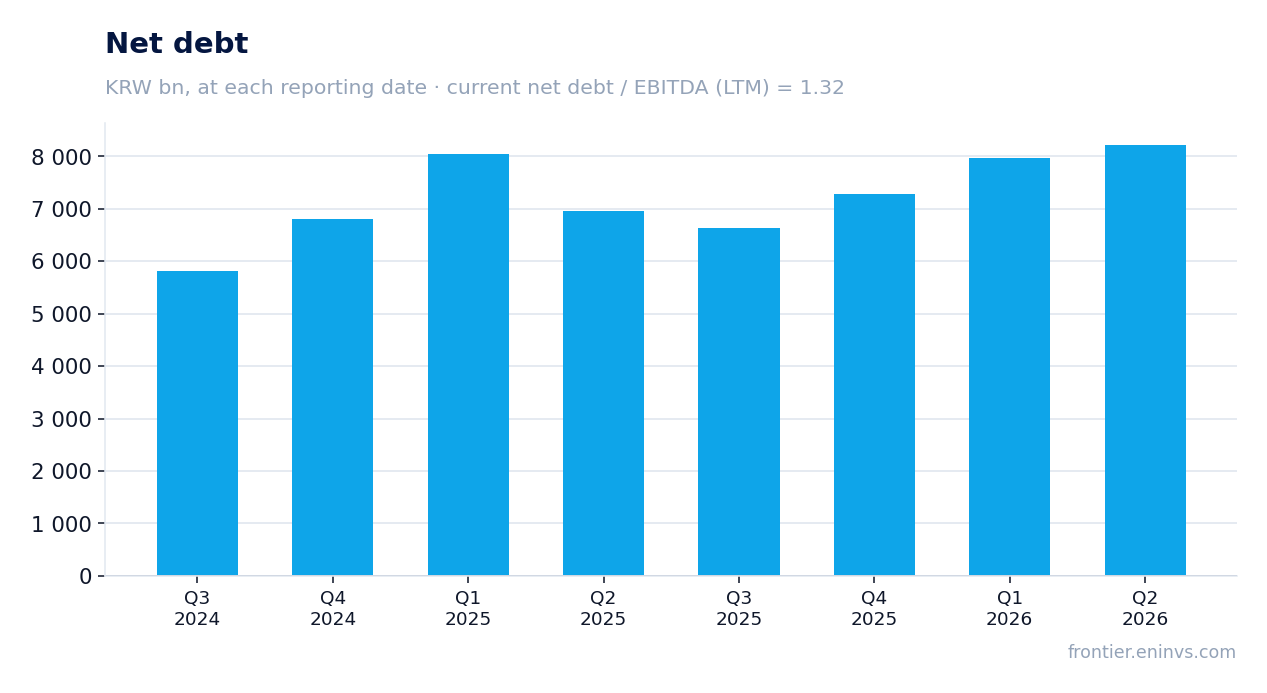
Debt rose by KRW 244.5 billion over the quarter and by KRW 1,265.2 billion over 12 months, to KRW 7,278,601 million
Net debt at the end of Q2 2026 was KRW 7,278,601 million, up KRW 244.5 billion from the previous reporting date and KRW 1,265.2 billion over the last 12 months. Debt is rising amid deteriorating operating results.
The net debt to EBITDA ratio for the last twelve months is 1.32 – a moderate level, but it does not reflect the trend: debt is rising while EBITDA is falling. The company continues to increase borrowings, adding pressure on cash flow.
Operating cash flow in Q2 2026 was KRW 1,521,480 million, covering capital expenditure of KRW 178,048 million
Operating cash flow in Q2 2026 reached KRW 1,521,480 million, significantly higher than in the previous quarter (KRW 650,144 million) and a year earlier (KRW 2,056,039 million). Capital expenditure was only KRW 178,048 million, allowing free cash flow of about KRW 1,343,432 million.
Over the last twelve months, operating cash flow was KRW 4,941,700 million, up 10.2% from the previous four quarters. This provides resources for debt service and dividend payments, but if the current revenue and EBITDA trend persists, cash flow sustainability may weaken.
Trailing twelve-month dividend yield is 4.5%, above the key rate, but payments are at risk due to falling profit
Over the last twelve months, KT Corporation paid dividends with a yield of 4.5% at the current price. This is above the key rate, making the stock attractive for income investors, but the 36% drop in net profit in Q2 raises questions about maintaining payments at the previous level.
Our dividend forecast for the current year is based on the payout ratio and profit base, but due to falling profit and rising debt, the company may cut payments. If profit continues to decline, the dividend yield could fall below the current 4.5%.
EV/EBITDA multiple of 3.6 is above its own three-year average of 3.3, and the portal's model implies 78% downside
The current EV/EBITDA multiple is 3.6, above its own three-year average of 3.3. This means the stock trades at a premium to its historical valuation despite deteriorating operating performance.
According to the portal's model, the share's downside potential is -78% from the current price. This is the portal's own calculation based on EBITDA growth and target multiple, and it indicates significant overvaluation. P/E for the last twelve months is 9.78, which also does not look cheap given current profit dynamics.
Valuation on the latest reported figures
| Metric | Value |
|---|---|
| Market cap | 12 671 bn KRW |
| P/E (LTM) | 9.8 |
| EV/EBITDA (LTM) | 3.6 |
| P/B | 0.65 |
| Net debt / EBITDA (LTM) | 1.32 |
| Operating cash flow (LTM) | 4 942 bn |
| ROE | 8.7% |
| Dividend yield (12m) | 4.5% |
| EV/EBITDA, 3-year average | 3.3 |
Bottom line
In Q2 2026, KT Corporation delivered weak results: revenue fell 10.1%, EBITDA dropped 20.3%, and net profit declined 36.0%. Operating cash flow remained strong and covered capital expenditure, but rising debt and margin compression point to deteriorating financial health. The 4.5% dividend yield looks attractive but is at risk due to falling profit. Given the multiple above its own three-year average and the portal's model implying 78% downside, the verdict is unattractive.
Open the company's financial profile 030200 →
See also: market overview · valuation map · stock screeners