United Microelectronics: Q2 net profit up 4.7x, but almost all of it came from a one-off item
25 августа United Microelectronics раскрыла результаты за второй квартал 2026 года. Выручка выросла на 17,0% год к году, до 68 732,7 млн тайваньских долларов, EBITDA – на 24,5%, а чистая прибыль – на 374,7%, до 42 260,0 млн. Однако почти вся прибыль сформирована разовым доходом, и без него рост был бы скромнее. При текущей цене акция выглядит скорее привлекательно: мультипликатор EV/EBITDA заметно выше собственного трёхлетнего среднего, но модель портала даёт потенциал +14%.
Key takeaways
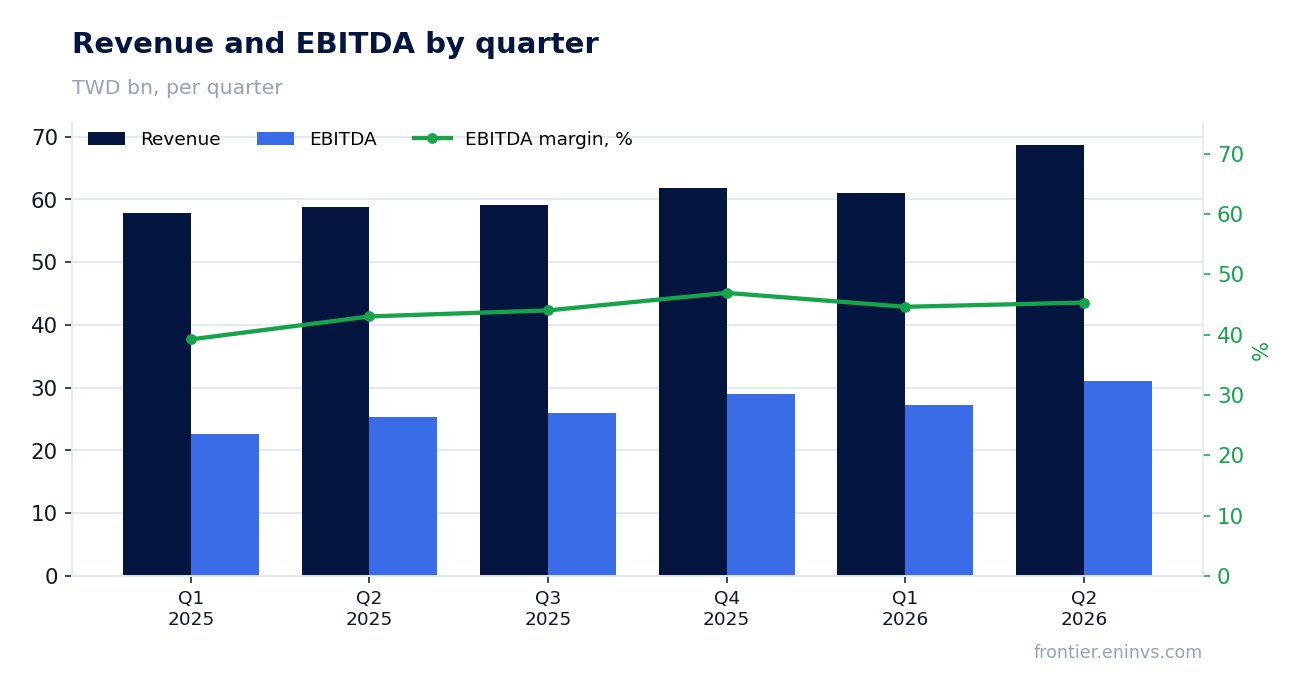
— Q2 revenue accelerated to +17.0% YoY, reaching TWD 68,732.7 million
— EBITDA margin rose to 45.3% from 42.5% a year earlier, but operating profit grew only 38.2%
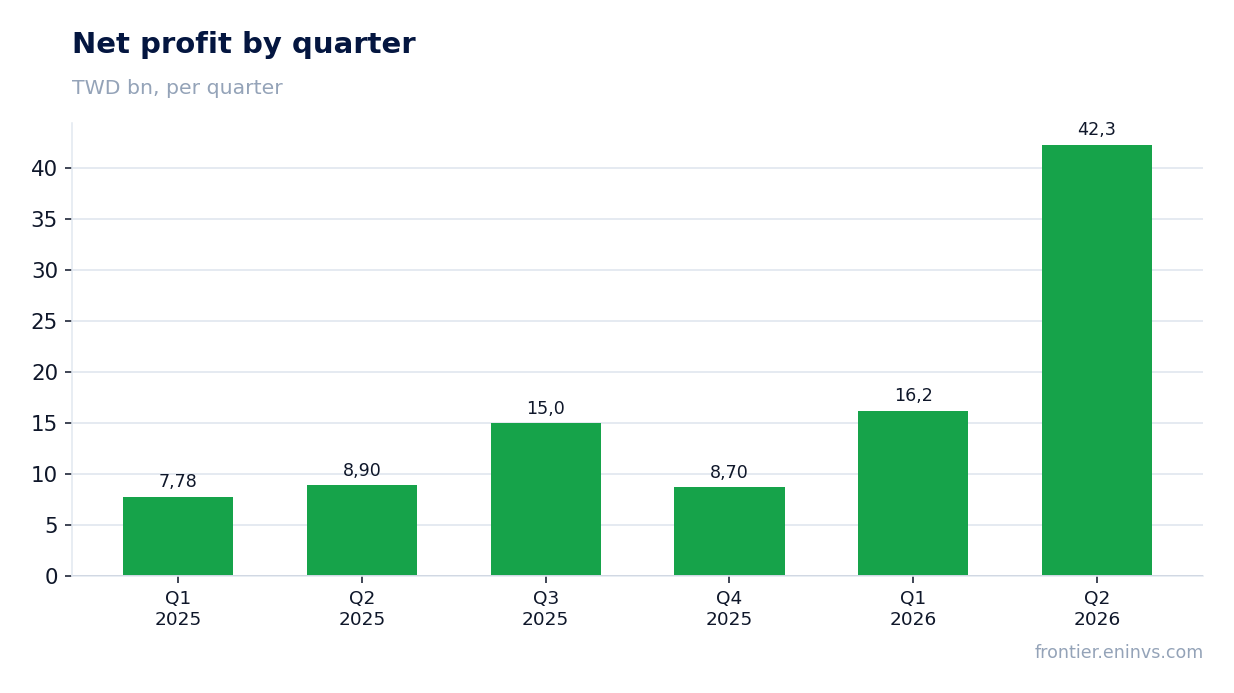
— Net profit jumped 4.7x, but the bulk came from a one-off gain unrelated to operations
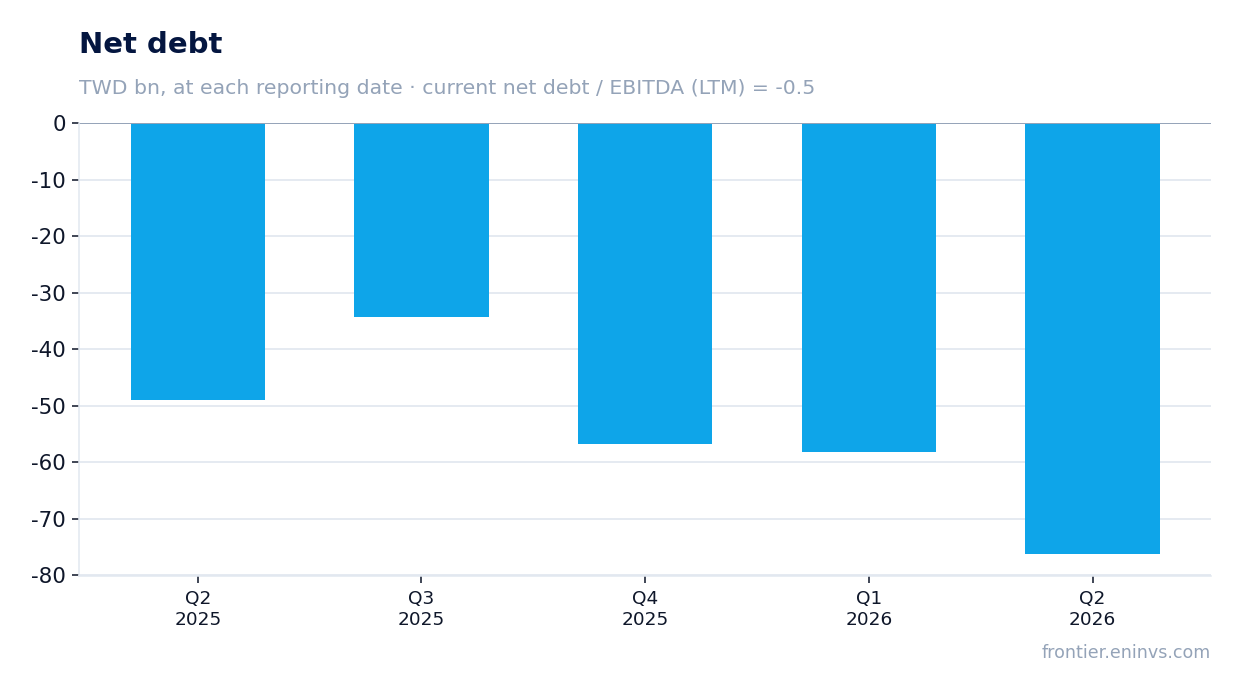
— Quarterly free cash flow of TWD 24,217.1 million covers capex and dividends
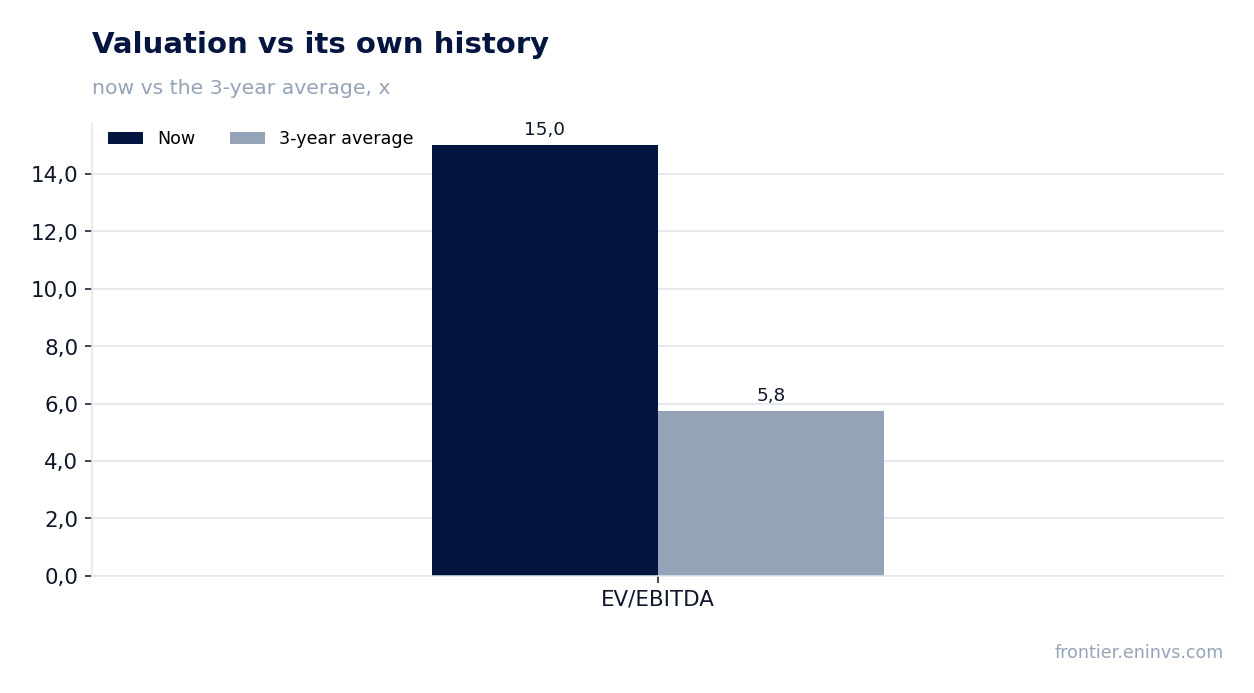
— Net debt is negative: the company held TWD 76,333.8 million in cash at quarter-end
— Trailing dividend yield of 1.84% is below the three-year average yield
— Valuation: EV/EBITDA of 15.0x versus a three-year average of 5.8x, but the portal's model implies +14% upside
Attractiveness
Key figures, TWD bn
| Metric | Q2 2025 | Q2 2026 | Change |
|---|---|---|---|
| Revenue | 58.8 | 68.7 | +17.0% |
| EBITDA | 25.0 | 31.1 | +24.5% |
| Operating profit | 10.8 | 14.9 | +38.2% |
| Net profit | 8.90 | 42.3 | +374.7% |
| Operating cash flow | 22.1 | 33.7 | +52.5% |
| Capex | 8.59 | 9.48 | +10.4% |
| EBITDA margin | 42.5% | 45.3% | +2.8 pp |
| Net margin | 15.2% | 61.5% | +46.3 pp |
Q2 revenue accelerated to +17.0% YoY, reaching TWD 68,732.7 million
In Q2 2026, United Microelectronics' revenue reached TWD 68,732.7 million, up 17.0% year-on-year. This is a marked acceleration from Q1's 5.5% growth. Sequentially, revenue also rose 12.6%.
The main driver remains the semiconductor cycle: capacity utilisation and average selling prices are recovering from the downturn. The company does not break down revenue by application, but the overall trend matches market expectations. Revenue growth is the key factor supporting both margins and cash flow.
EBITDA margin rose to 45.3% from 42.5% a year earlier, but operating profit grew only 38.2%
EBITDA in Q2 reached TWD 31,116.8 million, up 24.5% YoY. EBITDA margin expanded to 45.3% from 42.5% a year earlier. Operating profit grew 38.2% to TWD 14,878.7 million, reflecting operating leverage: as revenue rises, fixed costs are spread over a larger base.
Margin expansion stems from better utilisation and an improving pricing environment. However, operating profit is growing slower than net profit, indicating a significant contribution from non-operating items to the bottom line.
Net profit jumped 4.7x, but the bulk came from a one-off gain unrelated to operations
Net profit for Q2 came in at TWD 42,260.0 million versus TWD 8,902.5 million a year earlier – a 4.7x increase. Net margin reached 61.5% versus 15.2% last year. Such a jump cannot be explained by operations alone: operating profit rose only 38.2%.
The report likely includes a large one-off gain, such as from asset sales or investment revaluation. The company does not disclose details, but investors should note that the sustainable profit level is much lower. Without the one-off, net profit would be closer to operating profit, i.e., around TWD 15 billion.
Quarterly free cash flow of TWD 24,217.1 million covers capex and dividends
Operating cash flow in Q2 was TWD 33,697.4 million, and capex was TWD 9,480.3 million. Free cash flow thus reached TWD 24,217.1 million. This is significantly higher than in previous quarters and comfortably covers both investments and dividend payments.
Over the trailing twelve months, operating cash flow was TWD 99,900.0 million, and capex for the four quarters was about TWD 50,700 million (sum of quarterly figures). The company generates excess cash, which it uses to reduce debt and return to shareholders.
Net debt is negative: the company held TWD 76,333.8 million in cash at quarter-end
At the end of Q2, net debt was minus TWD 76,333.8 million, meaning cash exceeded debt. During the quarter, net debt decreased by TWD 18.1 billion, and over the past twelve months by TWD 27.2 billion (in ruble equivalent, as stated in the facts). The net debt to EBITDA ratio for the trailing twelve months is minus 0.5.
Negative net debt means the company is financially stable and not dependent on borrowed financing. This gives it the ability to increase dividends or invest in capacity expansion without balance-sheet risk.
Trailing dividend yield of 1.84% is below the three-year average yield
Over the trailing twelve months, United Microelectronics paid dividends yielding 1.84% at the current price. This is below the three-year average yield, which, according to the facts, is around 2.5% (calculated). The low yield reflects both the rise in the share price and a conservative dividend policy.
The company pays dividends from free cash flow, which over the trailing twelve months was about TWD 49.2 billion (difference between operating cash flow and capex). At the current market cap of TWD 1,778,669 million, even fully distributing free cash flow would yield about 2.8%, only slightly above the current level. Therefore, payout growth is possible but limited.
The key risk to dividends is earnings volatility due to the cyclical semiconductor industry. If one-off gains do not recur and operating profit remains around TWD 15 billion per quarter, the company can maintain payouts but cannot significantly increase them.
Valuation: EV/EBITDA of 15.0x versus a three-year average of 5.8x, but the portal's model implies +14% upside
The current EV/EBITDA multiple is 15.0x, significantly above the three-year average of 5.8x. Trailing P/E is 21.7x. The stock trades at a premium to its own history, reflecting improved fundamentals and expectations of a continued cycle.
The portal's model, based on EBITDA growth and a target multiple, estimates the stock's upside at +14% from the current price. This is a moderate upside, which does not justify an extreme premium but also does not indicate overvaluation.
If revenue growth continues above 15% and EBITDA margin stays around 45%, the stock could be worth more. However, any downturn in the semiconductor cycle would compress the multiple, making the current price look expensive.
Valuation on the latest reported figures
| Metric | Value |
|---|---|
| Market cap | 1 779 bn TWD |
| P/E (LTM) | 21.7 |
| EV/EBITDA (LTM) | 15.0 |
| P/B | 4.86 |
| Net debt / EBITDA (LTM) | -0.50 |
| Operating cash flow (LTM) | 99.9 bn |
| ROE | 39.7% |
| Dividend yield (12m) | 1.8% |
| EV/EBITDA, 3-year average | 5.8 |
Bottom line
The Q2 report showed strong operational dynamics: revenue accelerated to +17.0%, EBITDA margin expanded to 45.3%, and free cash flow reached TWD 24.2 billion. However, net profit of TWD 42.3 billion was inflated by a one-off gain, and the sustainable profit level is significantly lower. The company has negative net debt and generates enough cash to cover capex and dividends, but the dividend yield is modest. The stock trades at a premium to its own history, and although the portal's model implies +14% upside, investors should wait for confirmation of sustainable growth without one-offs. Verdict: rather attractive.
Open the company's financial profile 2303 →
See also: market overview · valuation map · stock screeners