TSMC: quarterly revenue up 36%, profit up 77%, but shares already pricey
On August 25, TSMC reported Q2 2026 results: revenue up 36.0% YoY, net profit up 77.4%, and EBITDA margin at 76.0%. Despite this momentum, shares trade at an EV/EBITDA multiple of 19.4 versus a three-year average of 14.0, making the stock rather attractive but not a clear bargain.
Key takeaways
— Q2 2026 revenue grew 36.0% YoY to TWD 1,270,380 million
— Net profit for the quarter rose 77.4% thanks to operating leverage and margin expansion
— EBITDA margin reached 76.0% versus 69.8% a year earlier, reflecting improved cost structure
— Operating cash flow for the quarter was TWD 783,365 million, funding capex without increasing debt
— Net debt is negative at TWD -2,102,545 million, providing a cushion for investments and dividends
— Trailing dividend yield is 0.89%, below the key rate, but the company is growing faster
— The portal's model implies +22% upside, making the stock attractive on a one-year horizon
Attractiveness
Key figures, TWD bn
| Metric | Q2 2025 | Q2 2026 | Change |
|---|---|---|---|
| Revenue | 934 | 1 270 | +36.0% |
| EBITDA | 651 | 965 | +48.1% |
| Operating profit | 463 | 767 | +65.4% |
| Net profit | 398 | 707 | +77.4% |
| Operating cash flow | 497 | 783 | +57.6% |
| Capex | 297 | 508 | +71.0% |
| EBITDA margin | 69.8% | 76.0% | +6.2 pp |
| Net margin | 42.7% | 55.6% | +12.9 pp |
Q2 2026 revenue grew 36.0% YoY to TWD 1,270,380 million
In Q2 2026, TSMC reported revenue of TWD 1,270,380 million, up 36.0% from the same quarter a year earlier. This continues the acceleration: Q1 2026 growth was 35.1%.
The main driver remains demand for advanced nodes used in AI and high-performance computing. The company is expanding capacity, which is also reflected in rising capital expenditures.
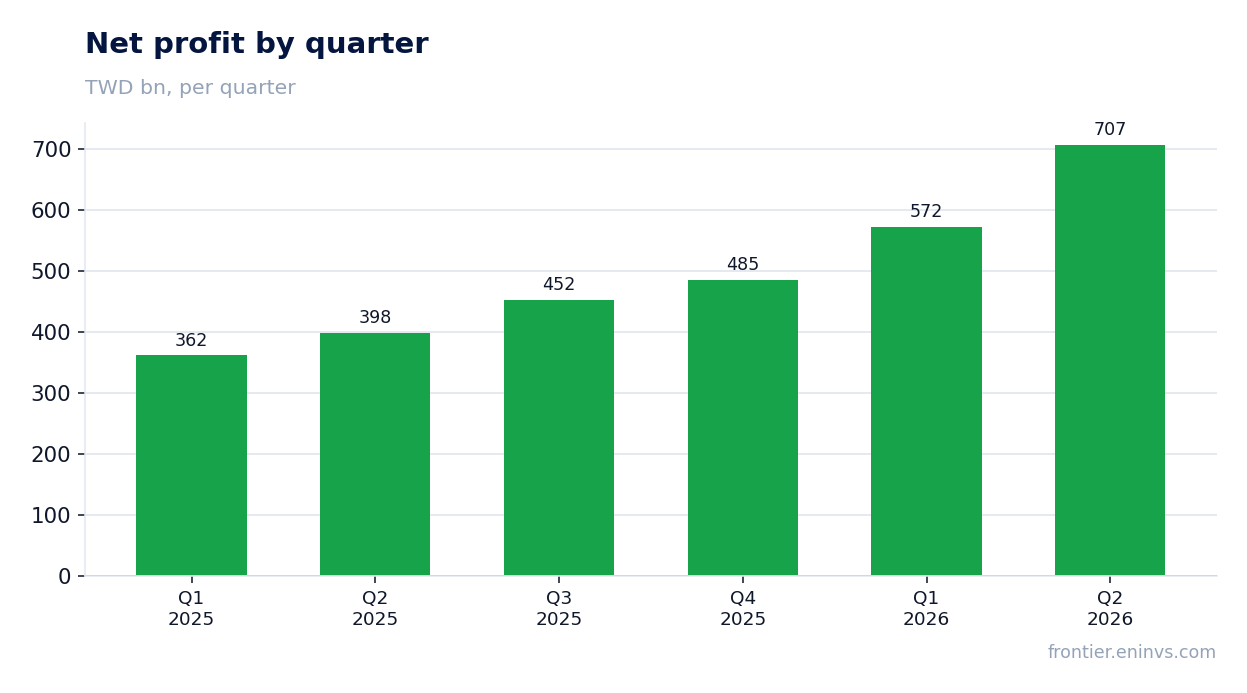
Net profit for the quarter rose 77.4% thanks to operating leverage and margin expansion
Net profit in Q2 2026 reached TWD 706,562 million, up 77.4% from a year earlier. Profit growth significantly outpaced revenue, indicating high operating leverage.
Net margin rose to 55.6% from 42.7% a year earlier. This reflects both volume growth and improved cost structure, including economies of scale on new nodes.
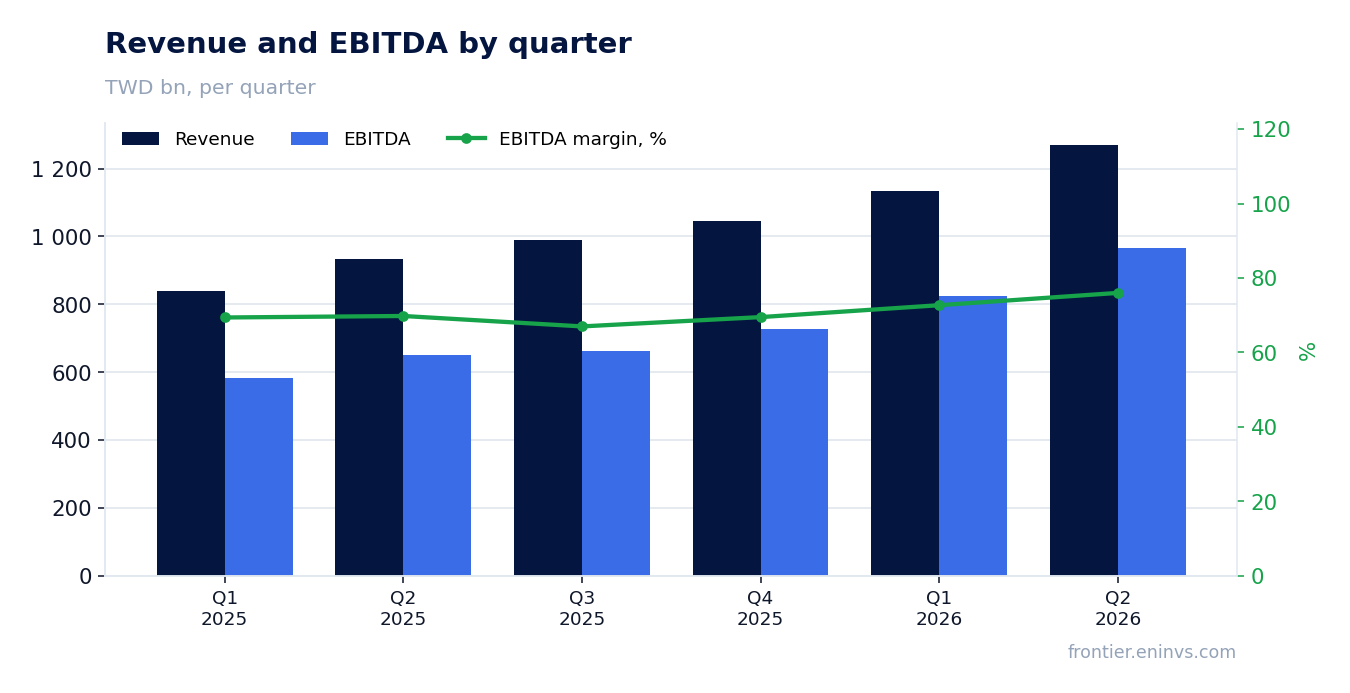
EBITDA margin reached 76.0% versus 69.8% a year earlier, reflecting improved cost structure
EBITDA for the quarter grew 48.1% YoY, and EBITDA margin reached 76.0% versus 69.8% in Q2 2025. The 6.2 percentage point margin expansion stems from operating leverage and cost control.
Such high profitability is typical for a semiconductor leader, but it also reflects favorable pricing for advanced nodes. Going forward, margin may stabilize as competition and capex increase.
Operating cash flow for the quarter was TWD 783,365 million, funding capex without increasing debt
In Q2 2026, operating cash flow reached TWD 783,365 million, while capital expenditures were TWD 508,395 million. Thus, the company fully covers its investment program from operating cash flow.
Free cash flow after capex remains positive, allowing capacity expansion and dividend payments. Over the last twelve months, operating cash flow totaled TWD 2,275,000 million.
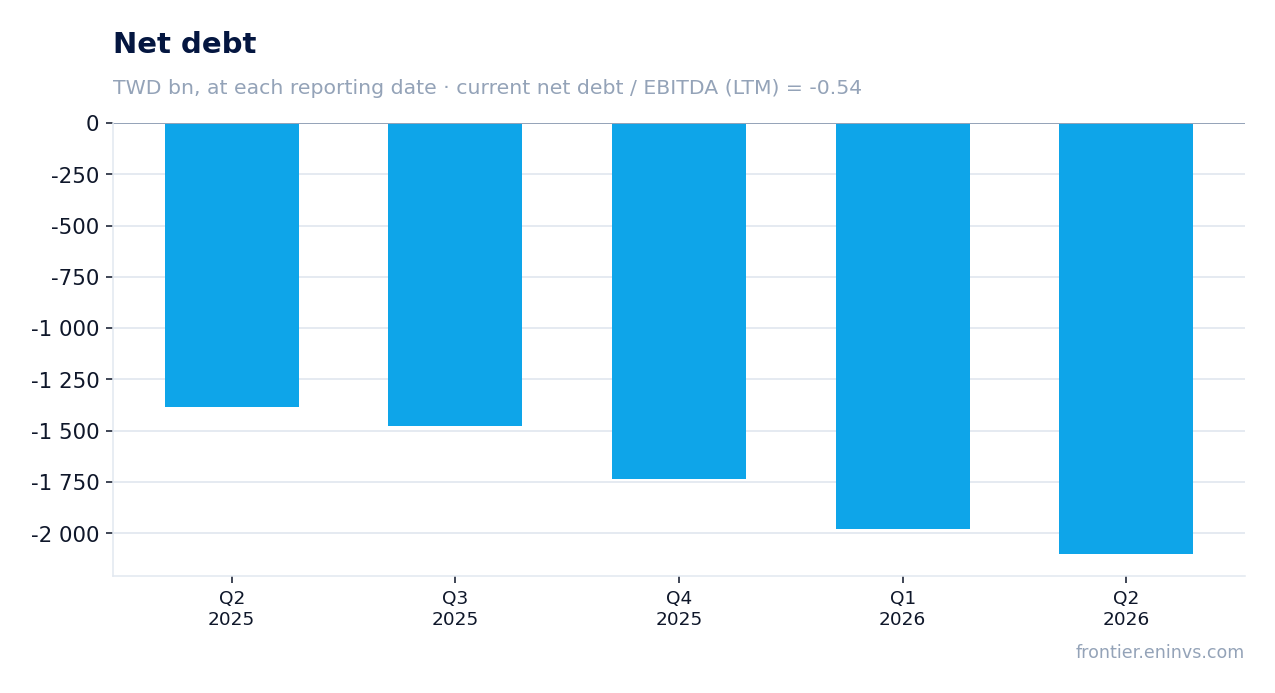
Net debt is negative at TWD -2,102,545 million, providing a cushion for investments and dividends
At the end of Q2 2026, TSMC's net debt stood at TWD -2,102,545 million, meaning a net cash position. Net debt to EBITDA for the last twelve months is -0.54.
During the quarter, net debt decreased by RUB 124.2 billion in ruble terms, and by RUB 715.9 billion over twelve months. This strengthens the balance sheet and provides resources for the ambitious capex program.
Trailing dividend yield is 0.89%, below the key rate, but the company is growing faster
Over the last twelve months, TSMC paid dividends yielding 0.89% of current market cap. This is below the key rate, but the company reinvests a large portion of profits, driving double-digit revenue and profit growth.
We expect dividends to continue growing this year, but at a moderate pace due to high capex needs. The key factor is sustaining profitability and cash flow.
The portal's model implies +22% upside, making the stock attractive on a one-year horizon
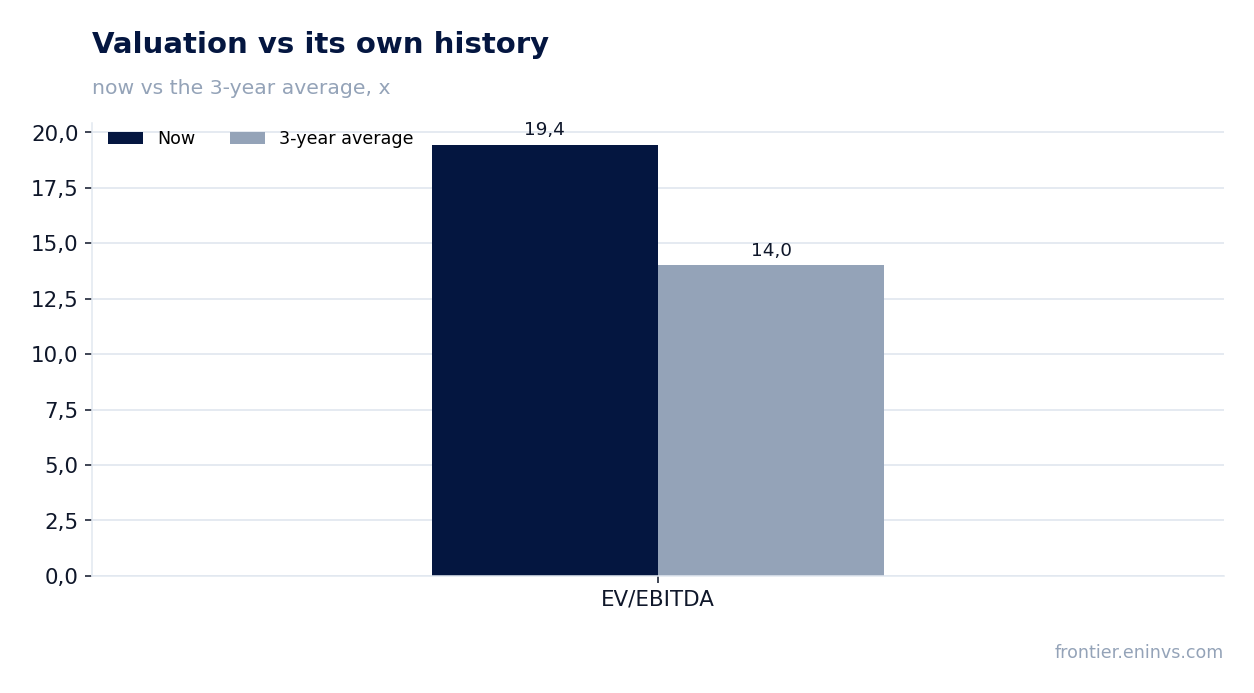
Our valuation model, based on EBITDA growth and target multiple, implies +22% upside for TSMC shares from the current price. This exceeds the historical average gap between price and fair value.
The current EV/EBITDA multiple is 19.4 versus the three-year average of 14.0. The premium is justified by accelerating growth and high profitability, but investors are paying for expectations already partly priced in.
Valuation on the latest reported figures
| Metric | Value |
|---|---|
| Market cap | 63 923 bn TWD |
| P/E (LTM) | 28.8 |
| EV/EBITDA (LTM) | 19.4 |
| P/B | 11.94 |
| Net debt / EBITDA (LTM) | -0.54 |
| Operating cash flow (LTM) | 2 275 bn |
| ROE | 45.9% |
| Dividend yield (12m) | 0.9% |
| EV/EBITDA, 3-year average | 14.0 |
Bottom line
TSMC continues to deliver impressive growth: Q2 revenue up 36% and net profit up 77%, confirming strong operating leverage. The company generates robust cash flow, fully covering capex, and has negative net debt, providing financial flexibility. However, shares trade at a premium to their own history, and dividend yield is modest. Our verdict is 'rather attractive': the portal model's upside (+22%) and strong fundamentals outweigh, but investors should monitor sustained growth and margins.
Open the company's financial profile 2330 →
See also: market overview · valuation map · stock screeners