Nanya Technology: quarterly revenue up 684%, and debt turned into a huge net cash position
25 августа Nanya Technology раскрыла результаты за второй квартал 2026 года: выручка выросла на 684,2% год к году, до 82 549 млн тайваньских долларов, чистая прибыль составила 50 192 млн, а рентабельность по EBITDA достигла 79,2%. На фоне этих цифр акции выглядят привлекательно: мультипликатор EV/EBITDA за последние 12 месяцев составляет 13,8, а по модели портала потенциал роста — 70%.
Key takeaways
— Revenue in Q2 2026 grew 684.2% year-on-year to TWD 82,549 million, driven by memory market recovery
— EBITDA margin reached 79.2% versus negative a year ago, reflecting operating leverage as capacity utilization improved
— Net profit for the quarter was TWD 50,192 million, resulting in a net margin of 60.8%
— Operating cash flow in Q2 2026 reached TWD 55,859 million, funding capex and boosting net cash
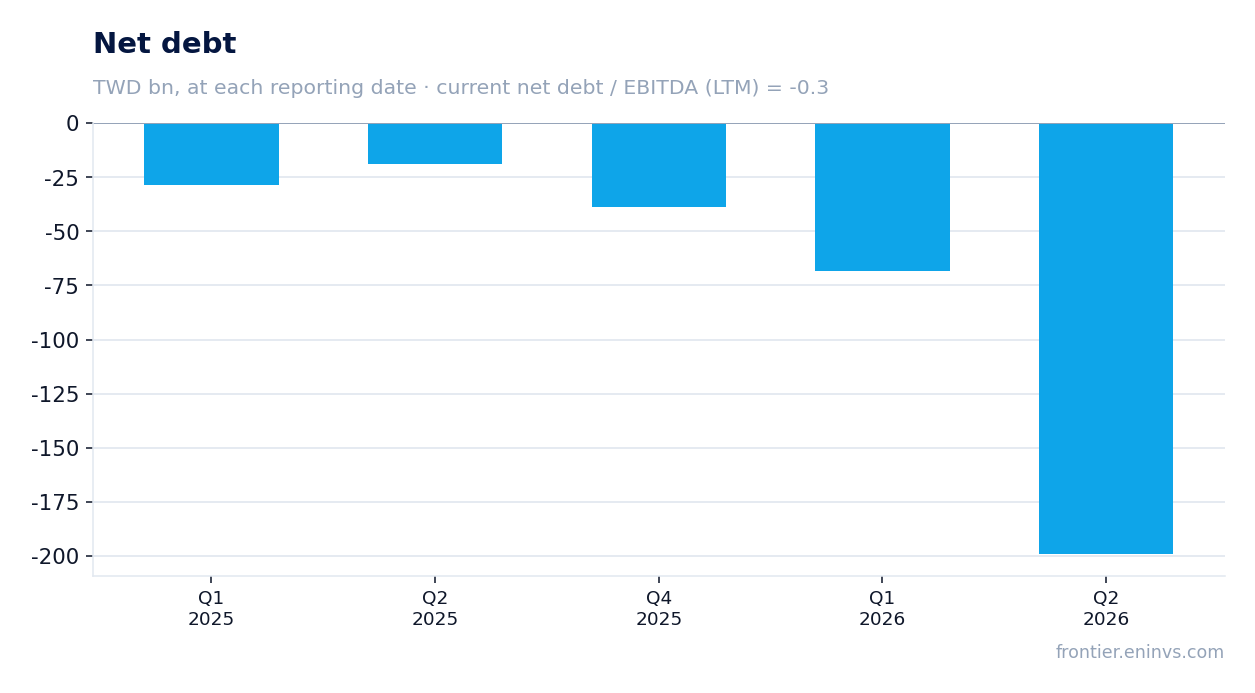
— Net debt turned into a net cash position of TWD 199,206 million, equivalent to 0.3 times annual EBITDA
— Trailing dividend yield is only 0.26%, below the key rate, but the company could increase payouts if profitability holds
— On the portal's model, the stock has 70% upside from the current price
Attractiveness
Key figures, TWD bn
| Metric | Q2 2025 | Q2 2026 | Change |
|---|---|---|---|
| Revenue | 10.5 | 82.5 | +684.2% |
| EBITDA | -1.19 | 65.4 | to profit |
| Operating profit | -4.50 | 60.8 | to profit |
| Net profit | -4.10 | 50.2 | to profit |
| Operating cash flow | -0.88 | 55.9 | to profit |
| Capex | 3.03 | 4.05 | +33.8% |
| EBITDA margin | -11.3% | 79.2% | +90.5 pp |
| Net margin | -39.0% | 60.8% | +99.8 pp |
Revenue in Q2 2026 grew 684.2% year-on-year to TWD 82,549 million, driven by memory market recovery
In Q2 2026, Nanya Technology reported revenue of TWD 82,549 million, up 684.2% year-on-year. This is the fourth consecutive quarter of acceleration: in Q1 2026 growth was 582.9% year-on-year, and in Q4 2025 revenue was TWD 30,094 million. Sequentially, revenue almost doubled from Q1 2026's TWD 49,087 million.
The main driver is the memory market recovery: DRAM prices and demand from data centers and AI have surged. The memory specialist has seen significant operating leverage: with revenue up nearly eight-fold year-on-year, EBITDA swung from negative to TWD 63,784 million in the quarter.
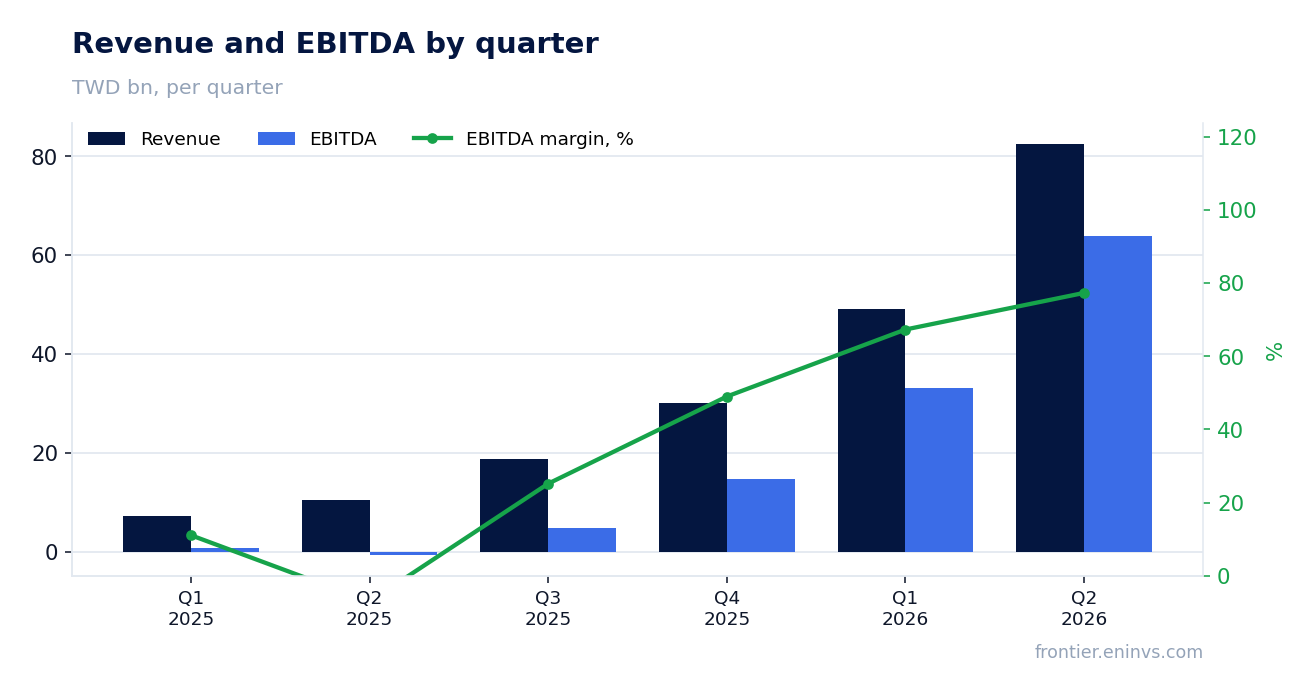
EBITDA margin reached 79.2% versus negative a year ago, reflecting operating leverage as capacity utilization improved
In Q2 2026, EBITDA margin reached 79.2%, versus a negative –11.3% a year earlier. This jump is explained by revenue growing much faster than operating expenses: with nearly eight-fold revenue growth, fixed costs were spread over a larger base.
Operating profit in Q2 2026 reached TWD 60,825 million, implying an operating margin of about 73.7% (calculated). This confirms that the company is operating at high capacity utilization and effectively controlling costs.
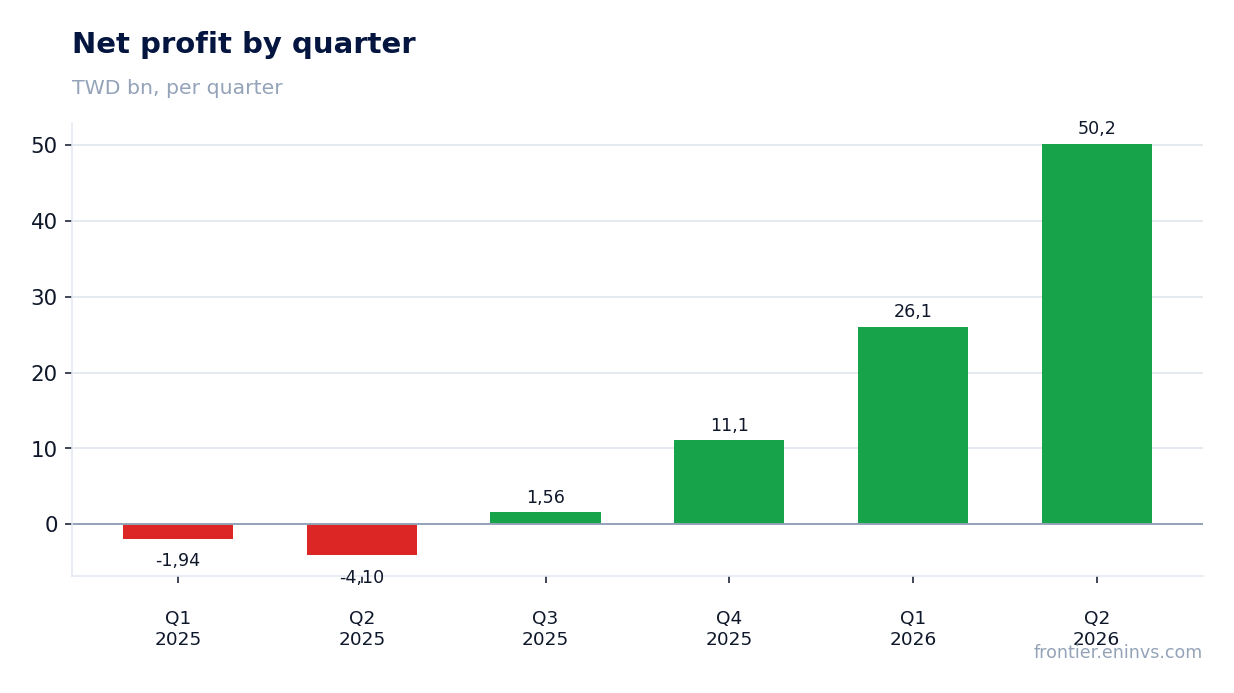
Net profit for the quarter was TWD 50,192 million, resulting in a net margin of 60.8%
Net profit in Q2 2026 was TWD 50,192 million, resulting in a net margin of 60.8%. A year earlier, the company was loss-making with a margin of –39.0%. The main driver was operating profit growth, which almost fully translated into net profit due to negligible tax and interest expenses.
Over the trailing twelve months, net profit was TWD 88,908 million, giving a P/E of 20.3 based on the current market cap of TWD 1,804,460 million. This is a moderate level for a company with such growth rates.
Operating cash flow in Q2 2026 reached TWD 55,859 million, funding capex and boosting net cash
Operating cash flow (OCF) in Q2 2026 was TWD 55,859 million, well above capex of TWD 4,048 million. Thus, free cash flow for the quarter was about TWD 51,811 million (calculated). The company generates significantly more cash than it spends on maintaining capacity.
Over the trailing twelve months, operating cash flow was TWD 18,600 million, notably lower than the quarterly figure due to a weak start to the period. Nevertheless, the accumulated net cash position on the balance sheet reached TWD 199,206 million, equivalent to 0.3 times annual EBITDA (LTM). This gives the company enormous financial flexibility.
Net debt turned into a net cash position of TWD 199,206 million, equivalent to 0.3 times annual EBITDA
At the end of Q2 2026, the company's net cash position was TWD 199,206 million. This means cash and equivalents significantly exceed debt. A year earlier, in Q2 2025, the net cash position was only TWD 19,108 million, and in Q1 2026 it was TWD 68,485 million.
Net debt to EBITDA for the trailing twelve months is –0.3, reflecting a net cash position. The company has no debt burden problem and can direct cash flows to development and dividends.
Trailing dividend yield is only 0.26%, below the key rate, but the company could increase payouts if profitability holds
Over the trailing twelve months, Nanya Technology paid dividends corresponding to a yield of 0.26% on the current market cap. This is very low, especially compared to the key rate, which is significantly higher. However, the company historically pays dividends from profit, and after two loss-making years, payouts were minimal.
If current profitability and net cash position are maintained, the company could increase dividends. Assuming the payout ratio returns to historical levels (e.g., 50–70% of net profit), the dividend yield could rise substantially. However, this depends on the board's decision and capital expenditure needs for capacity expansion.
On the portal's model, the stock has 70% upside from the current price
Our value-creation model, based on EBITDA growth and target multiple, shows that Nanya Technology shares have 70% upside from the current price. This means the market has not fully priced in the scale of the company's profitability recovery.
The current EV/EBITDA multiple for the trailing twelve months is 13.8, which does not look stretched for a company with such growth rates. P/E of 20.3 is also moderate. If the company maintains high profitability, the shares have significant potential.
Valuation on the latest reported figures
| Metric | Value |
|---|---|
| Market cap | 1 804 bn TWD |
| P/E (LTM) | 20.3 |
| EV/EBITDA (LTM) | 13.8 |
| P/B | 10.59 |
| Net debt / EBITDA (LTM) | -0.30 |
| Operating cash flow (LTM) | 18.6 bn |
| ROE | 77.9% |
| Dividend yield (12m) | 0.3% |
Bottom line
The Q2 2026 report shows an impressive recovery: revenue grew 684% year-on-year, EBITDA margin reached 79.2%, and net cash exceeded TWD 199 billion. However, such growth partly reflects a low base effect after a loss-making 2025, and sustaining it will be challenging. The key question for shareholders is the sustainability of memory prices and the company's ability to convert high profits into dividends. At current multiples and with the portal's model upside, the shares look attractive.
Open the company's financial profile 2408 →
See also: market overview · valuation map · stock screeners