ASE Technology: Q2 2026 profit up 180%, but the key question is whether cash will cover dividends and capex
25 августа ASE Technology раскрыла результаты за второй квартал 2026 года: выручка выросла на 26,7% год к году, до 191 064 млн TWD, EBITDA – на 52,4%, а чистая прибыль – на 180,1%. Рентабельность по EBITDA достигла 21,5% против 17,9% годом ранее, чистая маржа – 11,0% против 5,0%. При текущей цене акция выглядит скорее привлекательно: мультипликатор EV/EBITDA в 2,2 раза выше собственного трёхлетнего среднего, но модель портала даёт потенциал роста на 22%, а дивидендная доходность в 1,03% остаётся ниже ключевой ставки.
Key takeaways
— Revenue in Q2 2026 grew 26.7% YoY to TWD 191,064 million, accelerating from 17.2% in Q1
— EBITDA margin reached 21.5% – the highest in four quarters, helped by a 107% jump in operating profit
— Net profit in Q2 2026 was TWD 21,068 million – 2.8 times higher than a year earlier, driven by operating profit growth and likely one-offs
— Operating cash flow for the quarter was TWD 47,014 million, but capex rose to TWD 79,849 million, resulting in negative free cash flow
— Net debt at end-June 2026 was TWD 162,345.5 million, or 1.15x EBITDA for the last twelve months
— Trailing dividend yield is 1.03%, below the key rate, and under pressure from high capex
— The portal's model implies 22% upside, making the stock attractive despite the rich valuation
Attractiveness
Key figures, TWD bn
| Metric | Q2 2025 | Q2 2026 | Change |
|---|---|---|---|
| Revenue | 151 | 191 | +26.7% |
| EBITDA | 27.0 | 41.1 | +52.4% |
| Operating profit | 10.2 | 21.1 | +107.3% |
| Net profit | 7.52 | 21.1 | +180.1% |
| Operating cash flow | 36.8 | 47.0 | +27.6% |
| Capex | 43.1 | 79.8 | +85.2% |
| EBITDA margin | 17.9% | 21.5% | +3.6 pp |
| Net margin | 5.0% | 11.0% | +6.0 pp |
Revenue in Q2 2026 grew 26.7% YoY to TWD 191,064 million, accelerating from 17.2% in Q1
In Q2 2026, ASE Technology's revenue reached TWD 191,064 million, up 26.7% from the same quarter a year earlier. This is a marked acceleration from Q1 2026, when growth was 17.2%.
Sequential dynamics are also positive: revenue rose 10% from Q1 2026 (TWD 173,662 million). The company continues to accelerate, pointing to sustained demand for semiconductor assembly and testing services.
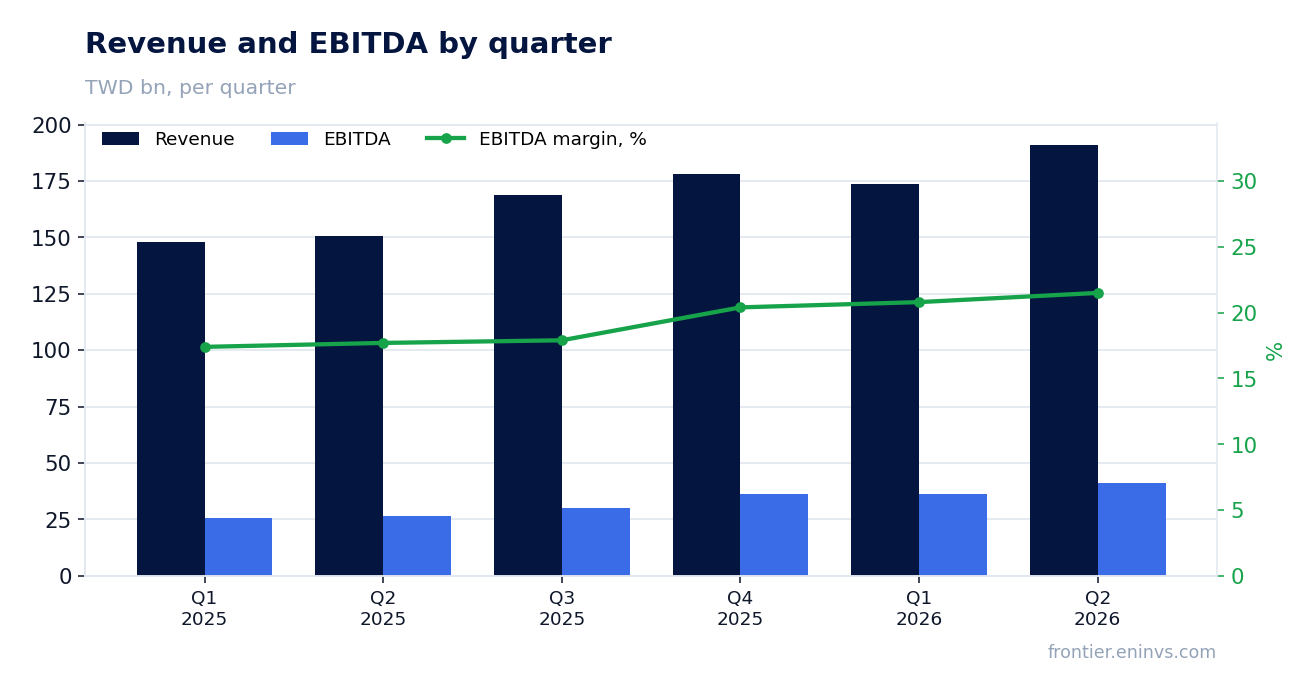
EBITDA margin reached 21.5% – the highest in four quarters, helped by a 107% jump in operating profit
EBITDA in Q2 2026 grew 52.4% YoY to TWD 41,134 million, with EBITDA margin reaching 21.5% versus 17.9% a year earlier. This is the best reading in four quarters: in Q1 2026 the margin was 20.8%, in Q4 2025 – 20.4%.
Operating profit surged 107% YoY to TWD 21,134 million, indicating operating leverage: revenue is growing faster than operating expenses. Margin expansion is the key driver of profit growth.
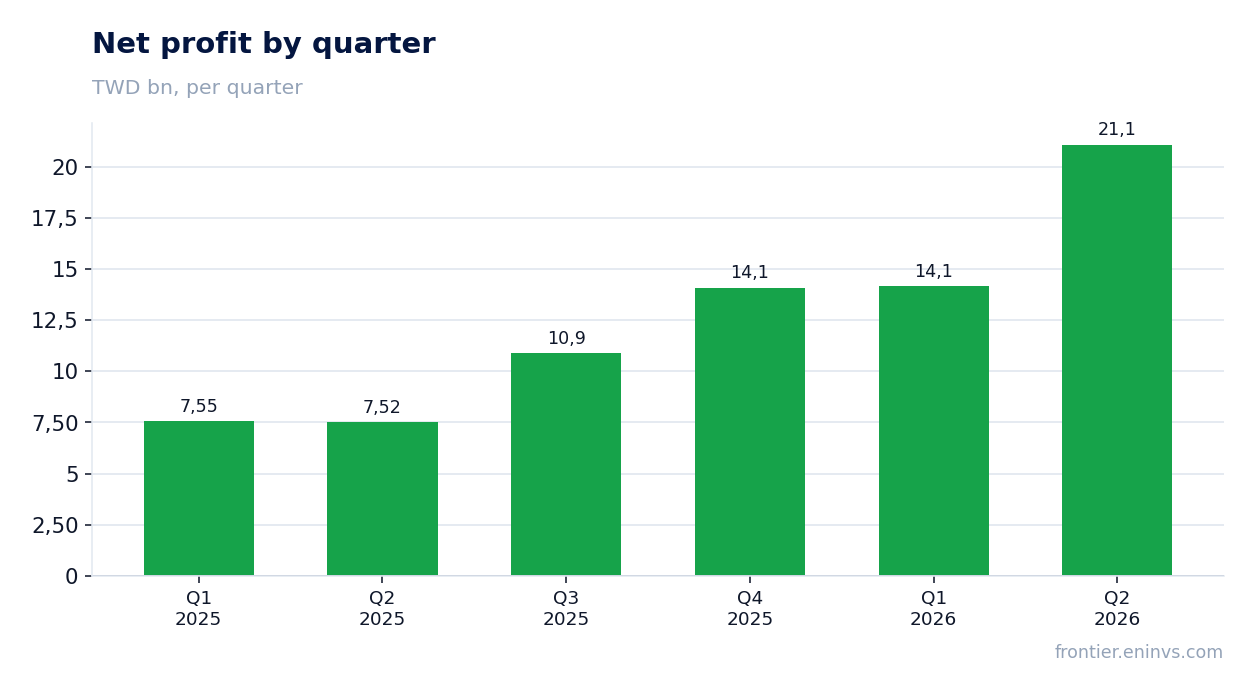
Net profit in Q2 2026 was TWD 21,068 million – 2.8 times higher than a year earlier, driven by operating profit growth and likely one-offs
Net profit for Q2 2026 reached TWD 21,068 million, up 180.1% from the same period a year earlier (TWD 7,521 million). Net margin rose to 11.0% from 5.0%.
Profit growth significantly outpaces operating profit growth, suggesting one-off gains or a lower tax burden. These items are not disclosed in the report, so we cannot name their nature, but investors should note that part of the profit may be non-operating.
Operating cash flow for the quarter was TWD 47,014 million, but capex rose to TWD 79,849 million, resulting in negative free cash flow
In Q2 2026, operating cash flow was TWD 47,014 million, up 28% from a year earlier (TWD 36,845 million). However, capex rose even more – to TWD 79,849 million versus TWD 43,104 million in Q2 2025.
As a result, free cash flow for the quarter was negative: minus TWD 32,835 million. The company is actively investing in capacity expansion, which explains the rise in debt. Over the last twelve months, operating cash flow was TWD 142,200 million, while capex over four quarters was about TWD 212,583 million, meaning a free cash flow deficit persists on an annual basis as well.
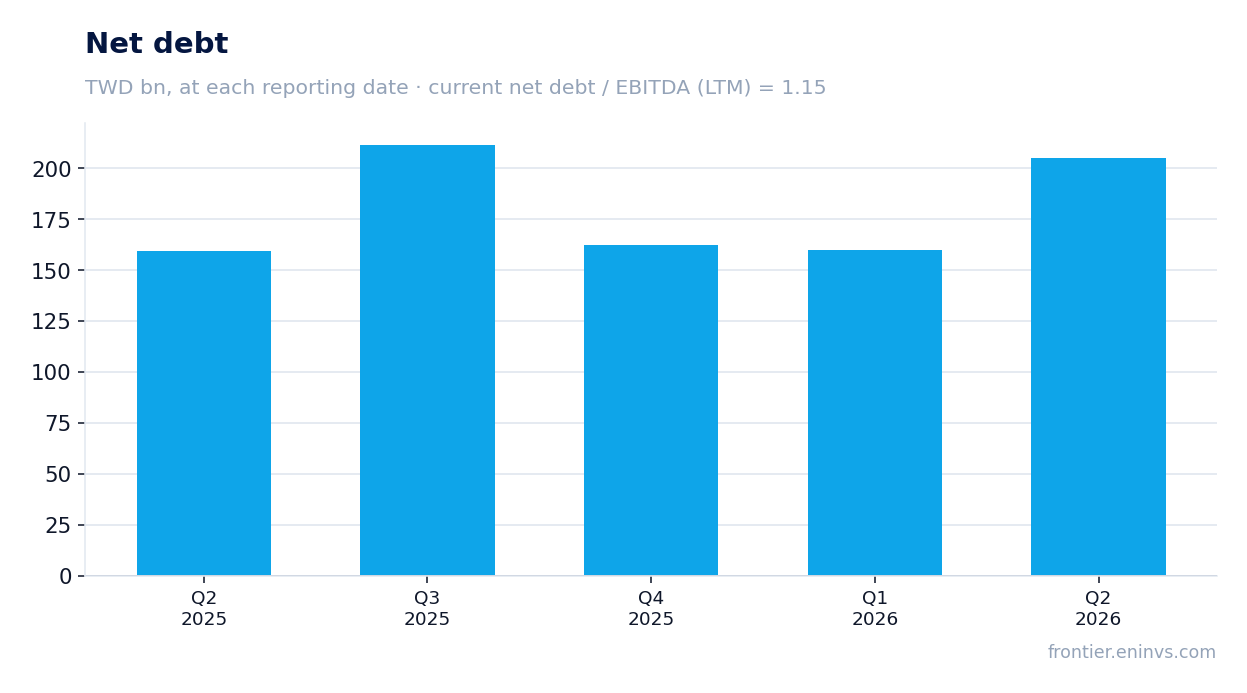
Net debt at end-June 2026 was TWD 162,345.5 million, or 1.15x EBITDA for the last twelve months
At end-June 2026, ASE Technology's net debt stood at TWD 162,345.5 million. The ratio of net debt to EBITDA for the last twelve months is 1.15, a moderate level for a company with heavy capex.
Over the last twelve months, net debt increased by TWD 45.6 billion, reflecting the financing of the investment program. Still, the leverage ratio remains comfortable, and the company retains the ability to service its debt.
Trailing dividend yield is 1.03%, below the key rate, and under pressure from high capex
Over the last twelve months, ASE Technology paid dividends equivalent to 1.03% of the current price. This is well below the key rate, making the stock unattractive for income-oriented investors.
High capex and negative free cash flow call into question the company's ability to maintain or increase dividends. If investments remain at current levels, payouts could be cut. Our dividend forecast for the current year is in line with last year, but it depends on whether the company can generate sufficient cash flow after funding construction.
The portal's model implies 22% upside, making the stock attractive despite the rich valuation
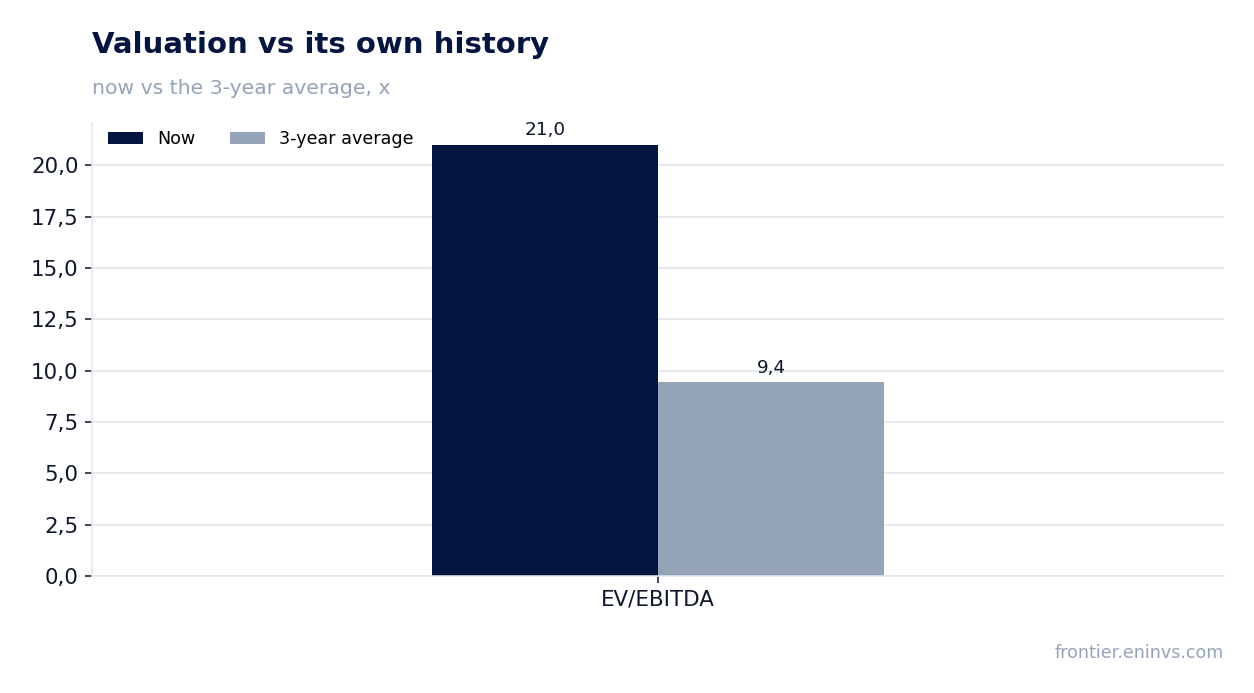
The current EV/EBITDA multiple for the last twelve months is 21.0, more than double its own three-year average of 9.43. P/E LTM is 46.8, ROE is 22.8%.
Despite the rich valuation, the portal's model implies +22% upside. This suggests the market may be underestimating the company's ability to grow EBITDA through operating leverage and revenue growth. If the company continues to deliver such growth rates, the current price may prove justified.
Valuation on the latest reported figures
| Metric | Value |
|---|---|
| Market cap | 2 814 bn TWD |
| P/E (LTM) | 46.8 |
| EV/EBITDA (LTM) | 21.0 |
| P/B | 8.23 |
| Net debt / EBITDA (LTM) | 1.15 |
| Operating cash flow (LTM) | 142 bn |
| ROE | 22.8% |
| Dividend yield (12m) | 1.0% |
| EV/EBITDA, 3-year average | 9.4 |
Bottom line
The Q2 2026 report is strong: revenue accelerated to 26.7%, EBITDA margin reached 21.5%, and net profit grew 2.8 times. However, part of the profit may be one-off, and free cash flow remains negative due to the massive investment program. The dividend yield of 1.03% does not protect against inflation, but the portal's model implies 22% upside, making the stock rather attractive provided current growth rates persist. The key question for holders is whether the company can convert revenue growth into cash flow without increasing leverage.
Open the company's financial profile 3711 →
See also: market overview · valuation map · stock screeners