AIRA: revenue grows, but costs eat profit – H1 2026 in the red
AIRA reported H1 2026 results: revenue rose 16.1% to $763.9 million, but cost growth outpaced revenue, leading to a net loss of $21 million versus a profit a year earlier. The shares look attractive at the current price given the portal model's upside (+9%) and moderate leverage, despite current losses.
Key takeaways
— H1 2026 revenue grew 16.1% driven by a 15.8% RASK increase
— CASK growth of 22.2% eroded operating profit and led to a net loss
— EBITDAR fell 9.7% in H1 2026 due to higher fuel and maintenance costs
— Net debt rose $0.4 billion in the half-year, but Net Debt/EBITDA remains moderate
— Trailing dividend yield is 1.43%, below the key rate
— The portal's model sees +9% upside for the shares
Attractiveness
Key figures, USD bn
| Metric | H1 2025 | H1 2026 | Change |
|---|---|---|---|
| Revenue | 0.66 | 0.43 | -34.2% |
| EBITDA | 0.16 | — | — |
| Operating profit | 0.05 | — | — |
| Net profit | 0.01 | -0.02 | -296.3% |
| Operating cash flow | 0.19 | — | — |
| EBITDA margin | 23.6% | — | — |
| Net margin | 1.6% | -4.9% | -6.5 pp |
H1 2026 revenue grew 16.1% driven by a 15.8% RASK increase
In H1 2026, group revenue and other income reached $763.9 million, up 16.1% year-on-year. The main driver was higher unit revenue: RASK increased 15.8% to 7.43 cents per ASK, while capacity (ASK) was almost flat (+0.2%). The company actively redeployed capacity: China +91%, India +41%, while the Middle East was cut by 35%.
In Q2 2026, momentum accelerated: revenue grew 18.3% to $432.9 million, RASK – 18.5% to 7.78 cents. Both brands contributed: Air Astana revenue rose 24.1%, FlyArystan only 1.5% due to a 16.4% capacity cut.
CASK growth of 22.2% eroded operating profit and led to a net loss
Unit cost (CASK) rose 22.2% to 7.30 cents in H1, outpacing RASK growth. Fuel and handling were the main drivers, accounting for 44% of the cost increase. Operating expenses grew 22.5% to $750 million.
As a result, the group posted a net loss of $21 million for the half-year versus a profit a year earlier. In Q2, the loss was minimal – $0.1 million, versus a profit of $18 million a year ago. Net margin for the half-year was -4.9% versus +1.6% a year earlier.
EBITDAR fell 9.7% in H1 2026 due to higher fuel and maintenance costs
Group EBITDAR for H1 was $141.7 million, down 9.7% year-on-year. EBITDAR margin contracted 5.3 percentage points to 18.6%. Higher fuel prices, labour costs and aircraft maintenance were the main pressures.
FlyArystan was hit hardest: EBITDAR fell 17.2% to $25.6 million due to capacity cuts. Air Astana's EBITDAR declined 7.8% to $110.8 million, partly due to KZT appreciation, which eroded USD-linked margins.
Net debt rose $0.4 billion in the half-year, but Net Debt/EBITDA remains moderate
At end-H1 2026, net debt stood at $61,099.4 million, up $0.4 billion from the previous reporting date and $0.5 billion over the last 12 months. The increase reflects fleet expansion and capital expenditure financing.
Net Debt/EBITDA for the last twelve months is 1.69, well below the company's 3.0x target. Operating cash flow over 12 months reached $128 million, supporting debt service.
Trailing dividend yield is 1.43%, below the key rate
Over the last 12 months, the company paid dividends yielding 1.43% at the current price. This is well below the key rate, making the share unattractive for income-focused investors.
No new dividends were declared in the half-year report. Given the net loss for the period, the likelihood of maintaining or increasing payouts in the coming quarters remains uncertain. Payments will depend on restoring profitability and cash flow.
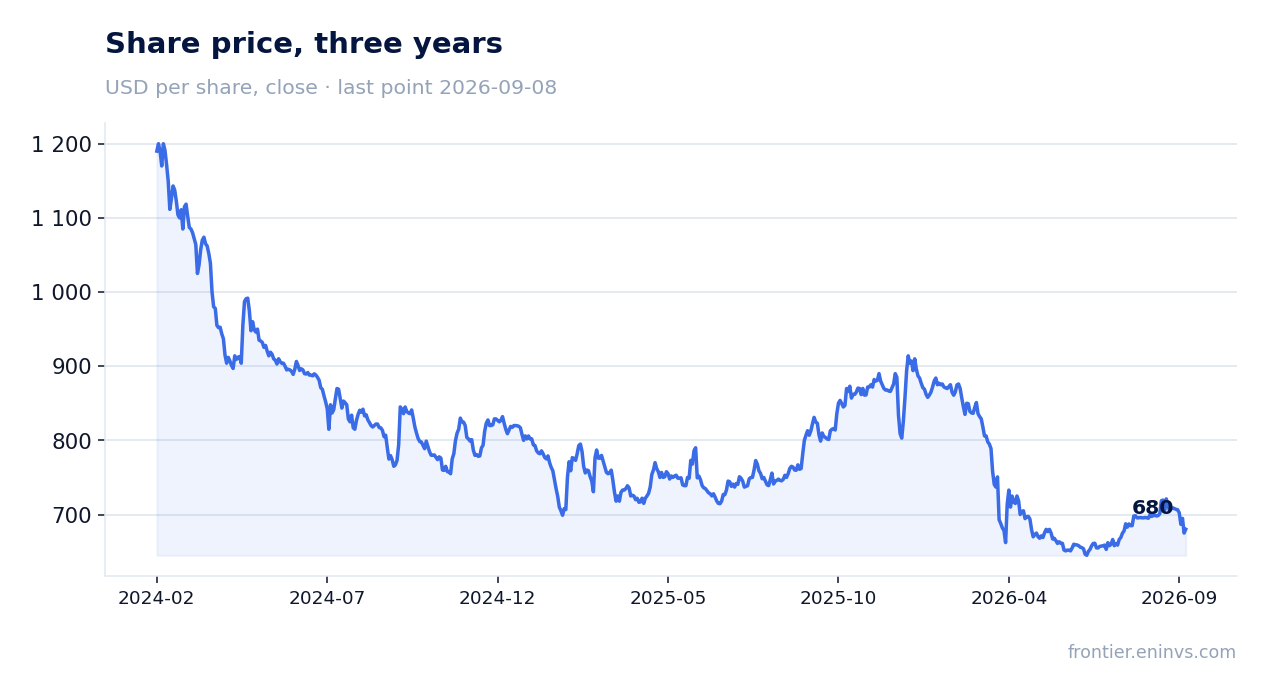
The portal's model sees +9% upside for the shares
According to the portal's model, the fair value of the share is 9% above the current market price. The calculation is based on EBITDA growth times the target multiple, compared with a market cap of $542.1 million.
Current multiples: P/E LTM is 40.0, EV/EBITDA LTM – 1.71. The low EV/EBITDA reflects significant debt and net losses. Return on equity (ROE) is 3.56%.
Valuation on the latest reported figures
| Metric | Value |
|---|---|
| Market cap | 0.54 bn USD |
| P/E (LTM) | 40.0 |
| EV/EBITDA (LTM) | 1.7 |
| Net debt / EBITDA (LTM) | 1.69 |
| Operating cash flow (LTM) | 0.13 bn |
| ROE | 3.6% |
| Dividend yield (12m) | 1.4% |
Bottom line
In H1 2026, AIRA delivered strong revenue growth of 16.1%, driven by higher yields and capacity redeployment towards fast-growing China and India markets. However, a 22.2% CASK increase offset these gains, leading to a net loss of $21 million. Moderate leverage (Net Debt/EBITDA 1.69) and positive operating cash flow provide a cushion, but restoring profitability remains the key question for shareholders. At the current price, the shares look attractive given the portal model's +9% upside, but investors should watch CASK dynamics and the company's ability to control costs.
Open the company's financial profile AIRA →
See also: market overview · valuation map · stock screeners