Air Astana: revenue up 18.3%, but unit-cost inflation wiped out profit
Air Astana Group reported Q2 2026 results. Revenue rose 18.3% year-on-year to $432.9m, EBITDAR fell 3.7% to $93.5m, and the net loss was $0.1m versus a $18.0m profit a year earlier. Tariff growth is not keeping pace with costs: CASK rose 24.3% while RASK added 18.5%. With an EV/EBITDA of 1.69 and the portal model pointing to +9% upside, the share looks rather attractive, but only if management can reverse the cost trajectory.
Key takeaways
— Revenue rose 18.3% on capacity redeployment to China and India, not on overall traffic growth
— EBITDAR fell 3.7% as unit costs outran unit revenue
— Fuel and handling contributed 44% of the cost increase, while tenge appreciation hit the dollar margin
— The $0.1m net loss stems from margin compression, not one-off write-offs
— Net debt of $61.1bn at 2.1x EBITDAR remains below the 3.0x guidance
— Dividend yield of 1.48% with the payout hinging on profit recovery
— EV/EBITDA of 1.69 looks low, but the portal model implies only +9% upside
Attractiveness
Key figures, USD bn
| Metric | — | Q2 2026 | Change |
|---|---|---|---|
| Revenue | — | 0.43 | — |
Revenue rose 18.3% on capacity redeployment to China and India, not on overall traffic growth
Group revenue in Q2 2026 reached $432.9m, up 18.3% year-on-year. Yet total capacity (ASK) was virtually flat, down 0.2%, and passenger numbers fell 1.7% to 2.4m. The entire increase came from a 18.5% rise in unit revenue per available seat kilometre (RASK) to 7.78 cents.
This tariff growth was made possible by reallocating capacity to higher-yielding destinations. According to the presentation, in H1 2026 capacity to China was increased by 91%, to India by 41%, while the Middle East was cut by 35% and Turkey by 13%. This added $70m to half-year revenue with almost no change in total traffic volume.
However, RASK growth was uneven: FlyArystan saw a 21.4% increase, Air Astana 15.6%. This reflects different load factor dynamics: FlyArystan's load factor fell 0.4 pp but its tariff rose more, while Air Astana raised its load factor by 0.9 pp with a more modest tariff increase. Overall group load factor remained stable at 81.6%.
EBITDAR fell 3.7% as unit costs outran unit revenue
Group EBITDAR in Q2 2026 was $93.5m, down 3.7% year-on-year. The EBITDAR margin fell 4.9 pp to 21.6%. The reason is that unit costs grew faster than unit revenue: CASK rose 24.3% to 7.29 cents, while RASK added only 18.5%. As a result, the RASK/CASK spread, which was negative in Q1 2026, returned to positive territory in Q2 at 0.49 cents per ASK.
The main contributors to cost inflation were fuel and handling: according to the presentation, they accounted for 44% of the total cost increase. Tenge appreciation also weighed on dollar revenue from international routes, and employee and maintenance costs rose. Insufficient production volume added further pressure: fixed and semi-fixed costs were spread over a smaller traffic base.
For H1 2026, group EBITDAR fell 9.7% to $141.7m, with the margin down 5.3 pp to 18.6%. This is the second consecutive quarter of costs outpacing revenue, casting doubt on the medium-term target of a mid-to-high 20s EBITDAR margin.
Fuel and handling contributed 44% of the cost increase, while tenge appreciation hit the dollar margin
According to the presentation, group operating expenses in H1 2026 rose 22.5% to $750m. Fuel and handling accounted for 44% of that increase. These are key items that management cannot quickly cut: fuel prices depend on global benchmarks, and handling fees are set by airports.
The second factor is tenge appreciation. Since a significant portion of Air Astana's revenue is denominated in dollars while some costs are in tenge, a stronger national currency reduces dollar revenue and increases dollar costs. The presentation lists this as one of the reasons for margin compression.
The remaining increase came from employee costs, maintenance, and depreciation. Management notes that fixed and semi-fixed costs were spread over a smaller-than-planned production volume. This means that as traffic grows, some of these costs will be diluted, which should support margins going forward.
The $0.1m net loss stems from margin compression, not one-off write-offs
The group's net loss in Q2 2026 was $0.1m, compared with a $18.0m profit a year earlier. This is not the result of one-off write-offs or impairments – no such items are mentioned in the report. The loss is a direct consequence of lower operating profitability: the group EBIT margin fell 4.3 pp to 6.3%.
For H1 2026, the net loss was $21m versus a $10.8m profit a year earlier. The decline is explained by the same factors: cost inflation and tenge appreciation. Operating profit remains positive, indicating that the business is not loss-making at the operating level.
Importantly, the loss is not accompanied by rising debt or deteriorating liquidity. The net debt/EBITDAR ratio remains at 2.1x, and cash on the balance sheet covers 31% of trailing twelve-month revenue. This provides a cushion to weather the current period of margin compression.
Net debt of $61.1bn at 2.1x EBITDAR remains below the 3.0x guidance
The group's net debt at the end of H1 2026 was $61.1bn. The net debt/EBITDAR ratio for the trailing twelve months is 2.1x, up 0.3x from the end of 2025 but still well below the 3.0x target. Management confirms the company remains within its debt policy.
The debt structure includes operating and finance lease obligations as well as bank loans. Total debt rose to $937m in H1 2026 from $909m at the end of 2025. The increase is linked to financing fleet expansion: in 2026, two Boeing 787s, two Airbus A321s, and one A320 are expected to be delivered.
Liquidity remains comfortable: the cash-to-revenue ratio for the trailing twelve months is 31%, down 1.5 pp from a year earlier but above the 25% minimum threshold. This allows the company to fund capital expenditure and service debt without raising additional capital.
Dividend yield of 1.48% with the payout hinging on profit recovery
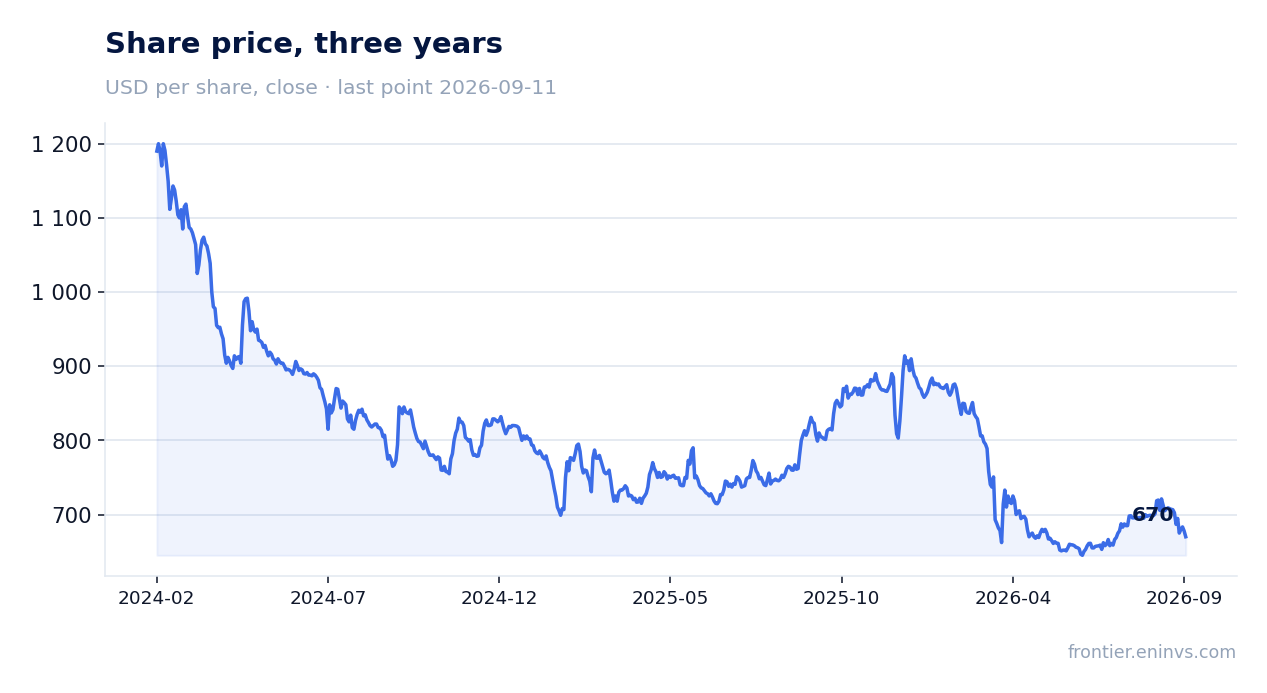
Over the trailing twelve months, Air Astana's dividend yield is 1.48%. The company did not disclose a specific dividend for 2025 in the provided report, but the existence of payments is confirmed by history. The current yield is low compared to the key rate in Kazakhstan, reflecting a growth rather than income story.
Our estimate for the 2026 dividend assumes a conservative scenario: if net profit for the year remains under pressure from high costs, the payout may be limited. With a payout ratio close to historical and profit at the trailing twelve-month level ($13.6m), the dividend per share could be around $0.02, implying a yield of about 1.5% at the current price. This is our calculation, not company guidance.
The main risk to the dividend is further margin compression. If EBITDAR continues to fall and the net loss persists, the board may revise the payout. However, low debt and ample liquidity allow the dividend to be maintained even during a period of weak results.
EV/EBITDA of 1.69 looks low, but the portal model implies only +9% upside
The trailing twelve-month EV/EBITDA multiple is 1.69. This is a very low level, which could indicate undervaluation, but it also reflects high risks related to profit volatility and the capital-intensive nature of the business. For comparison, the trailing P/E is 39.5, explained by the low profit base.
Our fundamental valuation model, based on EBITDA growth and a target multiple, implies +9% upside to fair value. This is a moderate potential that does not assume a significant re-rating. The model incorporates current trends and does not price in a sharp margin recovery.
Thus, the stock trades at a discount to historical levels, but this discount is justified by weak financial results. A substantial increase in market capitalisation would require a sustainable recovery in profitability, which is not yet evident in the reported figures.
Valuation on the latest reported figures
| Metric | Value |
|---|---|
| Market cap | 0.54 bn USD |
| P/E (LTM) | 39.5 |
| EV/EBITDA (LTM) | 1.7 |
| Net debt / EBITDA (LTM) | 1.67 |
| Operating cash flow (LTM) | 0.13 bn |
| ROE | 3.6% |
| Dividend yield (12m) | 1.5% |
Bottom line
The strong point of the report is revenue growth of 18.3% driven by capacity redeployment to China and India, which lifted RASK by 18.5% with almost flat traffic. However, this did not translate into profit: EBITDAR fell 3.7% and the net result was a $0.1m loss. The weakness lies in faster cost growth, primarily fuel and handling, as well as tenge appreciation. Debt remains moderate (2.1x EBITDAR) and liquidity is sufficient. The question for a holder now is whether management can reverse the unit cost trend and restore margins to target levels. With an EV/EBITDA of 1.69 and +9% upside on the portal model, the share looks rather attractive, but only if profit recovers.
Open the company's financial profile AIRA →
See also: market overview · valuation map · stock screeners