KMGZ: profit doubled, but free cash flow turned negative on dividend timing and higher capex
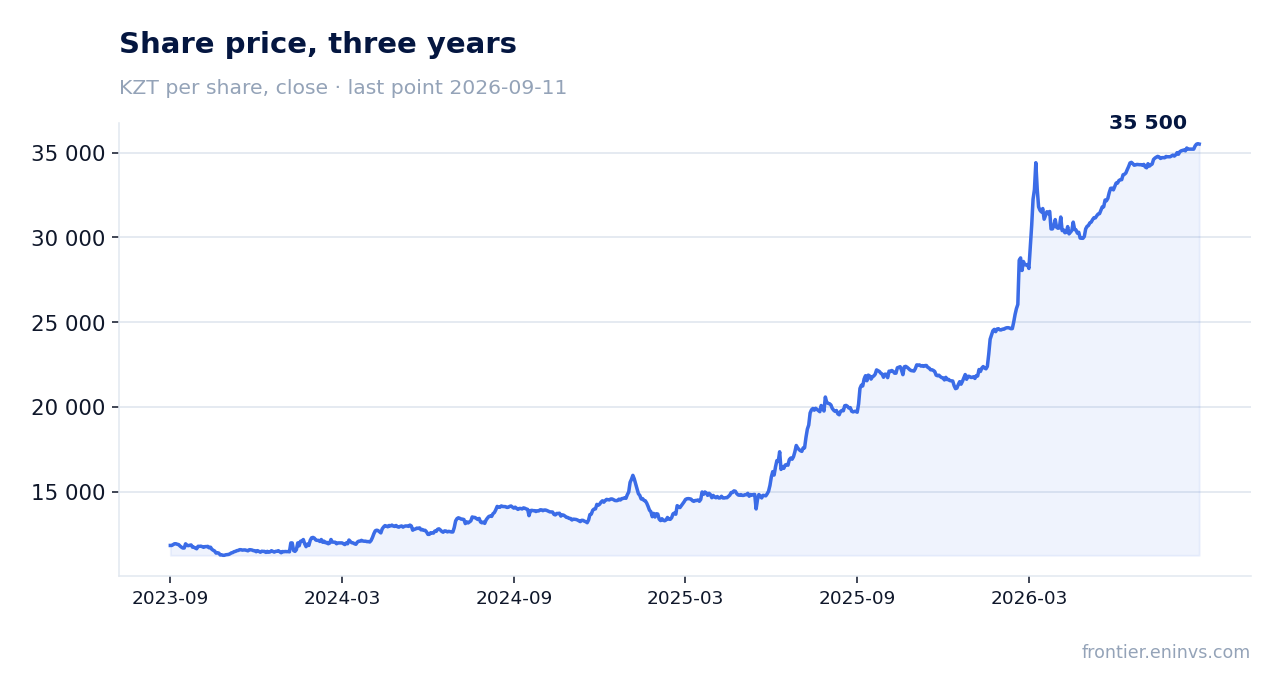
On 29 May 2026, KMGZ published its results for the first quarter of 2026. Revenue rose 10.7% year-on-year to KZT 2,481 bn, EBITDA – by 33.0% to KZT 775 bn, net profit – by 93.8% to KZT 373 bn. However, free cash flow turned negative at minus KZT 78 bn versus plus KZT 283 bn a year earlier, and net debt increased to KZT 573 bn. At the current price the share looks attractive: the portal's model implies +74% upside, while the 1.6% dividend yield is not yet the key factor.
Key takeaways
— Revenue rose 10.7% on oil prices and petroleum product sales, but tenge appreciation capped the growth
— EBITDA jumped 33.0% on share in JV profits, but adjusted EBITDA grew only 6.8%
— Net profit rose 93.8%, but almost half came from share in JV profits, not operations
— Free cash flow turned negative on higher capex and a shift in TCO dividends
— Net debt rose to KZT 573 bn, but net debt/EBITDA LTM stands at 1.52 – a moderate level
— Dividend yield of 1.6% with a payout ratio and profit dependent on JVs limits appeal
— Valuation: P/E LTM 21.8 and EV/EBITDA LTM 15.5, above historical averages, but the portal's model implies +74% upside
Attractiveness
Key figures, KZT bn
| Metric | — | Q2 2026 | Change |
|---|---|---|---|
| Revenue | — | 5 568 | — |
| EBITDA | — | 763 | — |
| Operating profit | — | 410 | — |
| Net profit | — | 534 | — |
| Operating cash flow | — | -109 919 | — |
| EBITDA margin | — | 13.7% | — |
| Net margin | — | 9.6% | — |
Revenue rose 10.7% on oil prices and petroleum product sales, but tenge appreciation capped the growth
Revenue for the first quarter of 2026 amounted to KZT 2,481 bn, up 10.7% from KZT 2,241 bn a year earlier. Growth was recorded across all operating segments. The main drivers were higher global oil prices and increased selling prices for KMG International's petroleum products.
The average Dated Brent price rose 7.1% to USD 81.13 per barrel, KEBCO – by 5.8% to USD 81.11. However, the tenge's appreciation against the dollar (average rate 497.09 vs 510.05) partially offset the price factor in tenge revenue. Without this effect, revenue growth would have been higher.
Oil and gas condensate production fell 12.0% to 5,647 thousand tonnes due to CPC intake restrictions and a transformer fire at the Future Growth Project facilities in January 2026. This limited revenue growth potential but did not lead to a decline thanks to prices.
EBITDA jumped 33.0% on share in JV profits, but adjusted EBITDA grew only 6.8%
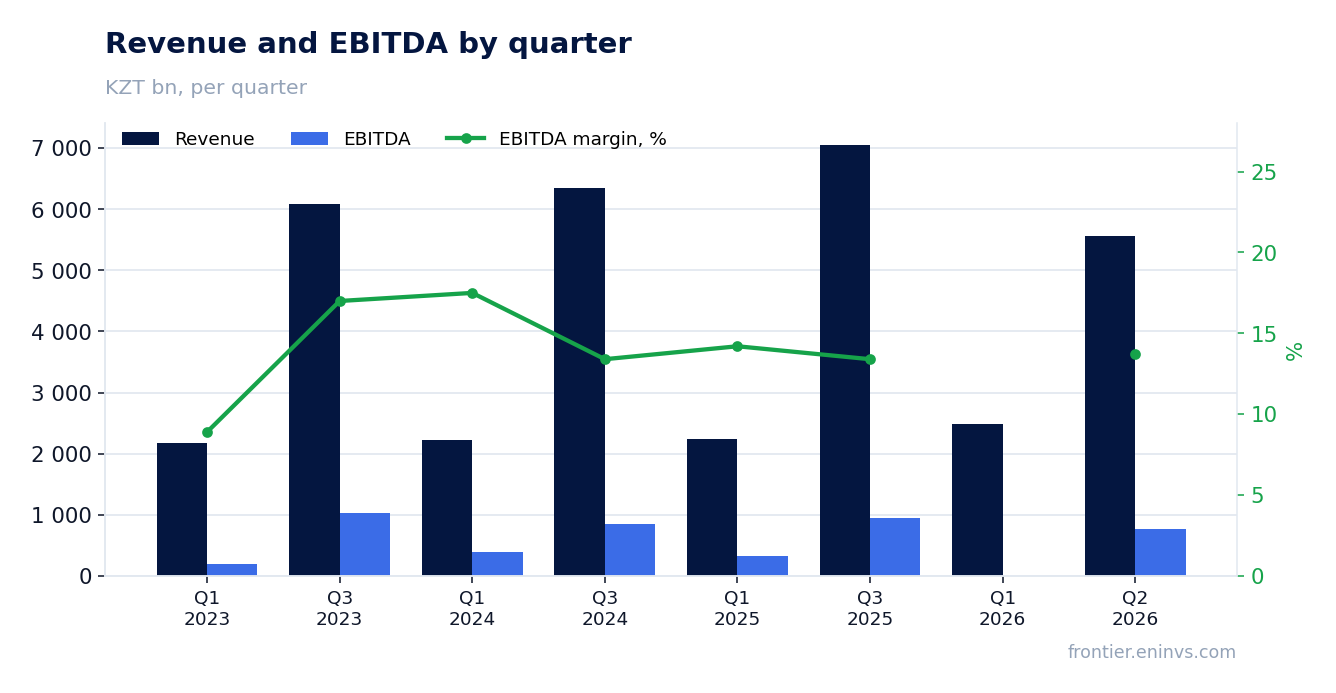
EBITDA for the first quarter of 2026 was KZT 775 bn, up 33.0% from KZT 582 bn a year earlier. However, this growth was largely driven by an increase in the share of profits from joint ventures and associates, which rose 5.5% to KZT 196 bn.
Adjusted EBITDA, which reflects dividends received instead of the share in JV profits, grew only 6.8% to KZT 591 bn. This reflects more modest operating dynamics when excluding the non-cash share in JV profits. Dividends from JVs amounted to only KZT 12 bn versus KZT 156 bn a year earlier due to a shift in TCO payments.
The EBITDA margin in the reporting period was 13.7%, lower than in previous quarters due to higher costs of purchased oil and petroleum products, as well as increased transportation expenses. Nevertheless, the absolute EBITDA level remains high.
Net profit rose 93.8%, but almost half came from share in JV profits, not operations
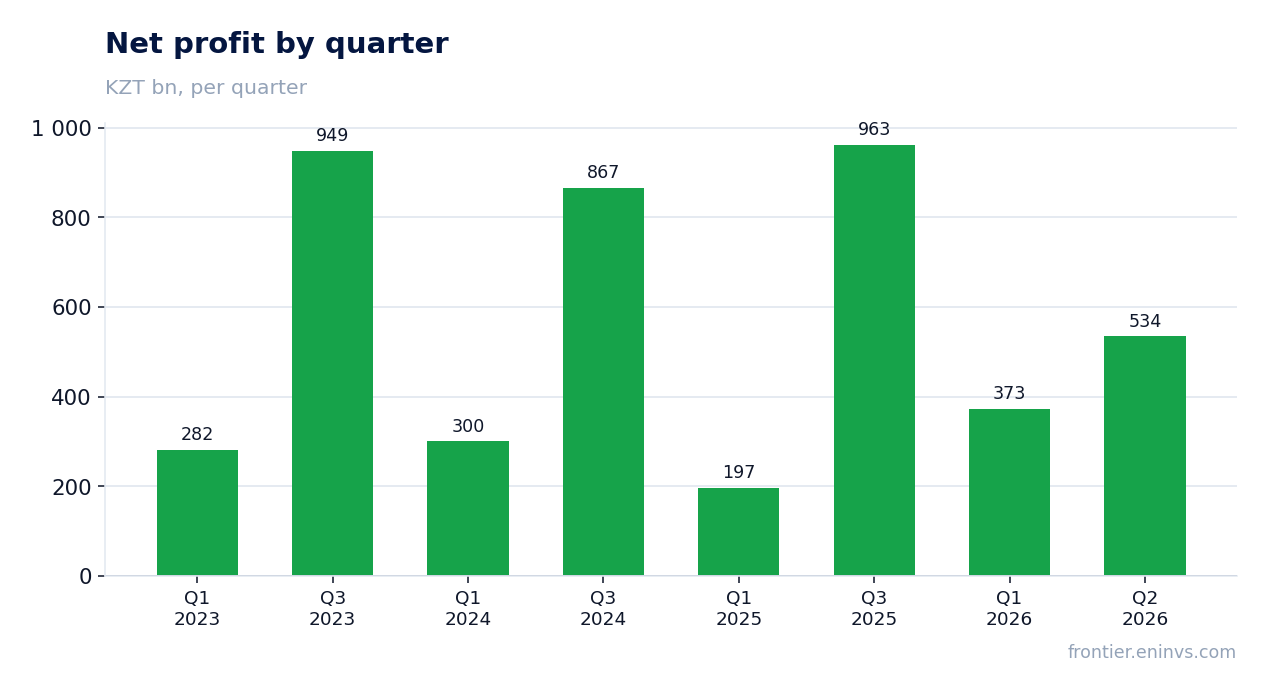
Net profit for the first quarter of 2026 was KZT 373 bn, up 93.8% from KZT 193 bn a year earlier. However, KZT 196 bn of this amount came from the share in profits of joint ventures and associates, accounting for more than half.
Net profit adjusted for the share in JV profits grew only 15.9% to KZT 190 bn. The growth in adjusted profit was driven by higher revenue, lower impairment of property, plant and equipment and exploration expenses, as well as lower finance costs.
The reporting period also saw a decrease in dividends received from JVs to KZT 12 bn versus KZT 156 bn a year earlier. This did not affect net profit but impacted cash flow. Importantly, dividends from TCO in the amount of KZT 140 bn were received after the reporting date, on 29 April 2026.
Free cash flow turned negative on higher capex and a shift in TCO dividends
Free cash flow in the first quarter of 2026 was negative at minus KZT 78 bn versus plus KZT 283 bn a year earlier. This sharp deterioration is due to two main factors: lower operating cash flow and higher capital expenditures.
Operating cash flow declined due to changes in working capital, particularly an increase in trade receivables and other current assets, as well as a shift in the timing of dividend receipts from joint ventures. Dividends from TCO in the amount of KZT 140 bn were received only in April 2026, after the reporting date.
Cash-based capital expenditures rose 64.3% to KZT 237 bn, driven by higher purchases of property, plant and equipment at KMG PetroChem LLP and Kazakh Gas Processing Plant LLP. On an accrual basis, capex fell 10.0% to KZT 116 bn, reflecting lower expenses in the exploration and production segment, partially offset by growth in the refining and trading segment.
Net debt rose to KZT 573 bn, but net debt/EBITDA LTM stands at 1.52 – a moderate level
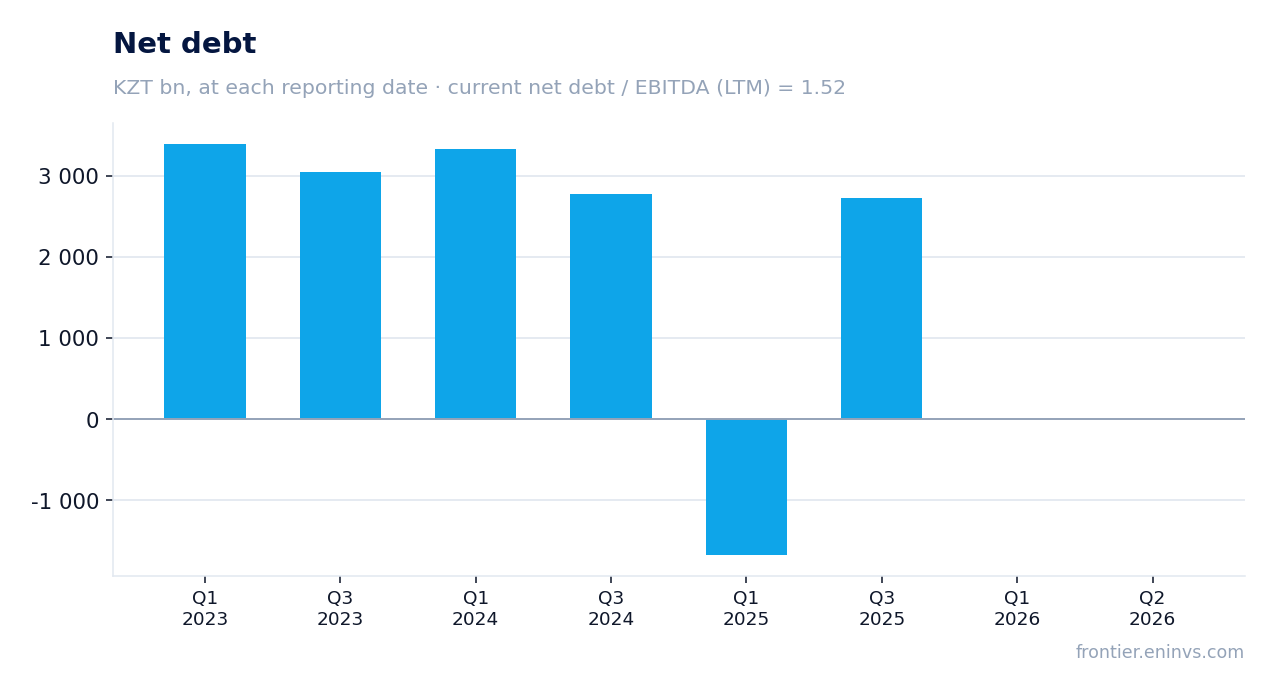
Net debt as of 31 March 2026 was KZT 573 bn, up 52.7% in tenge terms from KZT 375 bn at the end of 2025. The increase was driven by a decrease in cash and deposits included in the net debt calculation, due to financing of capital expenditures and revaluation of foreign currency accounts.
Gross debt decreased 0.5% to KZT 3,504 bn, with 68% denominated in US dollars. In dollar terms, gross debt rose 5.1% due to the utilisation of previously raised borrowings. The net debt/EBITDA LTM ratio stands at 1.52 – a moderate level that does not raise concerns.
Cash and cash equivalents including deposits amounted to KZT 2,932 bn, down 6.8% from the beginning of the year. This decrease is related to financing investment projects of subsidiaries. Despite the increase in net debt, the company maintains significant liquidity.
Dividend yield of 1.6% with a payout ratio and profit dependent on JVs limits appeal
The dividend yield over the trailing 12 months is 1.6%. This is a modest level and not a primary factor for investors. The company did not declare dividends for the first quarter of 2026, and the current yield reflects past payments.
Our estimate of the dividend for 2026 depends on the payout ratio and profit, a significant portion of which is formed by the share in profits of joint ventures. Since this share is non-cash, the dividend stream can be volatile. The shift in TCO dividends to the second quarter of 2026 means cash receipts will be uneven.
At the current share price and a yield of 1.6%, the dividend does not compensate for the risks associated with profit volatility. To become more attractive, either a higher payout ratio or sustainable growth in operating profit independent of JVs is needed.
Valuation: P/E LTM 21.8 and EV/EBITDA LTM 15.5, above historical averages, but the portal's model implies +74% upside
Based on the trailing 12 months, P/E is 21.8 and EV/EBITDA is 15.5. These multiples are above the historical averages over the past three years, indicating a relatively high valuation compared to previous periods. However, current profit includes a significant share in JV profits, which can be volatile.
The portal's model, which re-prices EBITDA at current commodity prices and the target EV/EBITDA, implies +74% upside to fair value. This is our own estimate, not a market consensus. It assumes that current oil and gas prices persist and the multiple remains at the target level.
Return on equity (ROE) is 17.3%, which supports the valuation. However, to realise the upside, operational improvements and reduced dependence on the non-cash share in JV profits are needed.
Valuation on the latest reported figures
| Metric | Value |
|---|---|
| Market cap | 23 318 bn KZT |
| P/E (LTM) | 21.8 |
| EV/EBITDA (LTM) | 15.5 |
| P/B | 1.87 |
| Net debt / EBITDA (LTM) | 1.52 |
| Operating cash flow (LTM) | 1 900 bn |
| ROE | 17.3% |
| Dividend yield (12m) | 1.6% |
Bottom line
Bottom line: KMGZ showed strong revenue and EBITDA growth in the first quarter of 2026, but a significant portion of profit came from the non-cash share in JV profits. Free cash flow turned negative due to higher capital expenditures and a shift in TCO dividends, while net debt rose to KZT 573 bn. At the same time, the net debt/EBITDA LTM ratio stands at 1.52, a moderate level. Valuation multiples are above historical averages, but the portal's model implies +74% upside. The share looks attractive for investors willing to accept cash flow volatility and dependence on oil prices.
Open the company's financial profile KMGZ →
See also: market overview · valuation map · stock screeners