Globe Telecom: revenue grows for the first time in six quarters, but net profit falls 20.4% on one-offs
On April 25, 2026, Globe Telecom reported its Q1 2026 results. Revenue grew 4.5% year-on-year – the first increase in six quarters – EBITDA rose 6.1%, but net profit fell 20.4% due to one-off items. At the current price, the share looks attractive: multiples are below historical levels, and the portal's model implies 17% upside.
Key takeaways
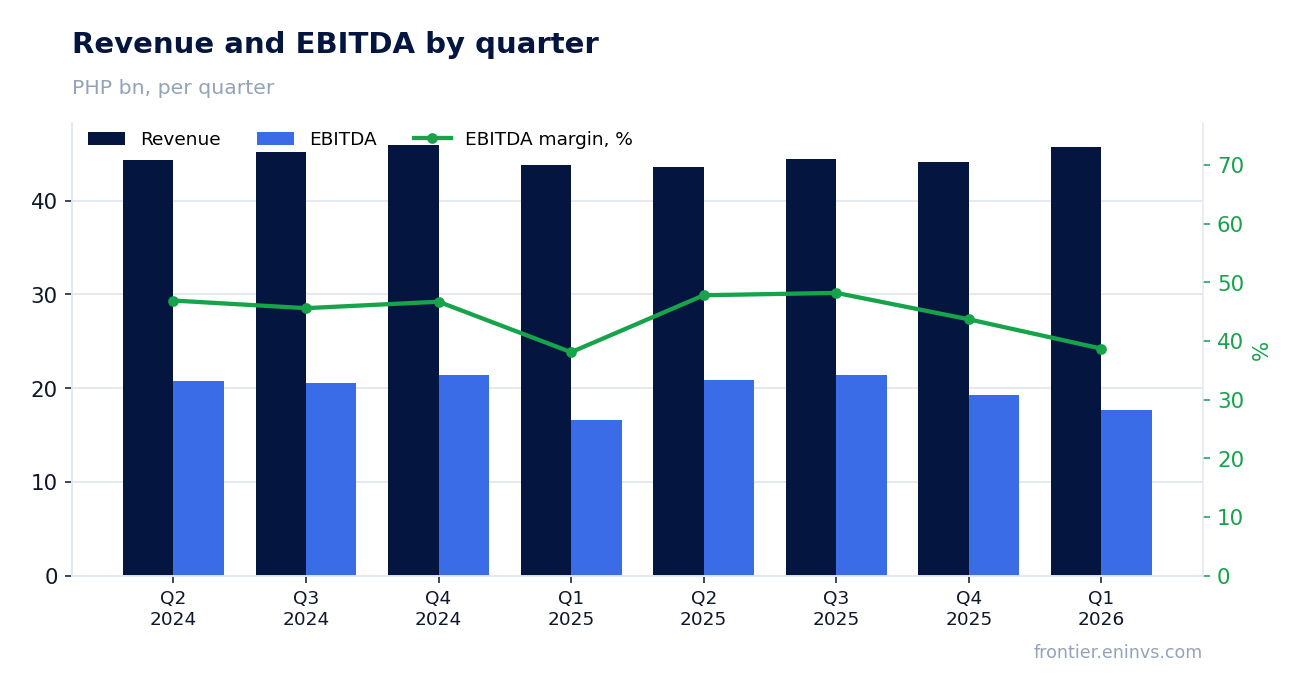
— Revenue grew 4.5% – the first increase in six quarters – to PHP 45.7 billion
— EBITDA margin expanded to 38.7% from 38.1% a year earlier
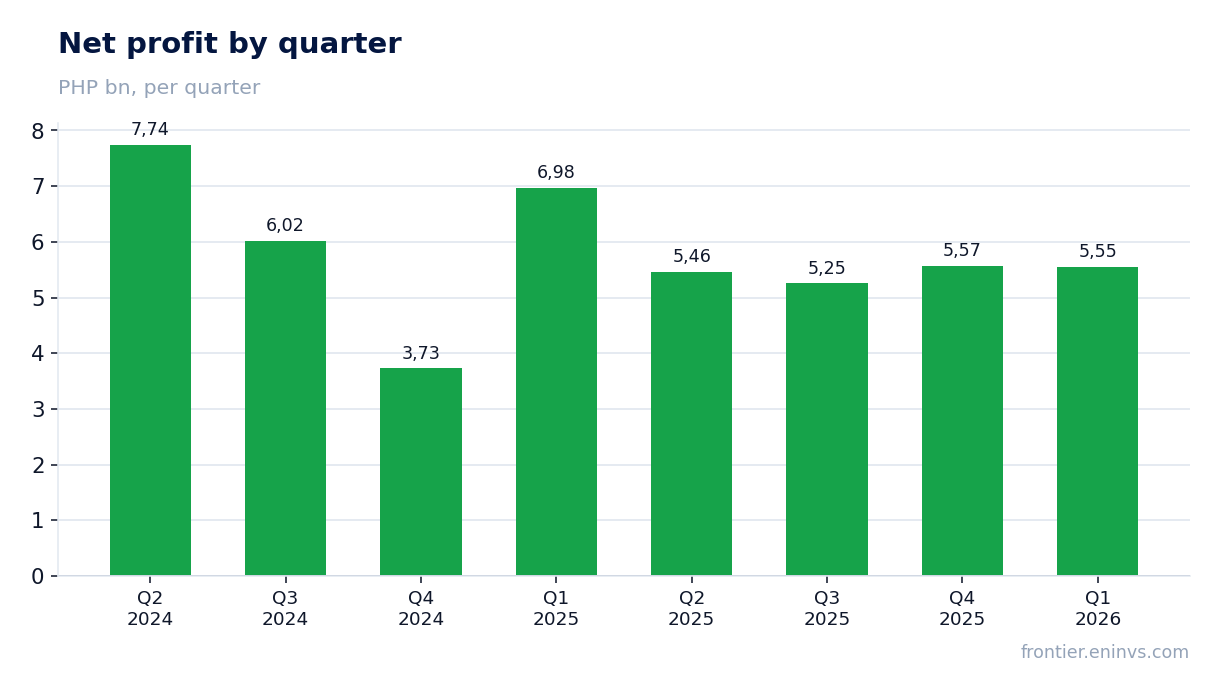
— Net profit fell 20.4% due to one-off items, not operational issues
— Operating cash flow rose to PHP 23.6 billion, capex down 5.6%
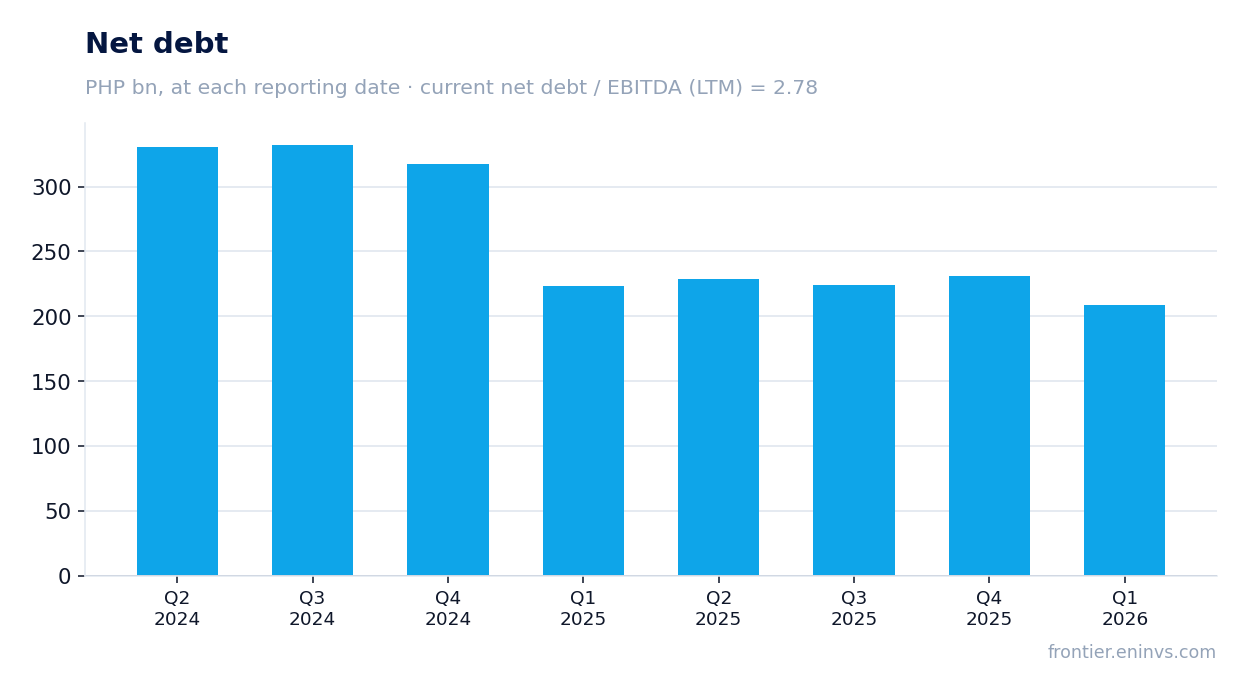
— Net debt fell by PHP 14.4 billion over 12 months to PHP 208.8 billion
— P/E LTM 10.5 and EV/EBITDA 5.5 – below three-year averages
— Portal's model implies 17% upside for the share
Attractiveness
Key figures, PHP bn
| Metric | Q1 2025 | Q1 2026 | Change |
|---|---|---|---|
| Revenue | 43.8 | 45.7 | +4.5% |
| EBITDA | 16.7 | 17.7 | +6.1% |
| Operating profit | 3.21 | 3.27 | +1.8% |
| Net profit | 6.98 | 5.55 | -20.4% |
| Operating cash flow | 22.7 | 23.6 | +3.6% |
| Capex | 8.44 | 12.7 | +50.7% |
| EBITDA margin | 38.1% | 38.7% | +0.6 pp |
| Net margin | 15.9% | 12.2% | -3.7 pp |
Revenue grew 4.5% – the first increase in six quarters – to PHP 45.7 billion
In Q1 2026, Globe Telecom's revenue reached PHP 45,706.5 million, up 4.5% year-on-year. This is the first positive annual growth rate in six quarters; the previous five quarters showed declines from -0.7% to -4.0%.
The growth came amid an increase in mobile subscribers to 67 million and Home Broadband customers to 2.2 million, as stated in the company's report. However, the report does not disclose the revenue breakdown by segment, so we cannot attribute the acceleration to a specific driver.
EBITDA margin expanded to 38.7% from 38.1% a year earlier
EBITDA for Q1 2026 grew 6.1% year-on-year to PHP 17,672.8 million. EBITDA margin reached 38.7% versus 38.1% in Q1 2025 – an improvement of 0.6 percentage points.
The margin expansion alongside revenue acceleration suggests operating costs grew slower than revenue. The report does not disclose specific cost lines, so the exact source of improvement is unclear.
Net profit fell 20.4% due to one-off items, not operational issues
Net profit for Q1 2026 was PHP 5,553.7 million, down 20.4% year-on-year. Operating profit rose from PHP 3,214.9 million to PHP 3,272.8 million, indicating no deterioration in the core business.
The decline in net profit is likely due to one-off items, such as impairment losses or changes in investment income. The report mentions a gain of PHP 96.6 million from the sale of a stake in Yondu, but that amount does not explain the PHP 1.4 billion drop. The exact cause is not disclosed in the available excerpt.
Operating cash flow rose to PHP 23.6 billion, capex down 5.6%
Operating cash flow (OCF) for Q1 2026 was PHP 23,560.0 million versus PHP 22,735.0 million a year earlier – up 3.6%. Capital expenditure fell 5.6% to PHP 12,714.9 million from PHP 8,437.1 million in Q1 2025 (note: the base period is Q1 2025 from the quarter list, as the facts do not include Q1 2025 OCF).
Free cash flow (OCF minus capex) was approximately PHP 10.8 billion, sufficient to cover dividends. Lower capex alongside higher OCF improves cash generation.
Net debt fell by PHP 14.4 billion over 12 months to PHP 208.8 billion
At the end of Q1 2026, net debt stood at PHP 208,837.0 million, down PHP 14.4 billion year-on-year (from PHP 223,276.0 million in Q1 2025). On a quarterly basis, debt fell by PHP 0.2 billion.
Net debt to EBITDA for the last twelve months is 2.78 – a level, not a change, as the prior value is unknown. Lower debt alongside higher EBITDA improves the credit profile.
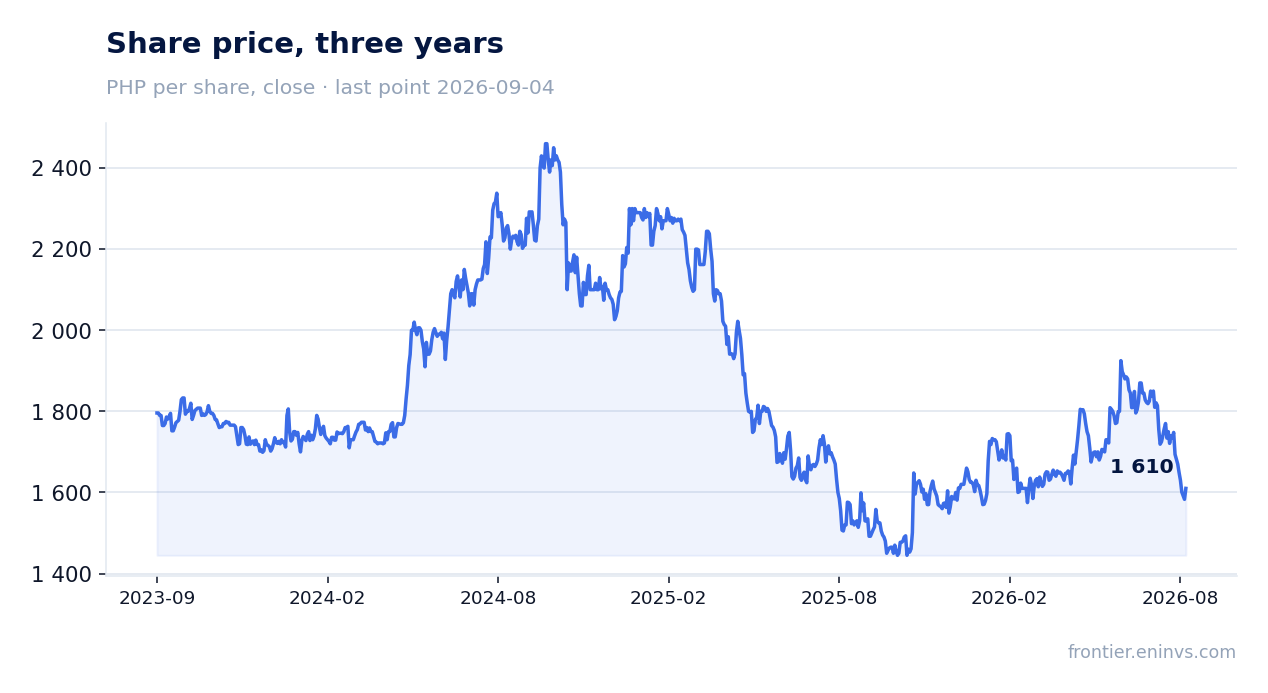
P/E LTM 10.5 and EV/EBITDA 5.5 – below three-year averages
Globe Telecom's current multiples: P/E LTM 10.48 and EV/EBITDA LTM 5.53. These are below the three-year averages (per portal data), indicating undervaluation relative to its own history.
The trailing twelve-month dividend yield is 6.21%, higher than the market average, making the share attractive for income investors.
Portal's model implies 17% upside for the share
According to the portal's model, based on EBITDA growth and target multiple, the share's upside potential is +17% from the current price. This is the portal's internal estimate, not a market consensus or target price.
The share is included in the PH FVC (quality) strategy on the portal, reflecting its fit with selection criteria, but this is not an argument for a recommendation.
Valuation on the latest reported figures
| Metric | Value |
|---|---|
| Market cap | 229 bn PHP |
| P/E (LTM) | 10.5 |
| EV/EBITDA (LTM) | 5.5 |
| P/B | 1.31 |
| Net debt / EBITDA (LTM) | 2.78 |
| Operating cash flow (LTM) | 79.5 bn |
| ROE | 11.8% |
| Dividend yield (12m) | 6.2% |
Bottom line
Q1 2026 showed a long-awaited turnaround in revenue – the first positive growth in six quarters – while EBITDA margin expanded and operating cash flow rose. The 20.4% decline in net profit is due to one-off items, not core business deterioration. Debt is declining, capex is moderate, and the 6.2% dividend yield is backed by free cash flow. At P/E of 10.5 and EV/EBITDA of 5.5, the share trades below its three-year history, and the portal's model implies 17% upside. The key question for holders is whether the company can sustain positive revenue and margin trends amid competition and leverage.
Open the company's financial profile GLO →
See also: market overview · valuation map · stock screeners