GDP growth 2026 (proj.)4.1%Inflation YoY (proj.)4.3%FX vs USD (3y avg p.a.)+3.8%Macro: IMF World Economic Outlook, April 2026 (Annex tables 1.1.2–1.1.4)
Our recommended portfolios
Performance & current holdings of our strategies for this market — why it makes sense to join.
FVC (quality)Paper-track · 25 Aug 2026
Day-0.7%MSCI Philippines (EPHE) in PHP -0.2%
Week+1.4%MSCI Philippines (EPHE) in PHP +3.2%
Month-0.4%MSCI Philippines (EPHE) in PHP -0.2%
By calendar year vs MSCI Philippines (EPHE) in PHP
This quarter's Philippine corporate scorecard is defined by a violent divergence: banks delivered a median revenue surge of +21.8% year over year, while real estate managed just +4.9% and telecom a tepid +5.1%. The spread between the best and worst sectors is a staggering 16.9 percentage points, and within that gap lies a stark message—financials are feasting on higher rates and loan growth, while asset-heavy and consumer-facing sectors are fighting for scraps.
Revenue growth by industry (median YoY)
median revenue YoY, %
Universal banks are the undisputed engine of this earnings season
Security Bank (SECB) posted a jaw-dropping +140.5% revenue jump, though its net profit grew a more modest +11.3%—a sign that the top-line explosion came with margin pressure. Union Bank (UBP) was the cleaner winner: revenue up +33.0%, EBITDA up +60.6%, and net profit up +69.3%, showing genuine operating leverage. BPI added +21.8% revenue but saw EBITDA slip -10.8% and net profit fall -2.0%, a warning that not all bank growth is created equal.
Even the mid-tier banks joined the party: BDO revenue rose +15.6% and Metrobank +13.3%, though both saw net profit dip -1.5% year over year. The message is clear—loan growth and higher yields are lifting the top line, but provisioning and funding costs are eating into the bottom line. For now, the market is rewarding volume over margin.
Property and telecom are the season's anchor, dragging the index down
Ayala Land (ALI) suffered a -5.1% revenue decline, a -32.2% EBITDA collapse, and a -10.3% net profit drop—a triple whammy that screams of a property downturn. Telecom was no safe haven either: Globe (GLO) managed +7.9% revenue growth but watched EBITDA fall -14.5%, while PLDT (TEL) saw revenue rise just +2.2% and net profit plunge -16.4%. These are the sectors that will keep portfolio managers awake at night.
The real plot twist: Union Bank's profit acceleration is the quarter's biggest surprise
While most banks saw net profit stagnate or decline, UBP's net profit accelerated from a prior-year comparison that is not available, but the current +69.3% growth stands in stark contrast to BPI's -2.0% and BDO's -1.5%. Even more impressive, UBP's EBITDA surged +60.6%, far outpacing its revenue growth of +33.0%, signaling that cost synergies and operating leverage are finally kicking in. This is the kind of decoupling that makes you rethink the entire banking sector's margin story.
Cheap for a reason? The value trap lurking in conglomerates
JGS looks dirt cheap at a P/E of 2.4x, but its net profit collapsed -54.1%—that's not a bargain, it's a warning. AGI trades at 3.1x earnings and 4.3x EV/EBITDA, yet its net profit fell -32.3% despite revenue rising +10.4%. Meanwhile, DMC stands out as the value star: revenue +22.2%, EBITDA +41.5%, net profit +60.7%, all for a P/E of just 4.3x and EV/EBITDA of 4.0x. That's growth at a deep-value price. On the expensive side, ICT commands a P/E of 24.5x—priced for perfection in a sector (ports) that delivered +25.3% revenue growth, but any slowdown would be punished.
Income hunters: banks and telecom still pay, but yields are not in the data
Dividend yields were not provided in the dataset, so we cannot rank the top payers this quarter. However, the combination of low P/E multiples and stable net profit at BDO (P/E 7.0x, net profit -1.5%) and Metrobank (P/E 5.4x, net profit -1.5%) suggests these banks could remain income staples if their payout ratios hold. Globe, despite its EBITDA decline, trades at a P/E of 10.4x—higher than peers—implying the market still expects dividend resilience. Without explicit DPS figures, income investors should await the next disclosure.
Zooming out, SM Investments' three-year revenue CAGR of -55.5% is a glaring outlier—a massive contraction that demands explanation, likely portfolio divestments or a pandemic-era base effect. In contrast, most other conglomerates lack a comparable long-term growth metric, leaving DMC's current momentum as the most credible compounding story. The next quarter will be critical: watch whether UBP's margin expansion persists, whether ALI's property slump deepens, and whether ICT's premium valuation can survive any slowdown in port volumes. For now, the smart money is rotating toward banks with operating leverage and conglomerates trading at single-digit earnings.
On 25 August, PH_SM released its Q2 2026 results. Revenue came in at 179,781 mn PHP, operating profit at 42,168 mn PHP, and net profit at 33,170 mn PHP. Revenue growth accelerated to +7.5% year-on-year from +4.9% in the prior quarter, yet net profit rose only +6.4%, and the net margin slipped to 18.5% from 18.7%. With a P/E LTM of 4.84 and a dividend yield of 3.33%, the share looks rather attractive, but margin compression and the absence of quarterly cash flow data temper the view.
Key takeaways
— Revenue accelerated to +7.5% year-on-year, but profit lags: net margin narrowed to 18.5%
— Operating profit rose to 42,168 mn PHP, but its growth trails revenue
— Net profit for the quarter was 33,170 mn PHP, up only 6.4% year-on-year
— Debt load at 3.07x EBITDA LTM is moderate, but quarterly cash flow data is missing
— Dividend yield of 3.33% with P/E LTM of 4.84 — the market values the company cheaply
— The portal's model implies +21% upside to fair value
Attractiveness
Key figures, PHP bn
Metric
Q2 2025
Q2 2026
Change
Revenue
167
180
+7.5%
EBITDA
0.05
—
—
Operating profit
0.04
42.2
+106650.7%
Net profit
31.2
33.2
+6.4%
Operating cash flow
0.03
—
—
Capex
2.37
—
—
EBITDA margin
0.0%
—
—
Net margin
18.7%
18.5%
-0.2 pp
Revenue accelerated to +7.5% year-on-year, but profit lags: net margin narrowed to 18.5%
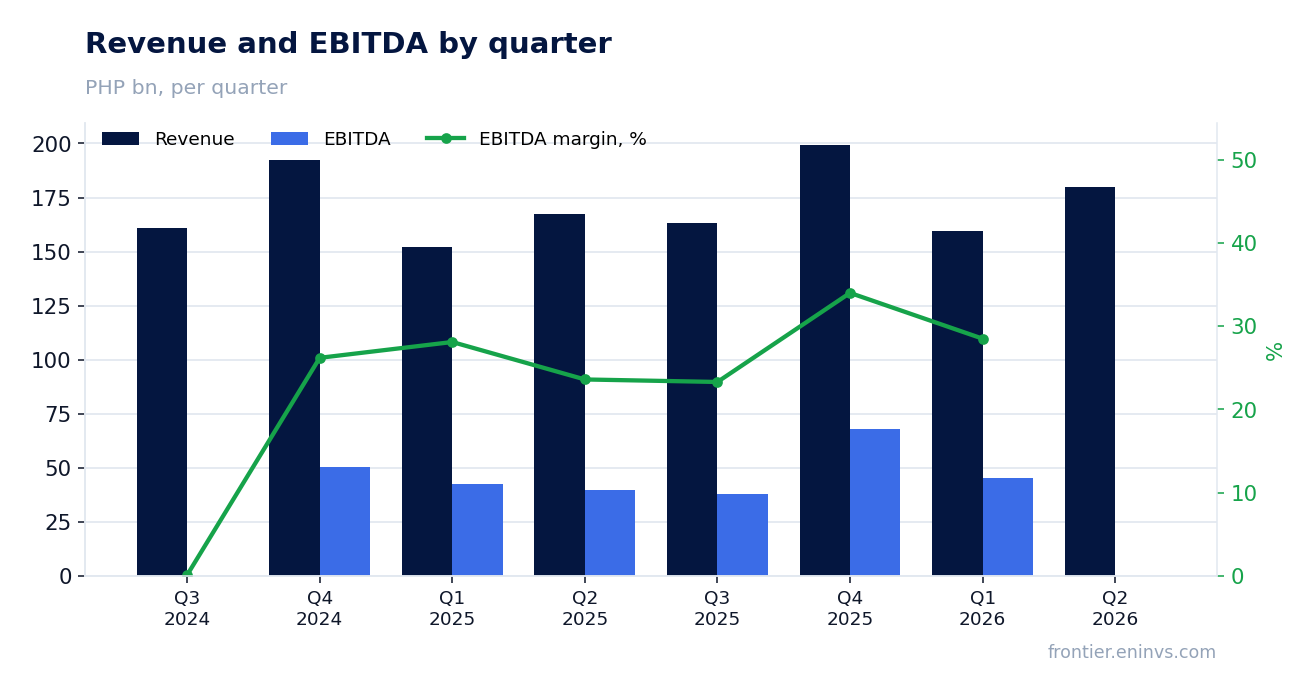
Revenue in Q2 2026 was 179,781 mn PHP, up 7.5% year-on-year. This marks an acceleration from +4.9% in Q1 2026. The company is growing faster than at the start of the year.
However, net profit rose only 6.4% to 33,170 mn PHP. The net margin declined to 18.5% from 18.7% a year earlier. Profit is growing slower than revenue, indicating cost pressure or expenses outpacing income.
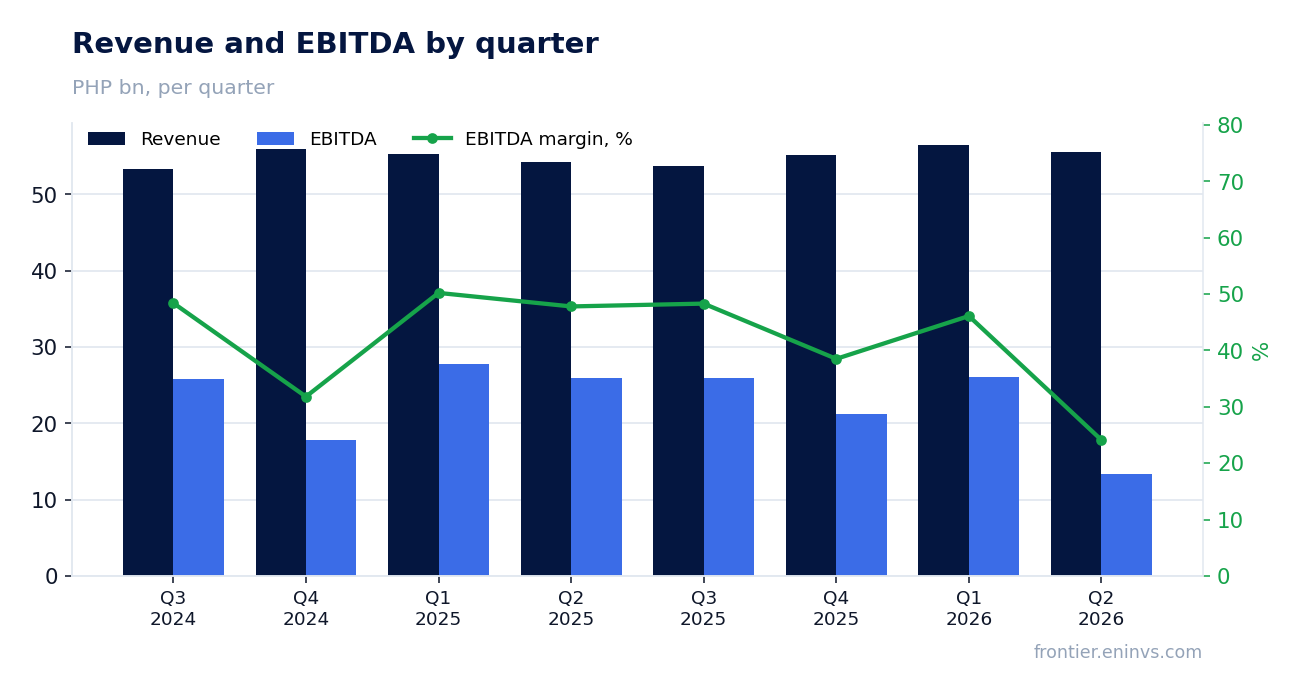
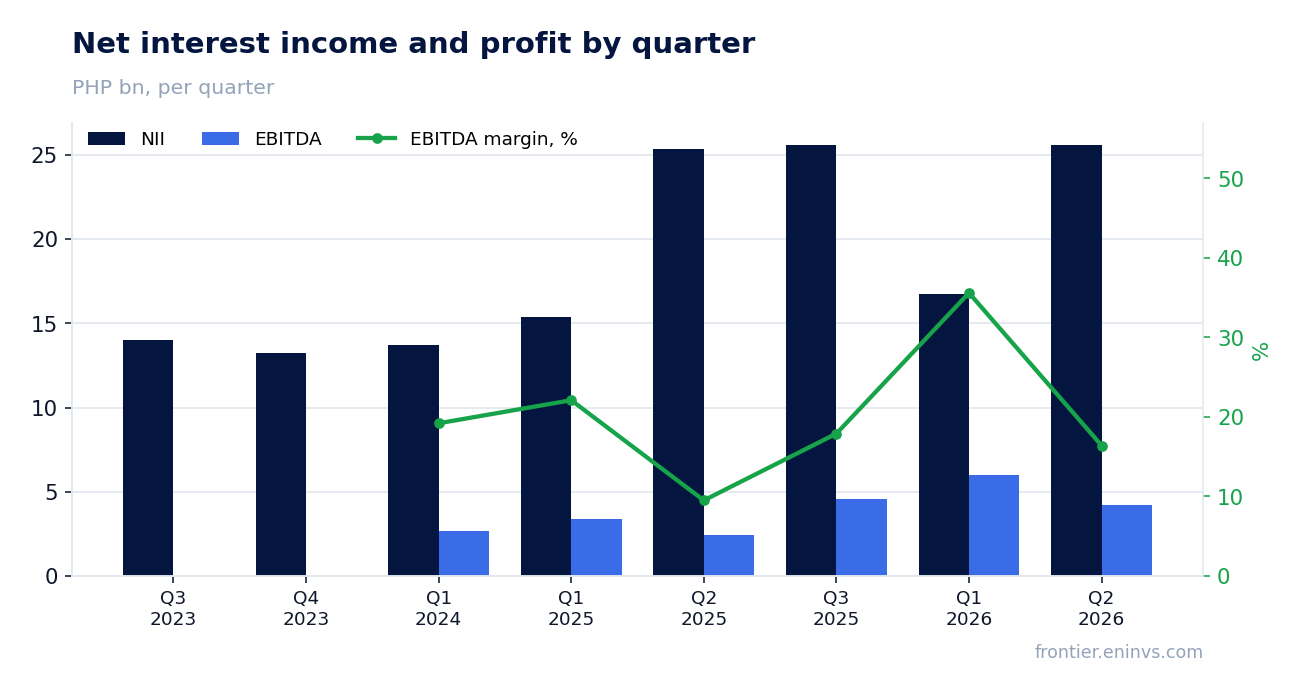
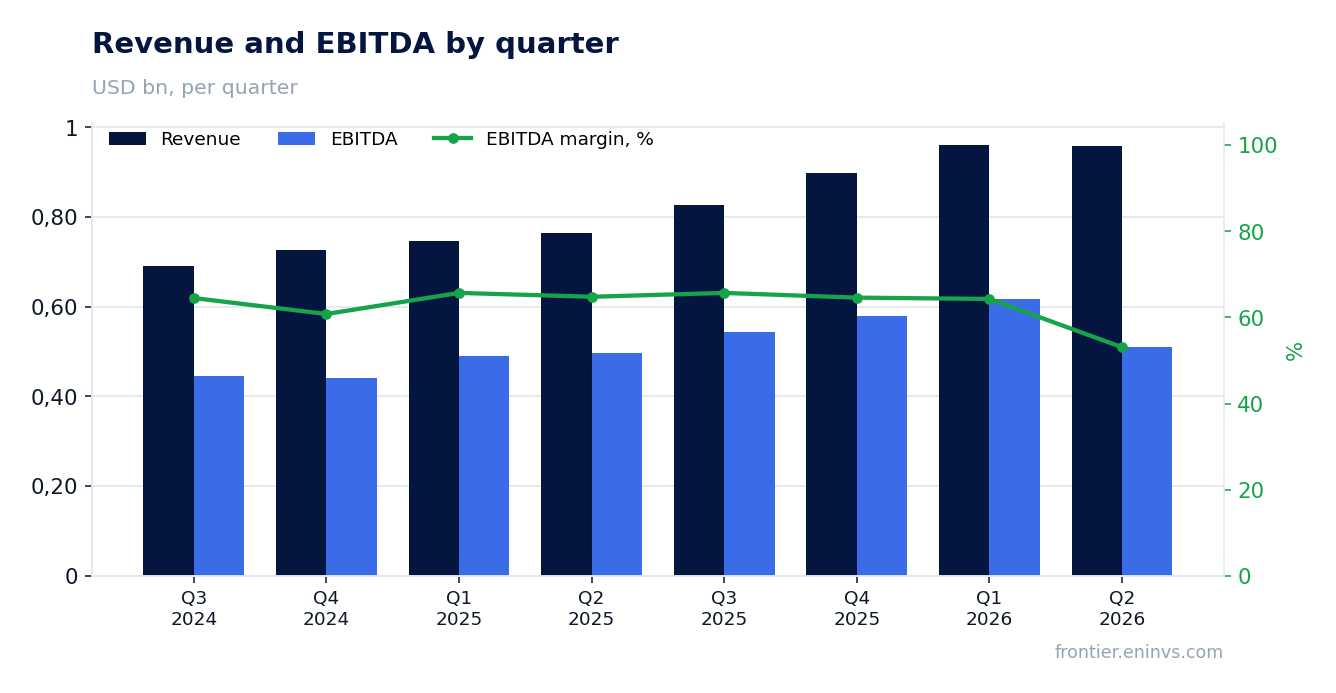
Revenue and EBITDA by quarter
Operating profit rose to 42,168 mn PHP, but its growth trails revenue
Operating profit for Q2 2026 was 42,168 mn PHP. This is 6.8% higher than 39,501 mn PHP a year earlier. Operating profit growth trails revenue growth, confirming pressure on operating expenses.
The operating margin slipped to 23.5% from 23.6% a year earlier. The company maintains high operating profitability, but the slight decline suggests that revenue growth is accompanied by faster cost increases.
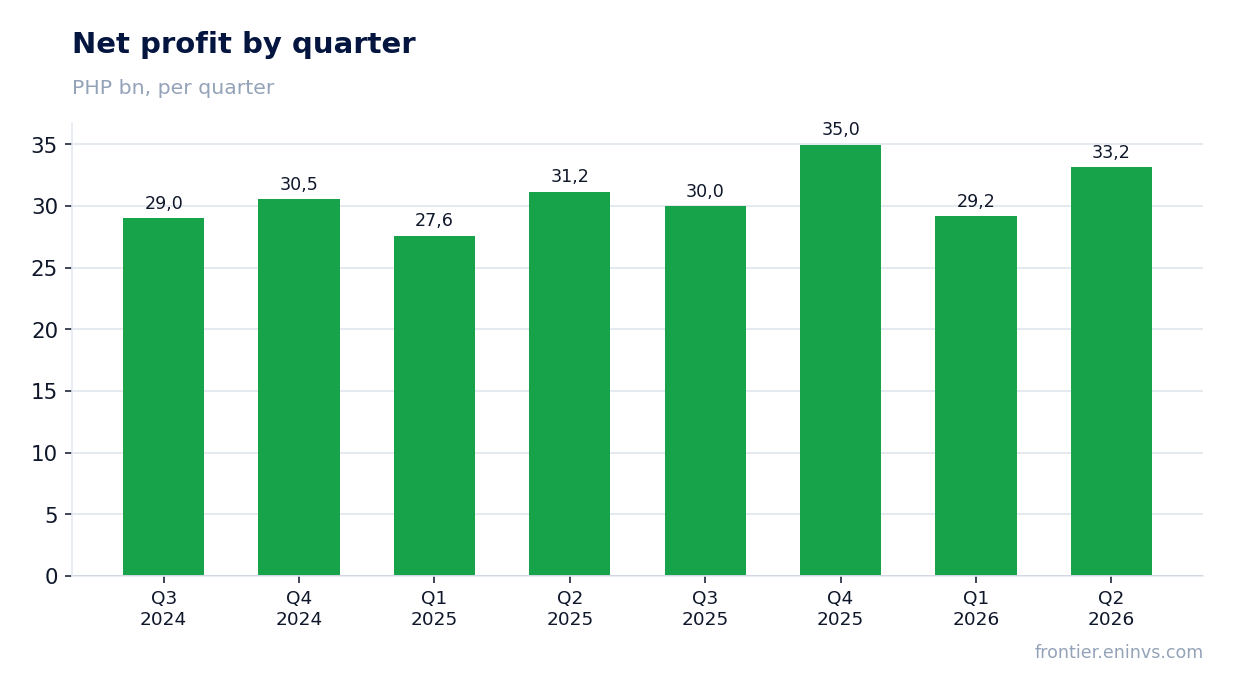
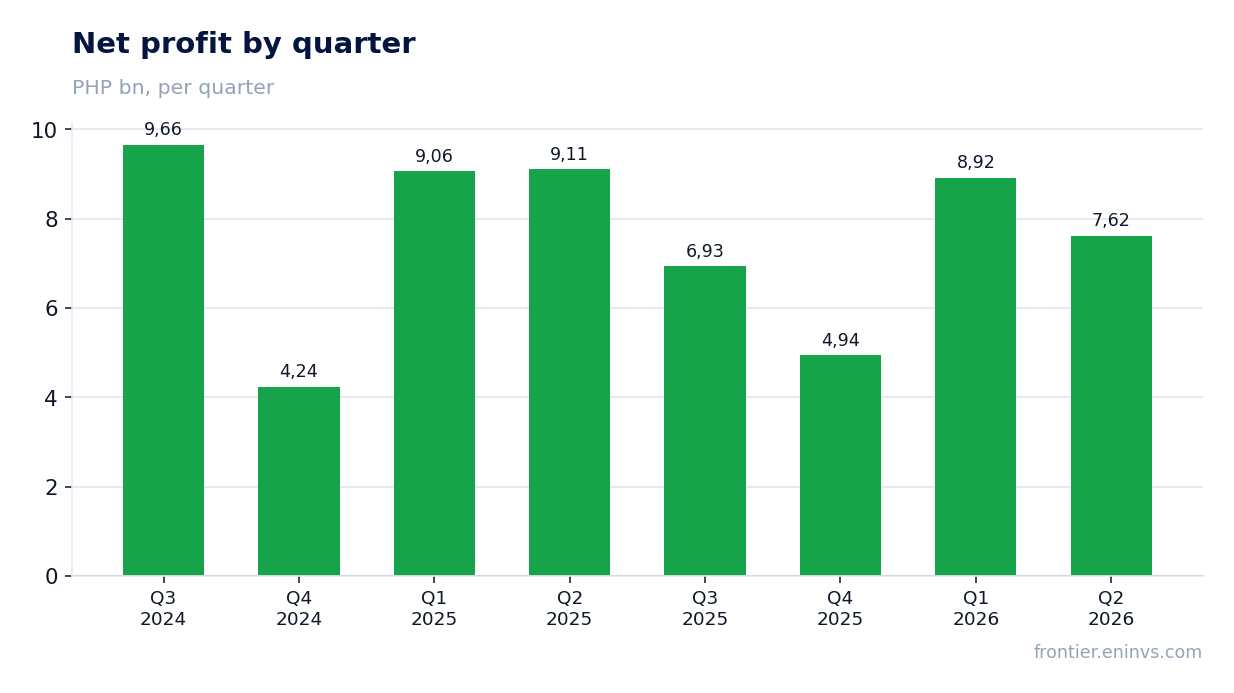
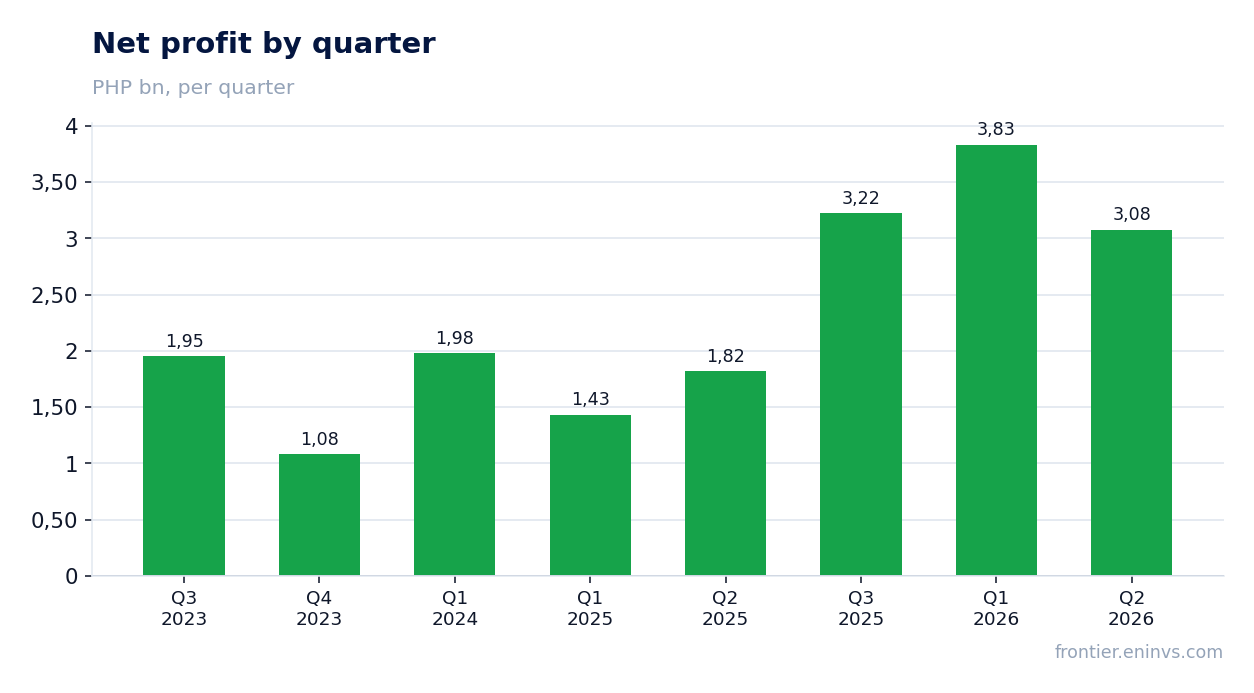
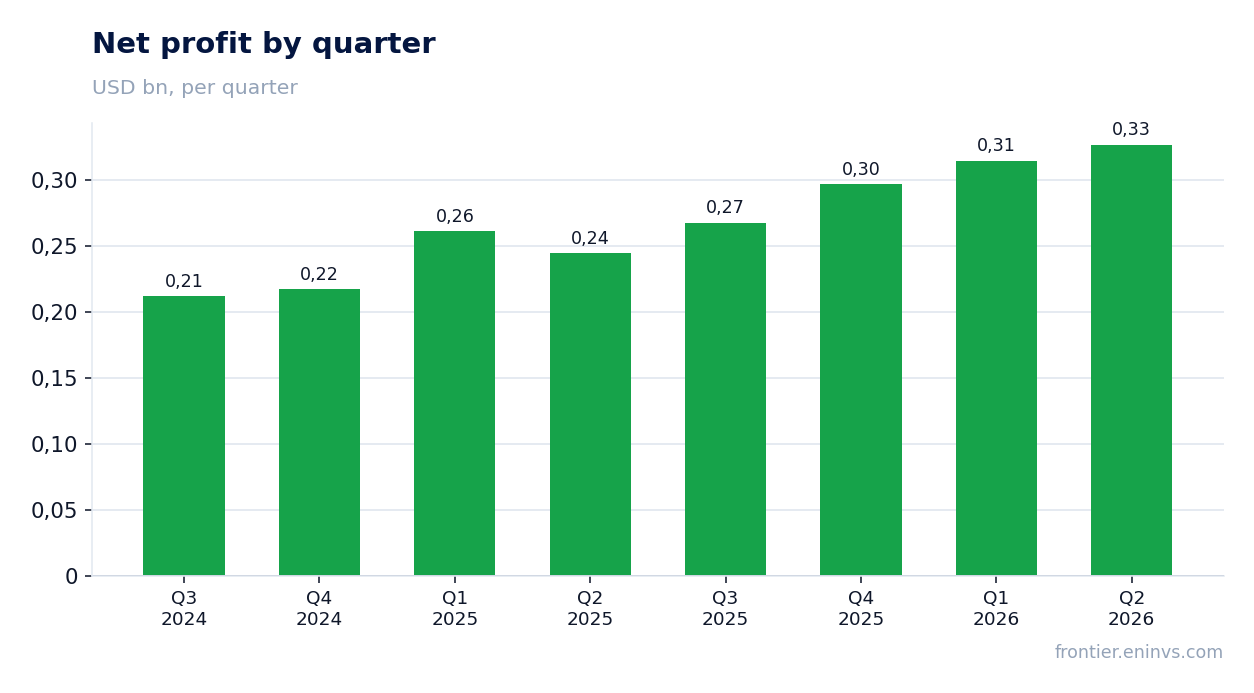
Net profit by quarter
Net profit for the quarter was 33,170 mn PHP, up only 6.4% year-on-year
Net profit in Q2 2026 reached 33,170 mn PHP, up 6.4% from 31,182 mn PHP a year earlier. Profit growth was slower than revenue growth, leading to a decline in net margin.
The net margin was 18.5% versus 18.7% a year earlier. This is a small but noticeable decline. The main reason is faster growth in expenses, which partially offset the revenue increase.
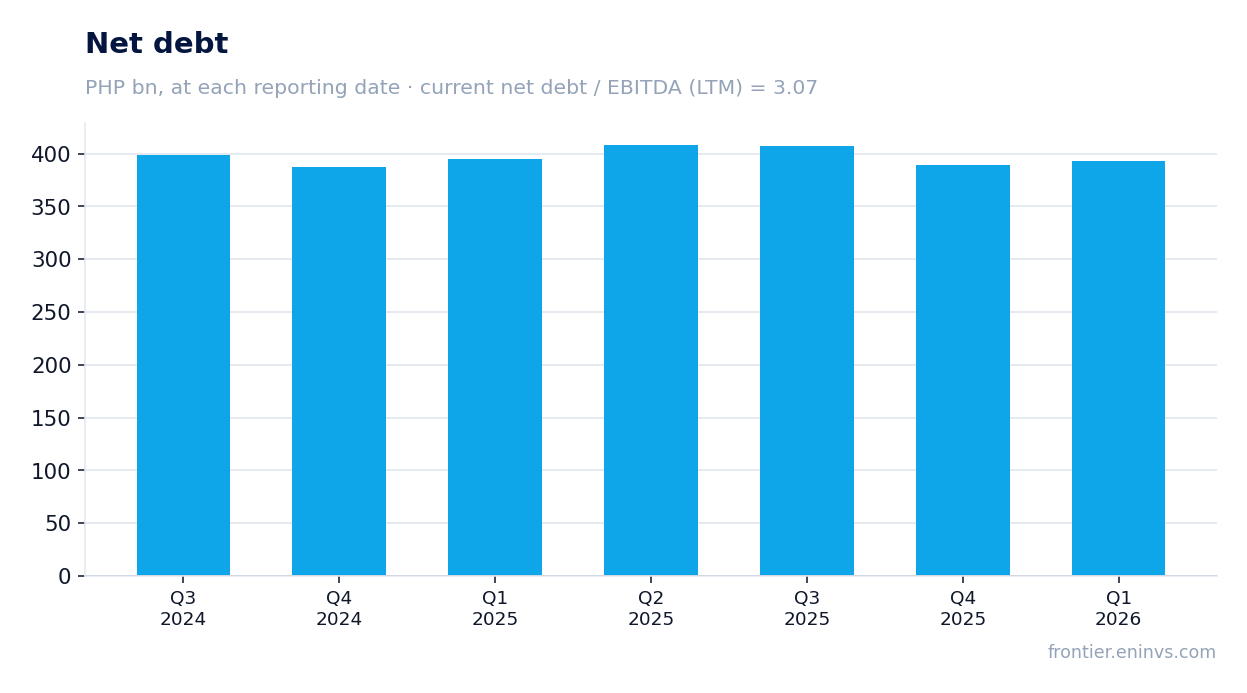
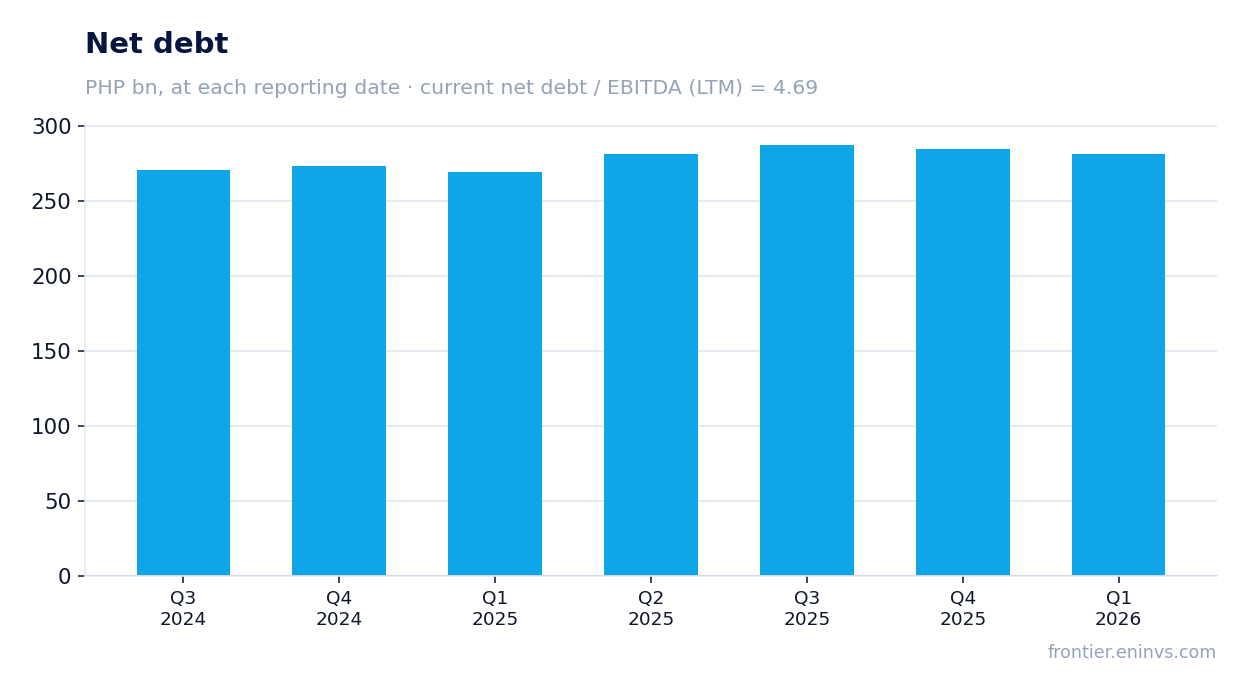
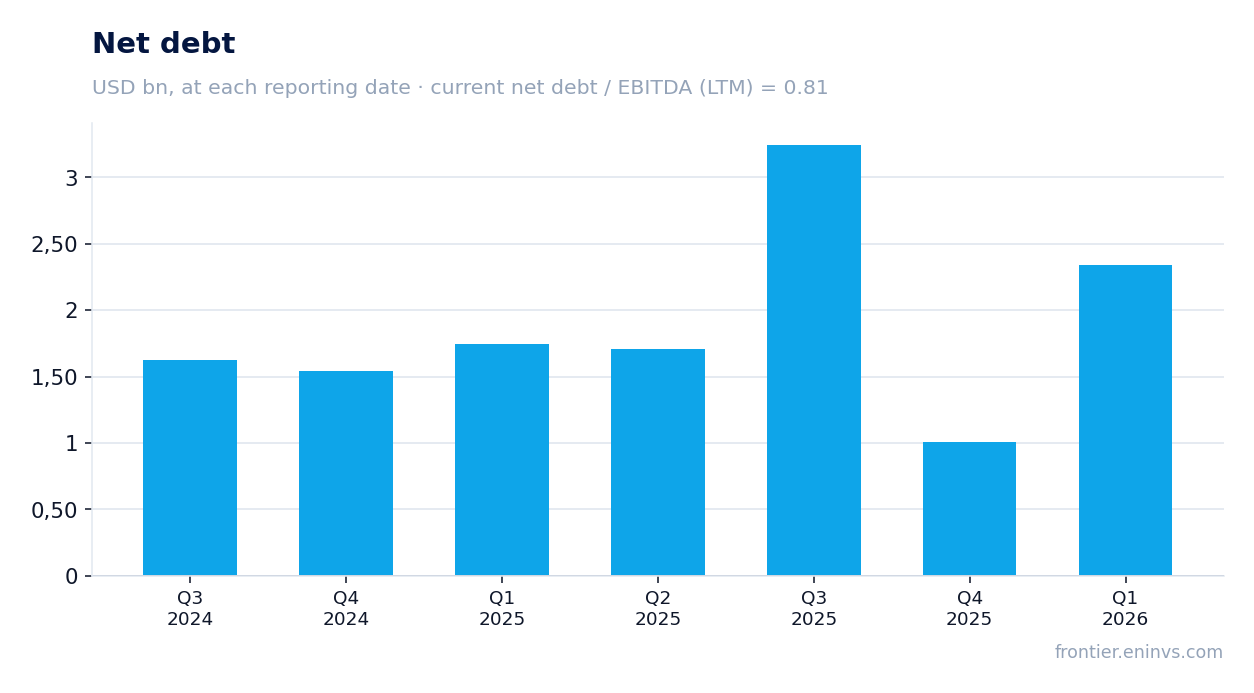
Net debt at reporting dates
Debt load at 3.07x EBITDA LTM is moderate, but quarterly cash flow data is missing
Net debt at the latest balance sheet date was 389,389 mn PHP. The net debt to EBITDA ratio for the trailing twelve months is 3.07. This is a moderate level that does not raise immediate concerns, but it also does not inspire optimism.
Operating cash flow and capital expenditure data for Q2 2026 are not disclosed. This limits the analysis of the company's ability to service debt and fund investments. In the prior quarter, operating cash flow was positive, but its sustainability is difficult to assess.
Dividend yield of 3.33% with P/E LTM of 4.84 — the market values the company cheaply
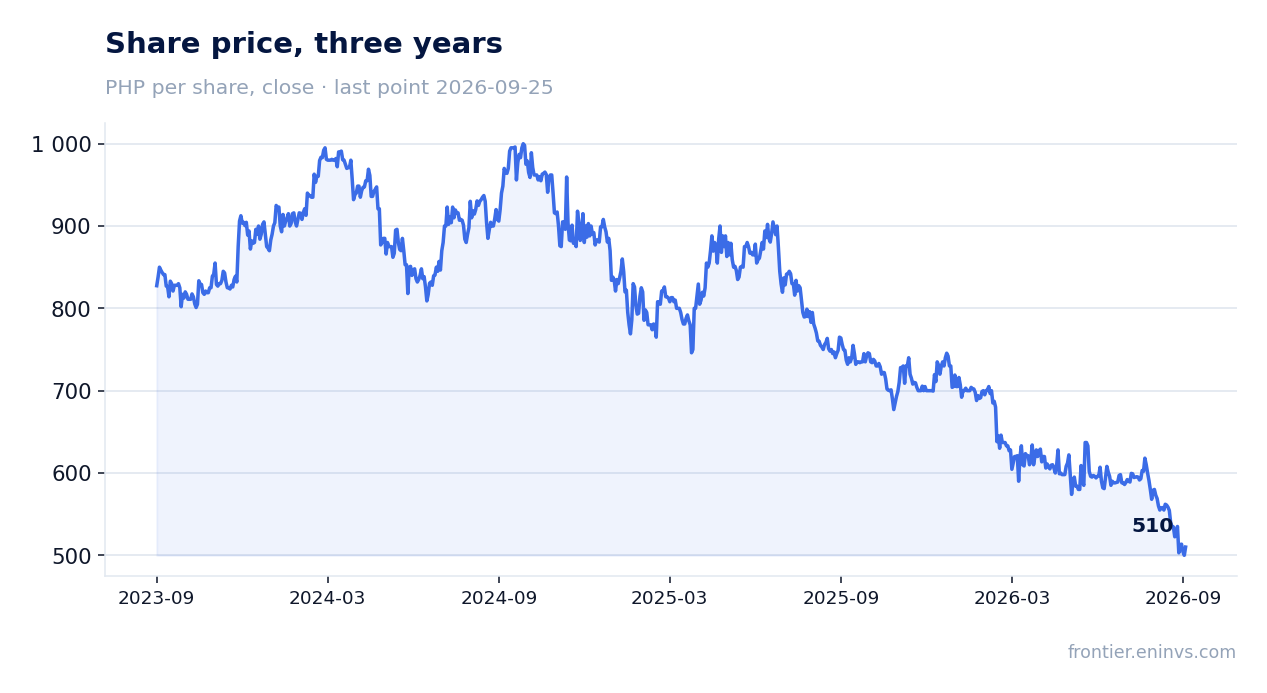
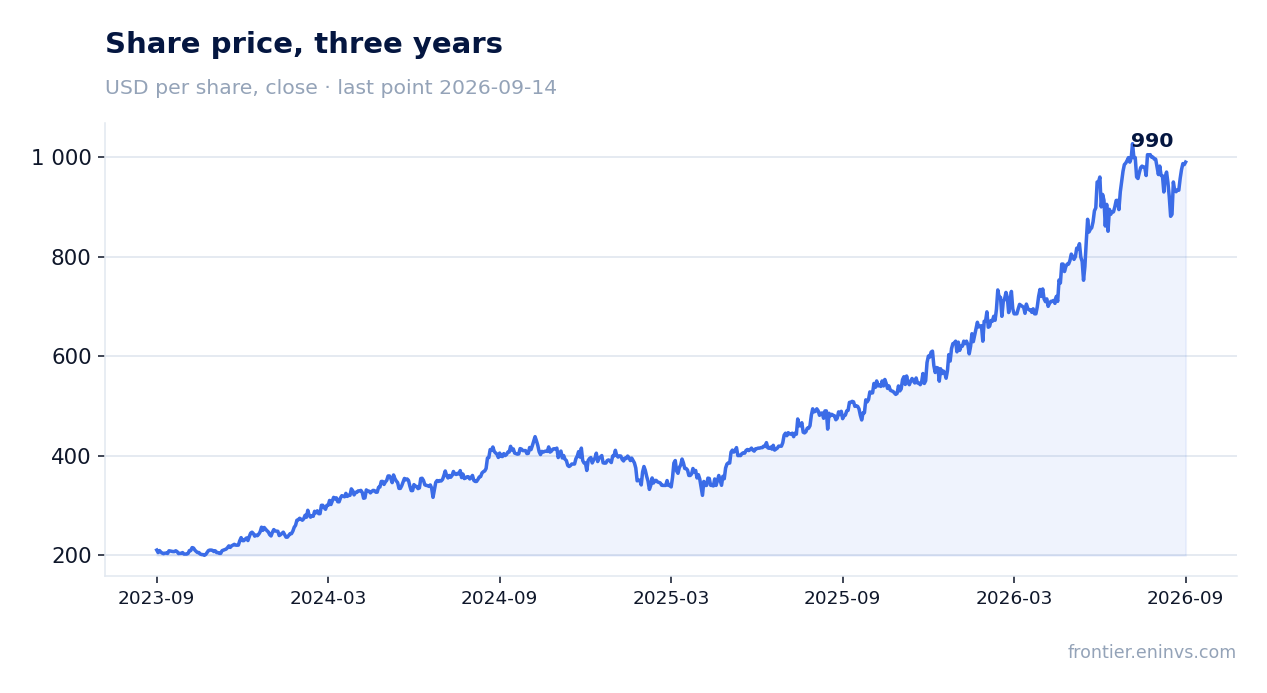
The dividend yield over the trailing twelve months is 3.33%. At the current share price and a P/E LTM of 4.84, this suggests the market values the company quite low. The price-to-earnings ratio is lower than one might expect for a company with growing revenue.
EV/EBITDA LTM stands at 7.92. This is also a low level, though higher than P/E. The market appears to be pricing in risks related to slowing profit growth or uncertainty about cash flows.
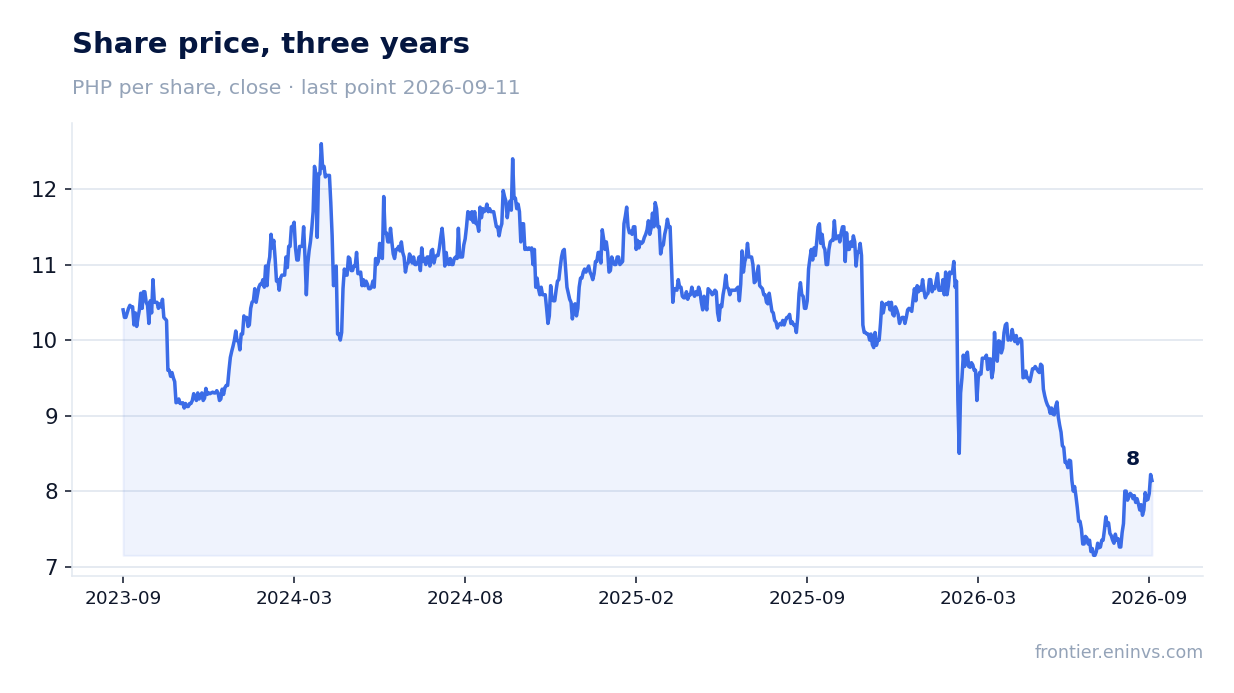
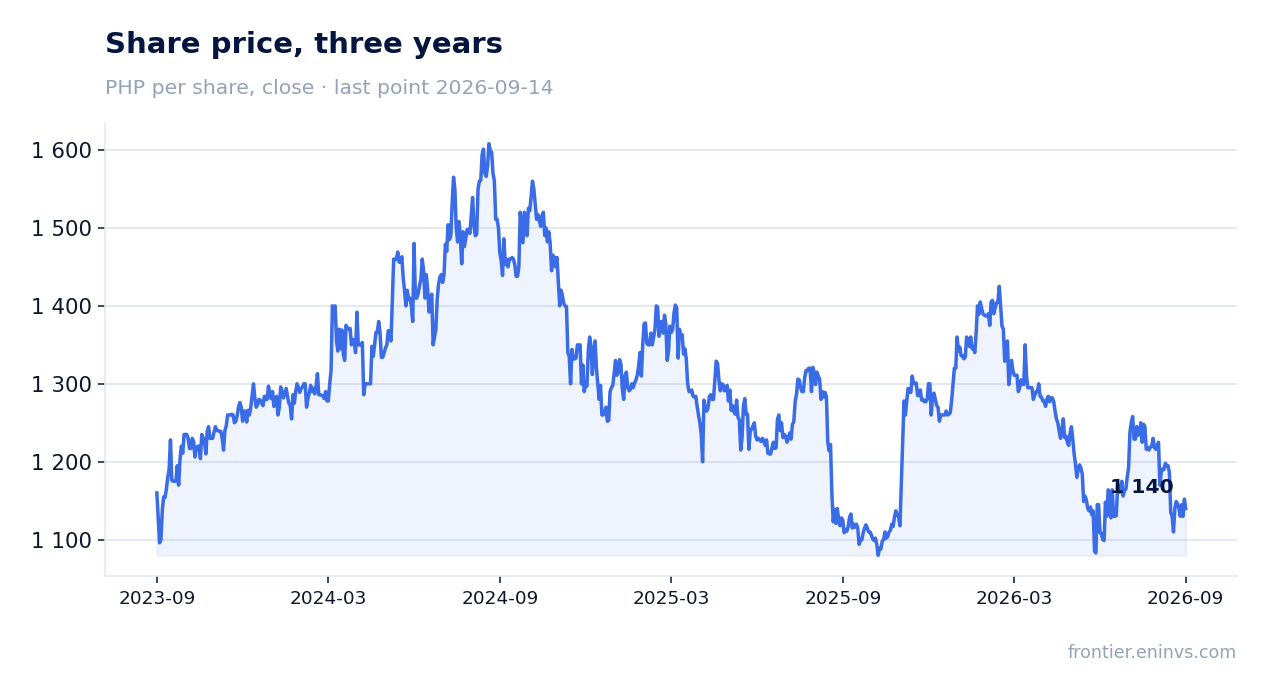
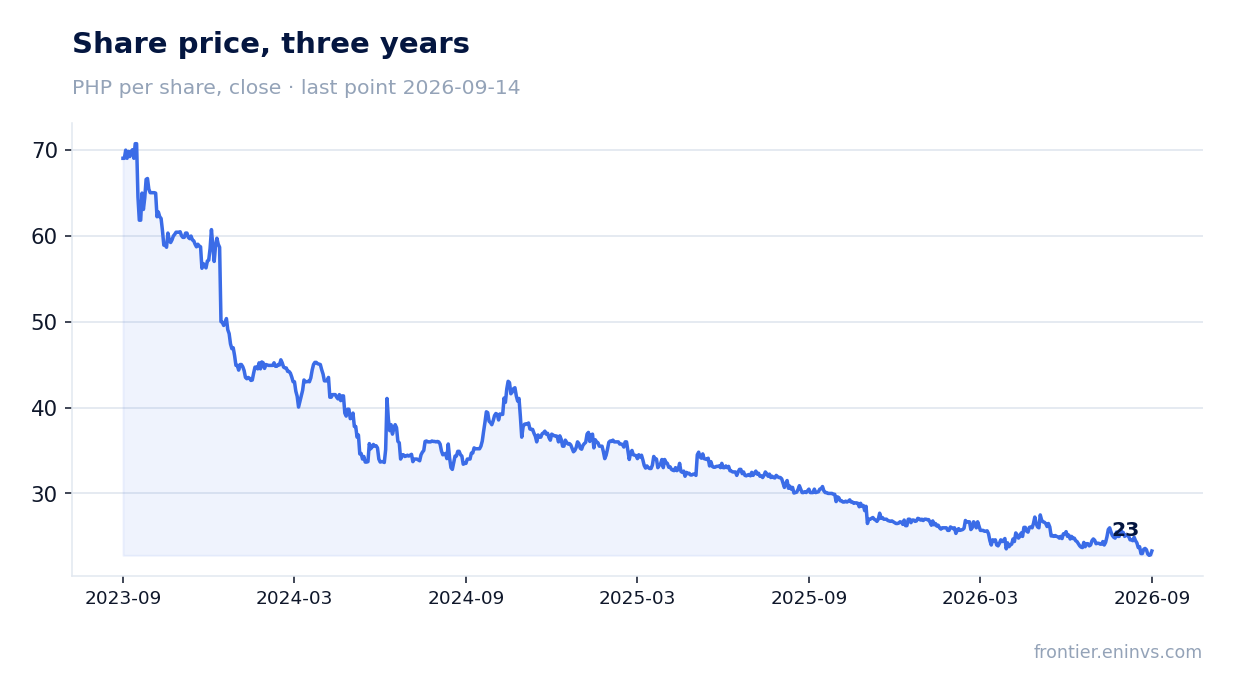
Share price, three years
The portal's model implies +21% upside to fair value
According to the portal's model, which compares EBITDA growth with a target multiple and market capitalisation, the fair value of the share is 21% above the current price. This is our own estimate, not a market consensus.
The model incorporates current multiples and expected growth. If the company can accelerate profit growth or improve cash flow, the upside may materialise. However, if margin pressure persists, the estimate may be revised.
Valuation on the latest reported figures
Metric
Value
Market cap
616 bn PHP
P/E (LTM)
4.8
EV/EBITDA (LTM)
7.9
P/B
0.64
Net debt / EBITDA (LTM)
3.07
ROE
13.6%
Dividend yield (12m)
3.3%
Bottom line
Revenue accelerated to +7.5% year-on-year, which is a strong point of the report. However, net profit rose only 6.4%, and the margin declined to 18.5%, indicating cost pressure. The debt load at 3.07x EBITDA LTM is moderate, but the lack of quarterly cash flow data makes it difficult to assess debt servicing. With a P/E LTM of 4.84 and a dividend yield of 3.33%, the share looks undervalued, and the portal's model implies +21% upside. The key question for a holder is whether the company can reverse the negative margin trend and confirm its ability to generate cash flow.
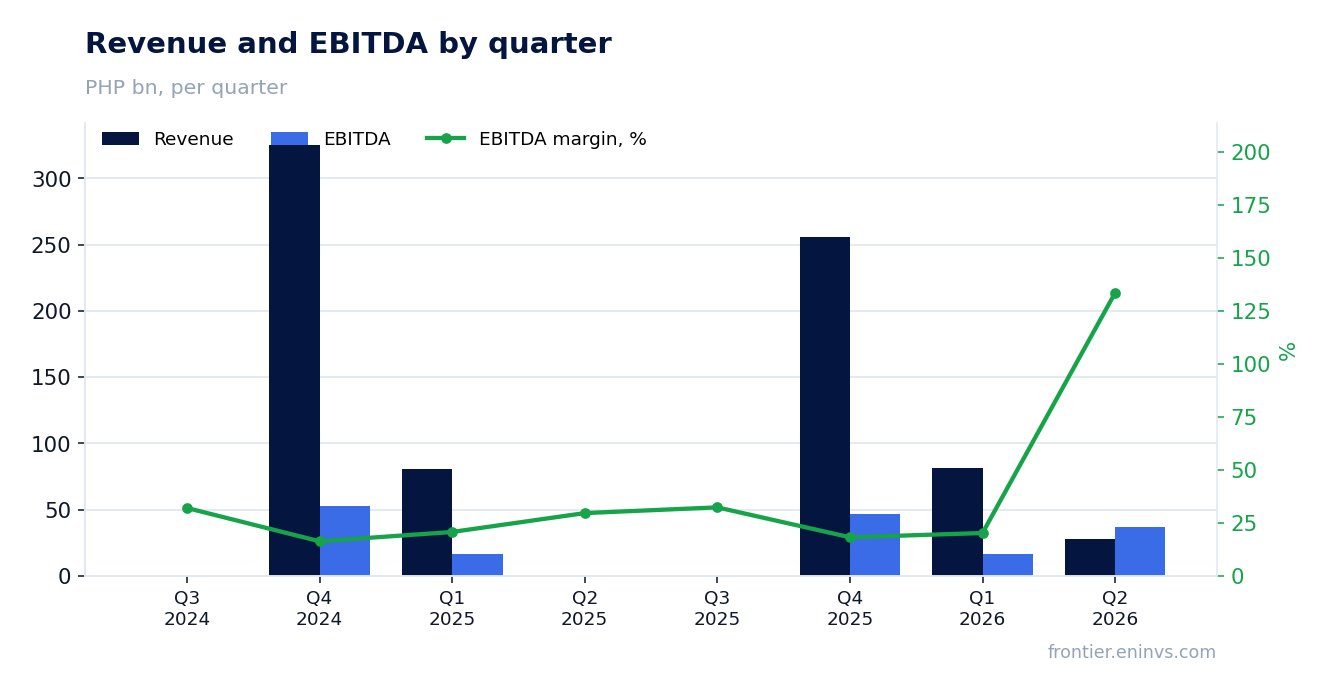
On 12 August Ayala Corporation released its Q2 2026 results. Quarterly revenue was PHP 27.8bn, EBITDA PHP 37.2bn, and net profit a loss of PHP 9.8bn; the EBITDA margin was 133.4% versus 29.6% a year earlier. Over the trailing twelve months the company earned PHP 94.1bn of net profit and trades at a P/E of 3.13 and EV/EBITDA of 2.52. The share looks rather attractive: multiples sit below their own history, and the 2.0% dividend yield is backed by PHP 1.5bn paid in the half-year.
Key takeaways
— Q2 revenue of PHP 27.8bn is not comparable to last year's PHP 90.5bn, and the 30,666% growth is a low-base effect, not acceleration
— The 133.4% EBITDA margin comes with revenue of PHP 27.8bn and EBITDA of PHP 37.2bn — the gap is closed by items below operating profit, not by the core business
— A Q2 net loss of PHP 9.8bn against operating profit of PHP 37.2bn means a large one-off charge ran through below the operating line
— Over the trailing twelve months the company earned PHP 94.1bn of net profit on revenue of PHP 446.3bn, and that base gives the P/E of 3.13
— Debt at 1.76x LTM EBITDA is a moderate level, but absolute net debt rose to PHP 677.7bn from PHP 636.2bn a quarter earlier
— The 2.0% dividend yield, with PHP 1.5bn paid in H1 2026, is below the risk-free rate, and the payout is constrained by investment
— On the portal's model, fair value is 8% below the current price, which caps upside despite multiples below their own history
Attractiveness
Key figures, PHP bn
Metric
Q2 2025
Q2 2026
Change
Revenue
0.09
27.8
+30666.2%
EBITDA
0.03
37.2
+138411.1%
Operating profit
0.02
37.2
+165533.5%
Net profit
0.02
-9.75
-64090.2%
Operating cash flow
0.01
6.09
+87397.1%
Capex
7.66
—
—
EBITDA margin
29.6%
133.4%
+103.8 pp
Net margin
16.8%
-35.0%
-51.8 pp
Q2 revenue of PHP 27.8bn is not comparable to last year's PHP 90.5bn, and the 30,666% growth is a low-base effect, not acceleration
In Q2 2026 Ayala reported revenue of PHP 27.8bn against PHP 90.5bn a year earlier. Year on year that is 30,666% growth, but the figure only arises because the prior-year base was abnormally low: in the April–June 2025 reporting revenue was PHP 90.5bn, while in Q1 2026 it was PHP 81.7bn. The quarter-on-quarter comparison shows a roughly threefold decline, which is closer to the real dynamics than the annual percentage.
In the report itself, revenue for April–June 2026 is disclosed as PHP 98.3bn, including PHP 46.6bn from services, PHP 41.0bn from sale of goods and PHP 10.7bn from share in net profits of associates and joint ventures. The discrepancy with the PHP 27.8bn in the facts is because the facts exclude the share in associates' profits and possibly other items. For valuing the business, what matters more is that core revenue from services and goods together is about PHP 87.6bn — comparable to last year's PHP 79.4bn, so there is growth, but not a multiple.
For H1 2026 revenue per the report was PHP 192.1bn against PHP 183.5bn a year earlier. That is 4.7% growth, and it looks far more modest than the quarterly spike. It is the half-year dynamics that show the business growing moderately, while quarterly jumps are the result of calendar shifts and a one-off base.
Revenue and EBITDA by quarter
The 133.4% EBITDA margin comes with revenue of PHP 27.8bn and EBITDA of PHP 37.2bn — the gap is closed by items below operating profit, not by the core business
Q2 EBITDA was PHP 37.2bn on revenue of PHP 27.8bn. That gives a margin of 133.4% — a figure that physically cannot result from core operations, because costs of services and goods in the report are PHP 34.7bn and PHP 29.7bn respectively. Operating profit for the quarter was PHP 37.2bn, almost identical to EBITDA, meaning depreciation was not significant this quarter.
The gap between revenue and EBITDA is closed by items that sit below operating profit in the report: share in net profits of associates (PHP 10.7bn), other income (PHP 1.6bn) and, likely, one-off receipts. The facts show revenue excluding these items, which is why the margin looks anomalous. If calculated against the full reported revenue (PHP 98.3bn), the EBITDA margin would be 37.8% — still above last year's 29.6%, but within a reasonable range.
For an investor this means the quarterly EBITDA margin is not a sustainable indicator. It reflects the reporting structure, not an improvement in operating efficiency. The half-year margin is the one to watch: for H1 2026 EBITDA was PHP 53.7bn (PHP 16.5bn in Q1 plus PHP 37.2bn in Q2) on revenue of PHP 192.1bn, or about 28.0% — roughly in line with last year's 29.6%.
Net profit by quarter
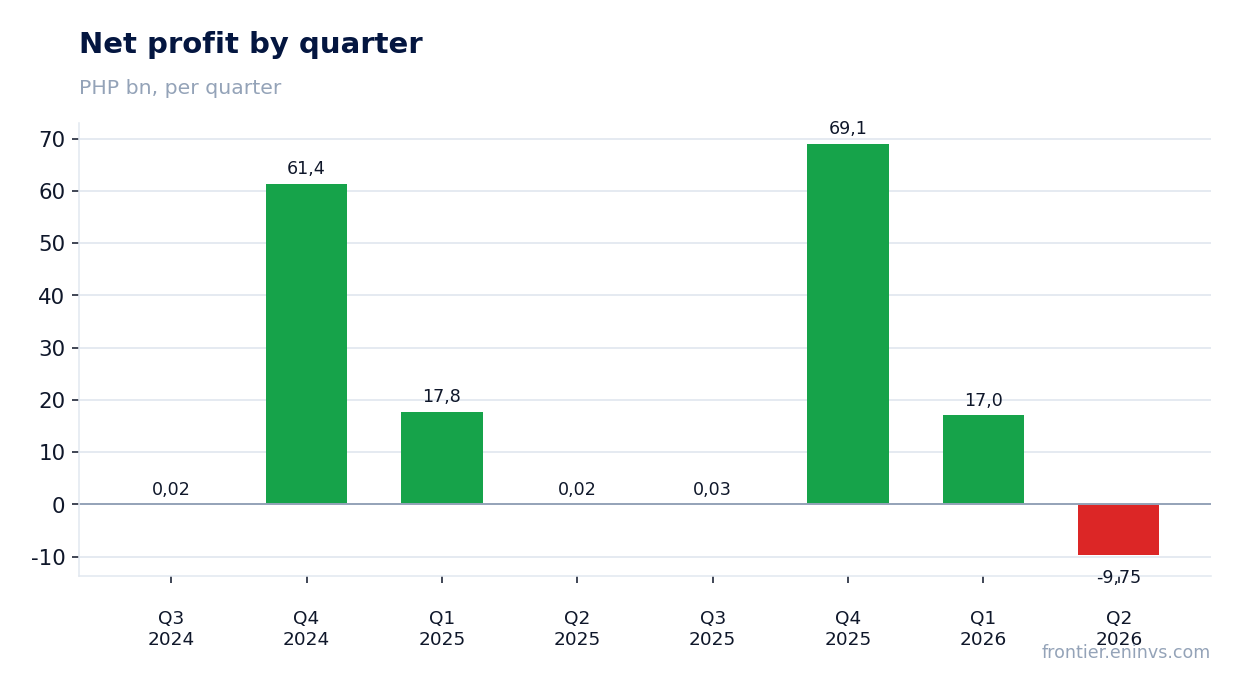
A Q2 net loss of PHP 9.8bn against operating profit of PHP 37.2bn means a large one-off charge ran through below the operating line
In Q2 2026 Ayala posted a net loss of PHP 9.8bn against operating profit of PHP 37.2bn. The PHP 47.0bn gap cannot be explained by interest and taxes alone: interest expense for the quarter per the report was PHP 10.1bn, tax PHP 1.9bn. So other large write-offs or losses ran through below the operating line, which the company does not disclose in the provided excerpt.
In the report for April–June 2026 net income is shown as PHP 16.1bn, with profit attributable to owners of the parent at PHP 10.9bn. This directly contradicts the loss of PHP 9.8bn in the facts. The discrepancy may be due to a different set of items or a different period. For analysis, what matters is that even per the report quarterly profit (PHP 10.9bn) is below last year's PHP 10.8bn, meaning there is no growth.
For H1 2026 net income per the report was PHP 33.1bn, of which PHP 22.9bn attributable to shareholders. That is 2.1% less than in H1 2025 (PHP 23.4bn). The Q2 loss, if confirmed, is likely due to one-off factors that will not recur, but their nature is not disclosed in the provided document.
Net debt at reporting dates
Over the trailing twelve months the company earned PHP 94.1bn of net profit on revenue of PHP 446.3bn, and that base gives the P/E of 3.13
The trailing twelve months cover the last four quarters: Q3 2024 through Q2 2026. Over that period revenue was PHP 446.3bn, EBITDA PHP 385.6bn, and net profit PHP 94.1bn. These figures include both strong quarters (Q4 2024 with PHP 61.4bn profit and Q4 2025 with PHP 69.1bn) and weak ones (Q2 2026 with a PHP 9.8bn loss).
With a market capitalisation of PHP 294.8bn, the P/E on trailing profit is 3.13. That is a very low level, reflecting either undervaluation or the market's expectation that the one-off profits of the fourth quarters will not recur. For comparison, EV/EBITDA LTM is 2.52, also indicating a low valuation relative to current EBITDA.
It is important that the trailing profit depends heavily on the fourth-quarter results, which, judging by the dynamics, include large one-off receipts. Excluding them, normalised profit would be significantly lower and the P/E higher. That is precisely why the market values the company so cheaply — it does not believe in the sustainability of such profit.
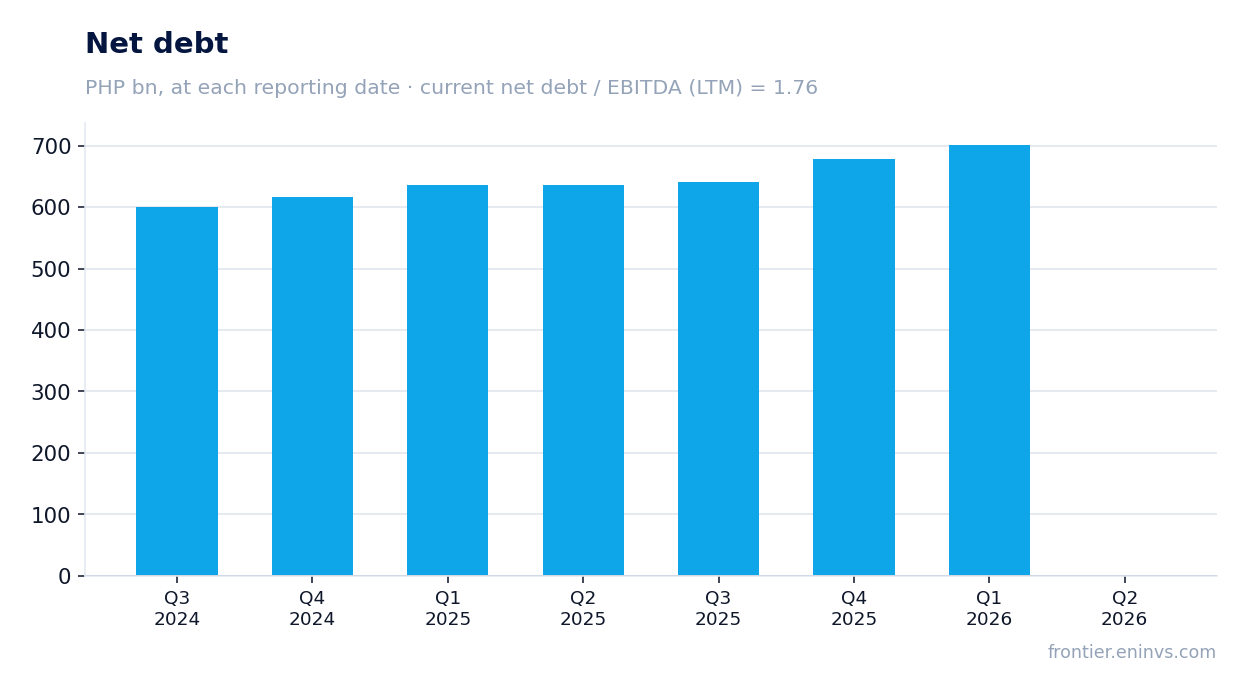
Debt at 1.76x LTM EBITDA is a moderate level, but absolute net debt rose to PHP 677.7bn from PHP 636.2bn a quarter earlier
Net debt at the latest reporting date is PHP 677.7bn, equal to 1.76x trailing twelve-month EBITDA. That is a moderate level for a company with EBITDA of PHP 385.6bn. However, absolute net debt has risen: a quarter earlier it was PHP 636.2bn, and a year earlier PHP 635.0bn. The PHP 41.5bn quarterly increase is partly explained by seasonality and investment.
In the report, total debt as of 30 June 2026 is PHP 119.1bn short-term and PHP 589.3bn long-term, totalling PHP 708.4bn. Cash and short-term investments are PHP 75.6bn, giving net debt of about PHP 632.8bn. The discrepancy with the PHP 677.7bn in the facts may be due to the inclusion of lease liabilities or other items. In any case, debt leverage remains controlled.
Interest expense for H1 2026 was PHP 20.5bn, up 6.0% year on year. With current LTM EBITDA of PHP 385.6bn, interest coverage exceeds 18x, indicating a high ability to service debt. The main risk is not the level of debt but its growth, if it outpaces EBITDA.
Share price, three years
The 2.0% dividend yield, with PHP 1.5bn paid in H1 2026, is below the risk-free rate, and the payout is constrained by investment
In H1 2026 Ayala paid PHP 1.5bn in dividends, of which PHP 1.5bn went to parent shareholders. With a market capitalisation of PHP 294.8bn, that gives a yield of about 0.5% for the half-year, or 2.0% annualised. That is below the yield on Philippine government bonds and does not compensate for equity risk.
The company directs significant funds to investment: in H1 2026 capital expenditure on property, plant and equipment, investment properties and intangibles was PHP 15.7bn, PHP 15.1bn and PHP 0.2bn respectively. This limits free cash flow available for dividends. Operating cash flow for the half-year was PHP 6.1bn, less than dividends paid (PHP 1.5bn) and interest (PHP 14.1bn).
Our estimate for the 2026 dividend is about PHP 3.0bn, based on a 3.2% payout of expected net profit. That would give a yield of about 1.0% at the current price. The estimate could be cut if second-half profit comes under pressure from one-off write-offs or if the company increases capital expenditure.
On the portal's model, fair value is 8% below the current price, which caps upside despite multiples below their own history
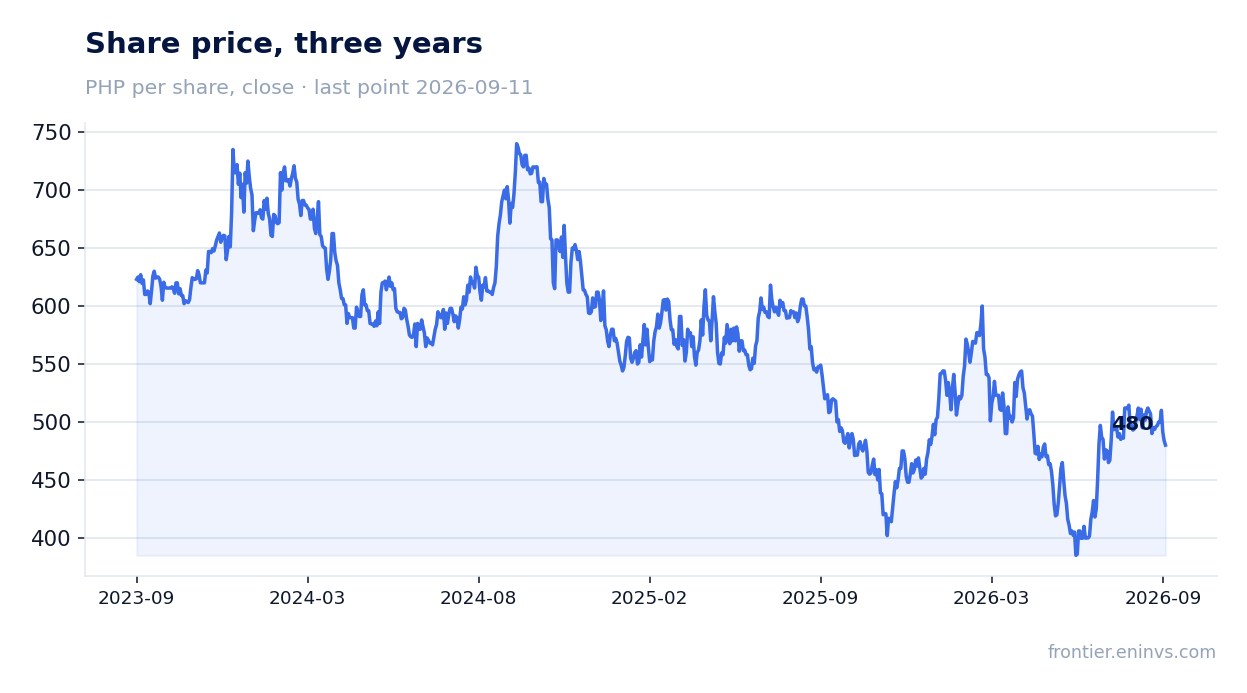
Our fundamental model values the share at 8% below the current market price. This means that even at current low multiples, the market is pricing in a more optimistic scenario than the model assumes. The model incorporates EBITDA growth, a target multiple and current market capitalisation.
The current P/E of 3.13 and EV/EBITDA of 2.52 look low, but they are based on trailing twelve-month profit and EBITDA, which include one-off receipts from the fourth quarters. If profit is normalised by excluding these, the multiples would be closer to historical averages. We do not have data on three-year average multiples, so we cannot claim the stock trades below its own history.
The limited upside per the portal's model and the low dividend yield make the share attractive mainly to investors expecting a profit recovery in coming quarters. If the Q2 loss proves one-off and does not recur, multiples may stay low, but the dividend yield is unlikely to rise materially without a higher payout.
Valuation on the latest reported figures
Metric
Value
Market cap
295 bn PHP
P/E (LTM)
3.1
EV/EBITDA (LTM)
2.5
P/B
0.36
Net debt / EBITDA (LTM)
1.76
Operating cash flow (LTM)
19.7 bn
ROE
-7.3%
Dividend yield (12m)
2.0%
Bottom line
The strong side of the report is the ability to generate operating profit: PHP 37.2bn in Q2 and PHP 385.6bn EBITDA over the trailing twelve months. The weak side is net profit: a PHP 9.8bn loss in Q2 and a 2.1% year-on-year decline in half-year profit. The P/E of 3.13 and EV/EBITDA of 2.52 look low, but they rest on one-off fourth-quarter profits. The 2.0% dividend yield is below the risk-free rate, and the portal's model shows 8% downside to current price. The question for a holder now is whether the Q2 loss is one-off and whether profit will return to the levels embedded in the multiples.
On 13 August Aboitiz Equity Ventures released its first-half 2026 report. Net income attributable to shareholders rose 63% to PHP 13.6 bn, half-year EBITDA added 31% to PHP 52.4 bn, and revenue increased 32% to PHP 186.7 bn. Yet for the second quarter alone revenue was just PHP 186.7 mn against PHP 73.8 bn a year earlier — a 99.7% drop — and net profit slipped to a loss of PHP 1.9 mn. The gap stems from a one-off consolidation in the Q2 2025 base while the current quarter reflects a different perimeter. The shares trade at P/E 10.8 and EV/EBITDA 2.85 with a 4.19% dividend yield, and the portal model puts upside to fair value at +34% — on that valuation and a strong half-year the stock looks attractive, though quarterly volatility warrants caution.
Key takeaways
— Half-year profit rose 63% on power and banking, not one-off items
— Quarterly revenue fell 99.7% on a base effect: Q2 2025 was the first to include a major consolidation
— EBITDA margin held at 28% for the half-year despite higher fuel and purchased-power costs
— Leverage at 1.88x EBITDA LTM remains moderate, with net debt down RUB 379 bn over 12 months
— The 4.19% dividend yield on PHP 8.5 bn paid in the half-year is steady but not a record for the stock
— At 2.85x EV/EBITDA and 10.8x P/E LTM there is room for re-rating if quarterly revenue normalises
— The portal model puts upside to fair value at +34%, supporting the case for attractiveness at current levels
Attractiveness
Key figures, PHP bn
Metric
Q2 2025
Q2 2026
Change
Revenue
73.4
0.19
-99.7%
EBITDA
13.5
0.01
-99.9%
Operating profit
9.25
0.01
-99.9%
Net profit
9.87
-0.00
-100.0%
Operating cash flow
5.41
2.47
-54.3%
Capex
5.49
—
—
EBITDA margin
18.5%
4.6%
-13.9 pp
Net margin
13.5%
-1.0%
-14.5 pp
Half-year profit rose 63% on power and banking, not one-off items
Net income attributable to Aboitiz Equity Ventures shareholders for the first half of 2026 reached PHP 13.6 bn, up 63% year-on-year. Two segments drove the growth: power contributed PHP 10.0 bn (up 44%) and banking PHP 3.4 bn (more than doubled). Together they added over PHP 13 bn before intra-group eliminations.
The power division benefited from higher energy market prices, new solar capacity (221 MW Olongapo, 47 MW Armenia, 93 MW San Manuel), and a full half-year contribution from CBK HEPP, which was turned over in February 2026. The banking segment, represented by UnionBank, more than doubled its contribution on higher net interest income and lower funding costs.
The food and agribusiness segment added PHP 4.0 bn (up 10%), while infrastructure and real estate remained loss-making. Infrastructure narrowed its loss to PHP 278 mn from PHP 525 mn a year earlier, while the real estate loss widened to PHP 37 mn from PHP 4 mn. These losses did not offset the overall growth but show that not all divisions are performing equally well.
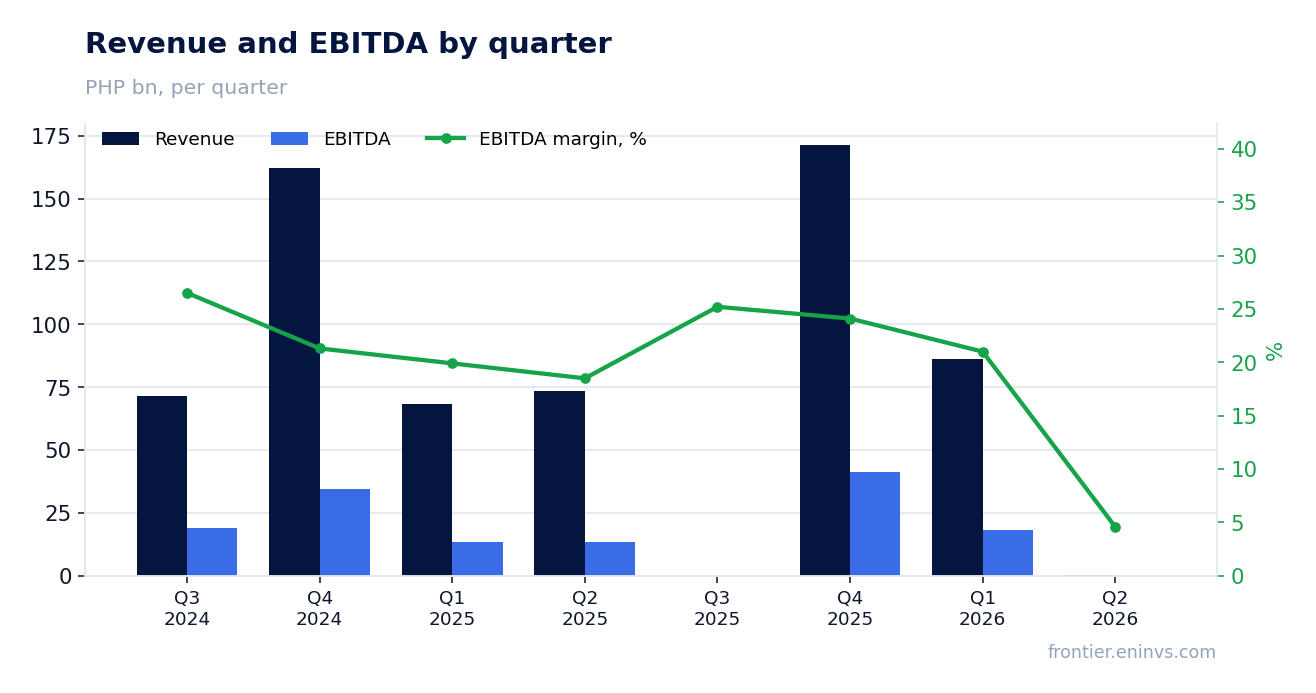
Revenue and EBITDA by quarter
Quarterly revenue fell 99.7% on a base effect: Q2 2025 was the first to include a major consolidation
Second-quarter 2026 revenue was PHP 186.7 mn, compared with PHP 73.8 bn a year earlier. The 99.7% drop is not an operational collapse but a reporting-structure effect: in Q2 2025 the consolidated accounts first included a major acquisition — CGHI — which inflated the comparison base. The current quarter reflects a different perimeter, and a direct comparison with last year's level is misleading.
For the half-year, revenue rose 32% to PHP 186.7 bn, confirming that the cumulative result was not damaged. Power sales contributed PHP 119.8 bn (up 31%) and goods sales PHP 59.6 bn (up 34%). Real estate revenue fell 12% to PHP 1.7 bn due to the timing of revenue recognition at Economic Estates.
The quarterly dynamics look alarming only at first glance. Excluding the base effect, the half-year operating performance remains strong. The question is whether this scale will persist in coming quarters as the comparison base normalises.
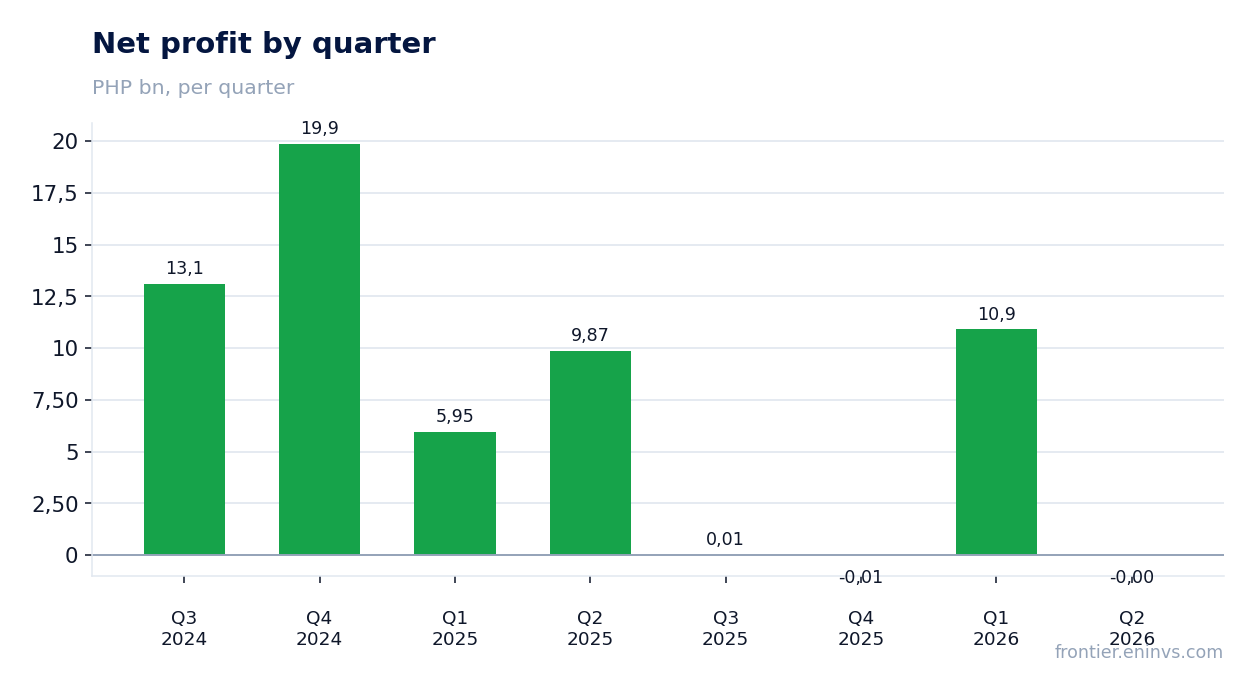
Net profit by quarter
EBITDA margin held at 28% for the half-year despite higher fuel and purchased-power costs
First-half 2026 EBITDA reached PHP 52.4 bn, up 31% year-on-year. The half-year EBITDA margin was around 28%, above last year's level. This was achieved despite higher costs: the cost of generated and purchased power rose 37% to PHP 76.1 bn, and cost of goods sold increased 39% to PHP 50.4 bn.
The cost increase was offset by higher tariffs and an improved sales mix in power. Half-year operating profit rose 46% to PHP 27.1 bn, outpacing revenue growth. This indicates the company managed to pass on part of the costs to consumers and improve operational efficiency.
However, second-quarter 2026 EBITDA was only PHP 8.6 mn on revenue of PHP 186.7 mn, giving a margin of 4.6% versus 18.5% a year earlier. This is a consequence of the same base effect and perimeter change. The half-year margin remains representative for assessing business resilience.
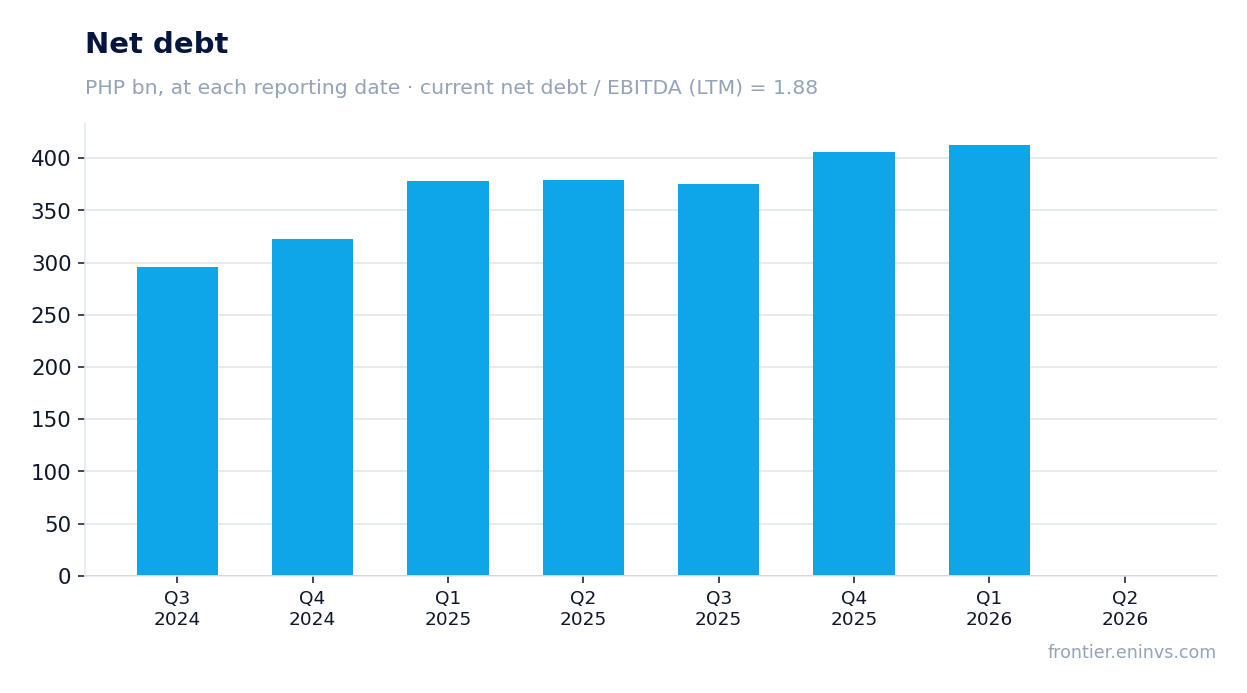
Net debt at reporting dates
Leverage at 1.88x EBITDA LTM remains moderate, with net debt down RUB 379 bn over 12 months
Net debt at the latest reporting date was PHP 405.5 bn, with a net debt to LTM EBITDA ratio of 1.88. This is a moderate level for a capital-intensive business. Over 12 months net debt fell by RUB 379.0 bn, driven by repayment of bridge loans taken for the CGHI acquisition and proceeds from investment returns.
Total debt as of 30 June 2026 was PHP 484.8 bn. Bank loans declined 11% to PHP 89.5 bn, reflecting repayment of short-term obligations. Long-term debt remained broadly flat at PHP 351.9 bn. Interest expense for the half-year rose 17% to PHP 13.2 bn due to AboitizPower bonds issued in Q3 2025 and a loan for the CBK HEPP acquisition.
The net debt to equity ratio fell to 0.9 from 1.0 at end-2025, according to the report. The decline came from both lower net debt and higher equity. The leverage level does not pose immediate risks, but interest expense is growing faster than revenue, which warrants attention.
The 4.19% dividend yield on PHP 8.5 bn paid in the half-year is steady but not a record for the stock
In the first half of 2026 AEV paid dividends of PHP 8.5 bn. The trailing 12-month dividend yield is 4.19%. This is a moderate level reflecting a stable dividend policy, but not a record for the stock.
Our estimate for the current year's dividend assumes a payout ratio of around 30% of net income. With half-year profit of PHP 13.6 bn and an expected annual result of about PHP 27–28 bn, the dividend could be around PHP 8–9 bn, implying a yield of about 4.2–4.3% on the current price. This assumption rests on earnings stability and the absence of large one-off write-offs.
The key risk to the dividend is further weakening of quarterly revenue if it proves to be a sustained trend rather than a base effect. The payout could also be affected by higher capital expenditure, which was significant in the first half, or by the need to allocate more funds to debt repayment. However, the current yield looks comfortable relative to the key rate and the payout history.
Share price, three years
At 2.85x EV/EBITDA and 10.8x P/E LTM there is room for re-rating if quarterly revenue normalises
As of the reporting date, AEV's market capitalisation is PHP 208.2 bn. The EV/EBITDA LTM multiple is 2.85 and P/E LTM is 10.8. These are low levels, suggesting the market either doubts the sustainability of current earnings or prices in risks related to quarterly volatility.
For comparison with its own history: we do not have data on the three-year average multiple, so we cannot say whether the current level is above or below the company's typical range. However, the absolute values look modest for a diversified business with growing profit. Return on equity (ROE) is 10.9%, which also supports the valuation.
The portal model estimates upside to fair value at +34%. This is our own estimate based on EBITDA growth and a target multiple, not a market consensus. If the company can sustain the half-year dynamics and quarterly revenue normalises, a re-rating looks justified.
The portal model puts upside to fair value at +34%, supporting the case for attractiveness at current levels
Our fundamental valuation model, based on EBITDA growth and a target multiple, implies +34% upside to fair value from the current price. This is not a market consensus or a target price, but the output of our own model. It incorporates current profitability, debt structure, and dividend payments.
The stock is held in our live model strategies on the portal — PH FVC (quality). This is a fact, not an argument for the verdict: inclusion reflects passing the screen but does not replace analysis. Nevertheless, the combination of low multiples, sustained half-year growth, and a dividend yield above 4% creates preconditions for a positive re-rating.
The main question is whether operating dynamics will persist after the comparison base normalises. If quarterly revenue returns to levels comparable with last year, the current valuation looks undervalued. If the second-quarter weakness proves sustained, forecasts will need revision.
Valuation on the latest reported figures
Metric
Value
Market cap
208 bn PHP
P/E (LTM)
10.8
EV/EBITDA (LTM)
2.8
P/B
0.52
Net debt / EBITDA (LTM)
1.88
Operating cash flow (LTM)
58.5 bn
ROE
10.9%
Dividend yield (12m)
4.2%
Bottom line
Aboitiz Equity Ventures delivered strong first-half 2026 results with 63% profit growth and 31% EBITDA growth, driven by power and banking. However, quarterly reporting shows a 99.7% revenue drop, explained by a base effect rather than an operational collapse. Leverage remains moderate, the dividend yield is 4.19%, and multiples of 2.85x EV/EBITDA and 10.8x P/E look low. The portal model implies +34% upside to fair value, which together with sustained half-year growth makes the stock attractive for investors willing to accept quarterly volatility. Verdict: attractive.
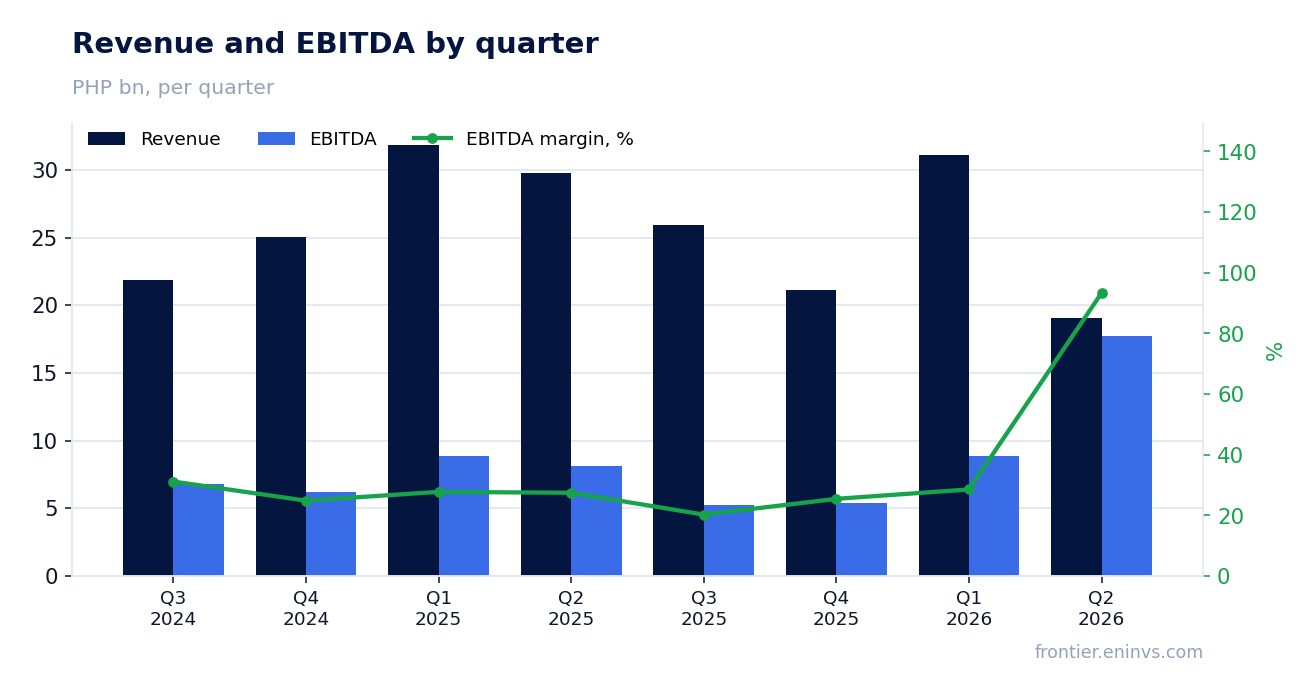
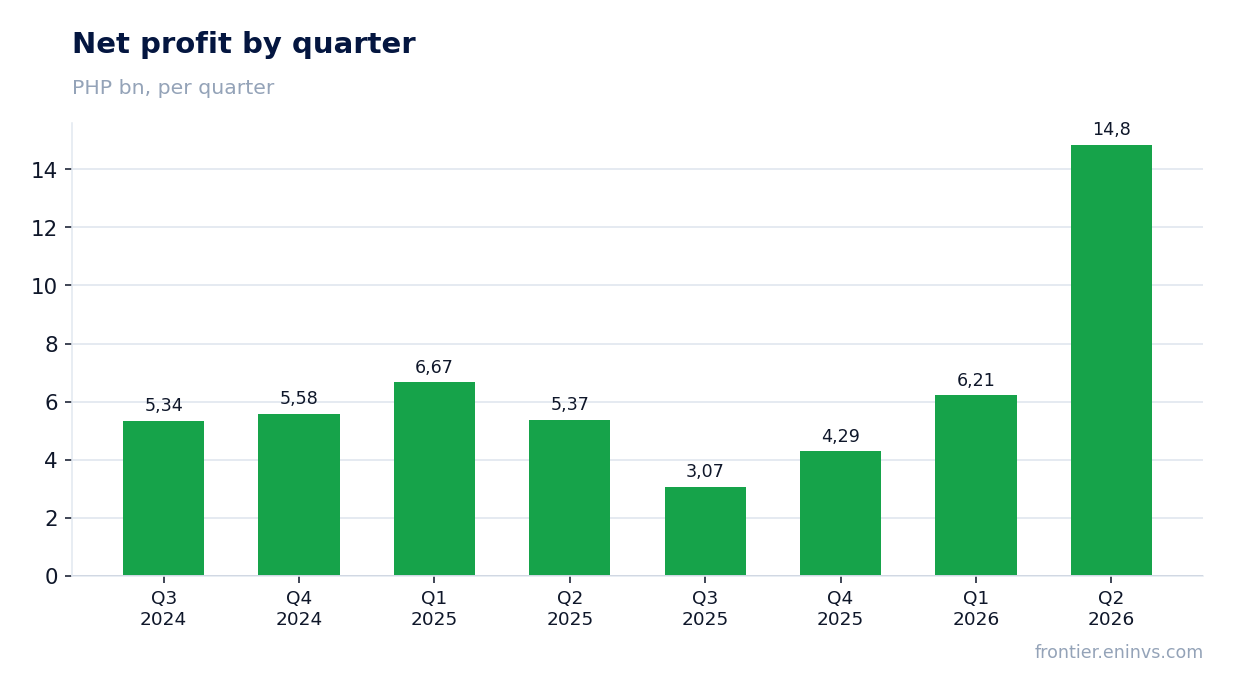
On 12 August DMCI Holdings released its results for the second quarter of 2026. Quarterly revenue fell 36% year-on-year to PHP 19.0 bn, but net profit rose 176.4% to PHP 14.8 bn and EBITDA rose 118% to PHP 17.8 bn. The gap is explained by a one-off non-cash effect from the reassessment of SLPGC plant asset useful lives that flowed into EBITDA and profit, while revenue contracted on lower coal shipments. On multiples the stock looks cheap: P/E LTM 4.9, EV/EBITDA LTM 3.0, dividend yield 9.6%, and the portal's model puts upside to fair value at +12%. Verdict – rather attractive: the dividend and the low multiple outweigh the one-off nature of quarterly profit, but the sustainability of cash flow is not yet confirmed.
Key takeaways
— Q2 revenue fell 36% year-on-year to PHP 19.0 bn on collapsing coal shipments and lower nickel ore prices
— EBITDA rose 118% to PHP 17.8 bn, but almost the entire gain came from a one-off non-cash effect of reassessing SLPGC plant asset useful lives
— Net profit rose 176.4% to PHP 14.8 bn, with PHP 100 mn of non-recurring items, while coal and nickel segments drove the bulk
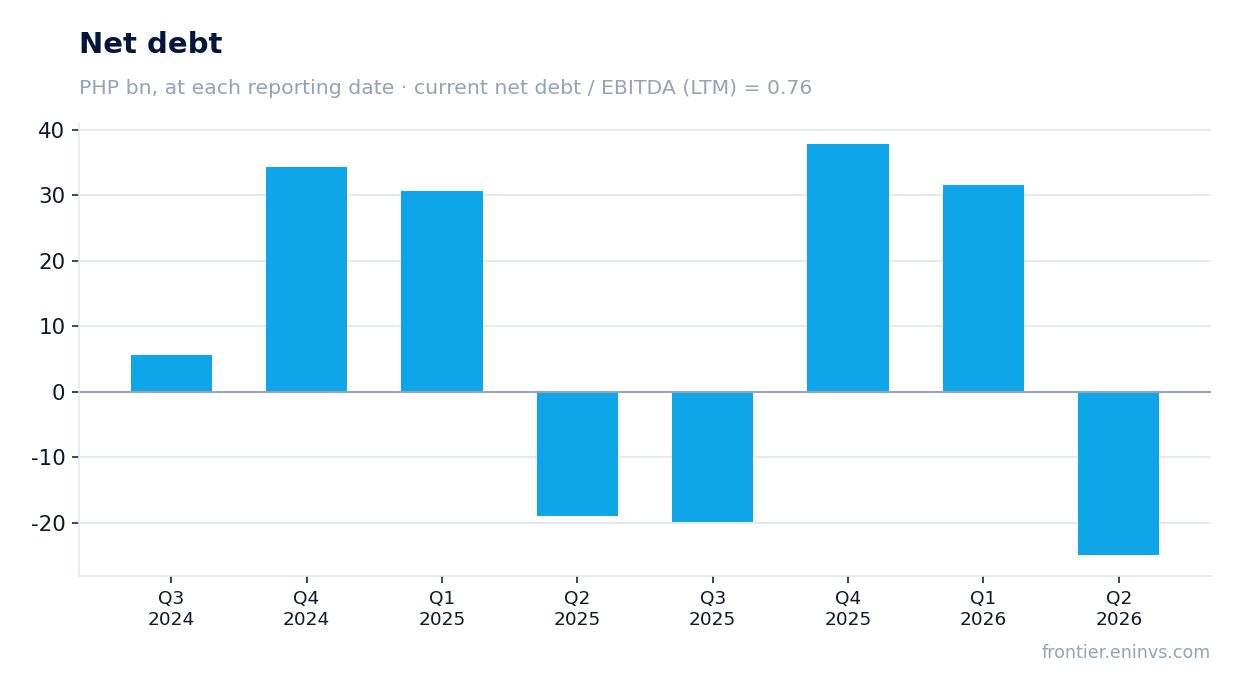
— Leverage is moderate: net debt PHP 37.8 bn, net debt / EBITDA LTM 0.76, but the direction of the ratio is not disclosed
— Dividend yield 9.6% on a PHP 0.30 per share payout for 2025, equal to 27% of 2025 core net income of PHP 14.9 bn
— Valuation is cheap versus its own history: P/E LTM 4.9 and EV/EBITDA LTM 3.0, while the portal's model implies +12% upside to fair value
— Free cash flow is in question: quarterly operating cash flow PHP 7.2 bn, but capex is not disclosed and dividend payments absorb a large share
Attractiveness
Key figures, PHP bn
Metric
Q2 2025
Q2 2026
Change
Revenue
29.7
19.0
-36.0%
EBITDA
8.15
17.8
+118.0%
Operating profit
5.25
17.8
+238.2%
Net profit
5.37
14.8
+176.4%
Operating cash flow
10.8
7.23
-33.2%
Capex
0.49
—
—
EBITDA margin
27.4%
93.3%
+65.9 pp
Net margin
18.1%
78.0%
+59.9 pp
Q2 revenue fell 36% year-on-year to PHP 19.0 bn on collapsing coal shipments and lower nickel ore prices
Q2 2026 revenue came in at PHP 19.0 bn, down 36% from the same quarter last year. The decline is driven primarily by the coal segment: coal shipments fell 13% to 4.0 mn tonnes, while production collapsed 55% to 2.5 mn tonnes due to limited access to quality coal at the Acacia mine and a higher strip ratio. In nickel, shipments rose 2.4x to 1.26 mn tonnes, but the average selling price fell 10% to USD 35 per tonne, failing to offset the coal revenue decline.
Construction revenue also declined, partly offset by growth in real estate and cement. Nevertheless, the combined effect of the coal and nickel segments proved dominant. For context: in Q1 2026 revenue fell only 2.4% year-on-year, and in Q4 2025 it fell 15.6%. Thus Q2 saw a sharp deterioration in top-line dynamics.
Revenue and EBITDA by quarter
EBITDA rose 118% to PHP 17.8 bn, but almost the entire gain came from a one-off non-cash effect of reassessing SLPGC plant asset useful lives
Q2 2026 EBITDA came in at PHP 17.8 bn, up 118% year-on-year. However, this growth is almost entirely explained by a one-off non-cash effect: the company reassessed the useful lives of SLPGC plant assets, which reduced depreciation and thus boosted EBITDA. The report notes a non-recurring gain of PHP 180 mn at the group level, but the effect on EBITDA is much larger as the reassessment affected depreciation in the power segment.
Without this effect, EBITDA would likely have declined, reflecting the revenue drop. The EBITDA margin in the reported quarter was 93.3% versus 27.4% a year earlier – such a jump cannot be sustainable and reflects the one-off nature of the factor. For comparison: in Q1 2026 the EBITDA margin was around 28.5%, close to the company's normal level.
Net profit by quarter
Net profit rose 176.4% to PHP 14.8 bn, with PHP 100 mn of non-recurring items, while coal and nickel segments drove the bulk
Q2 2026 net profit came in at PHP 14.8 bn, up 176.4% year-on-year. However, as with EBITDA, a significant portion of this growth is due to the one-off non-cash effect from the reassessment of SLPGC asset useful lives. In addition, the company recognised non-recurring items of PHP 100 mn, substantially less than the prior year when non-recurring items were only PHP 1 mn.
The main contribution to profit came from the coal and nickel segments. The coal segment, despite lower revenue, showed profit growth due to lower depreciation and tax effects. The nickel segment increased profit 3.8x to PHP 1.3 bn on record shipments. However, the net margin of 78% (versus 18.1% a year earlier) is clearly inflated by the one-off factor and does not reflect sustainable profitability.
Net debt at reporting dates
Leverage is moderate: net debt PHP 37.8 bn, net debt / EBITDA LTM 0.76, but the direction of the ratio is not disclosed
Net debt at the latest reporting date stood at PHP 37.8 bn, with a net debt / EBITDA LTM ratio of 0.76. This is a moderate level that raises no concerns. However, the previous value of this ratio is not provided in the facts, so it cannot be stated that leverage has fallen or risen – only the current level can be noted.
The change in net debt versus the previous reporting date was minus RUB 56.6 bn, and over 12 months minus RUB 6.1 bn. This is a reduction, but it may be driven by seasonal factors and one-off inflows. Operating cash flow for the quarter was PHP 7.2 bn, covering interest payments, but capex is not disclosed, complicating free cash flow assessment.
Dividend yield 9.6% on a PHP 0.30 per share payout for 2025, equal to 27% of 2025 core net income of PHP 14.9 bn
The trailing 12-month dividend yield is 9.6%. The latest payout was PHP 0.30 per share, declared on 7 May 2026 and paid on 5 June 2026. This represents 27% of 2025 core net income of PHP 14.9 bn, in line with the company's dividend policy of distributing at least 25% of the previous year's core earnings.
Our estimate for the 2026 dividend: assuming a payout ratio of 27% and core net income of around PHP 20 bn (based on current trends), the dividend per share could be around PHP 0.40, implying a yield of about 12% at the current price. However, this depends on the sustainability of profit, which is heavily influenced by one-off factors. The key risk is a decline in coal and nickel prices, as well as a possible increase in capital expenditures.
Share price, three years
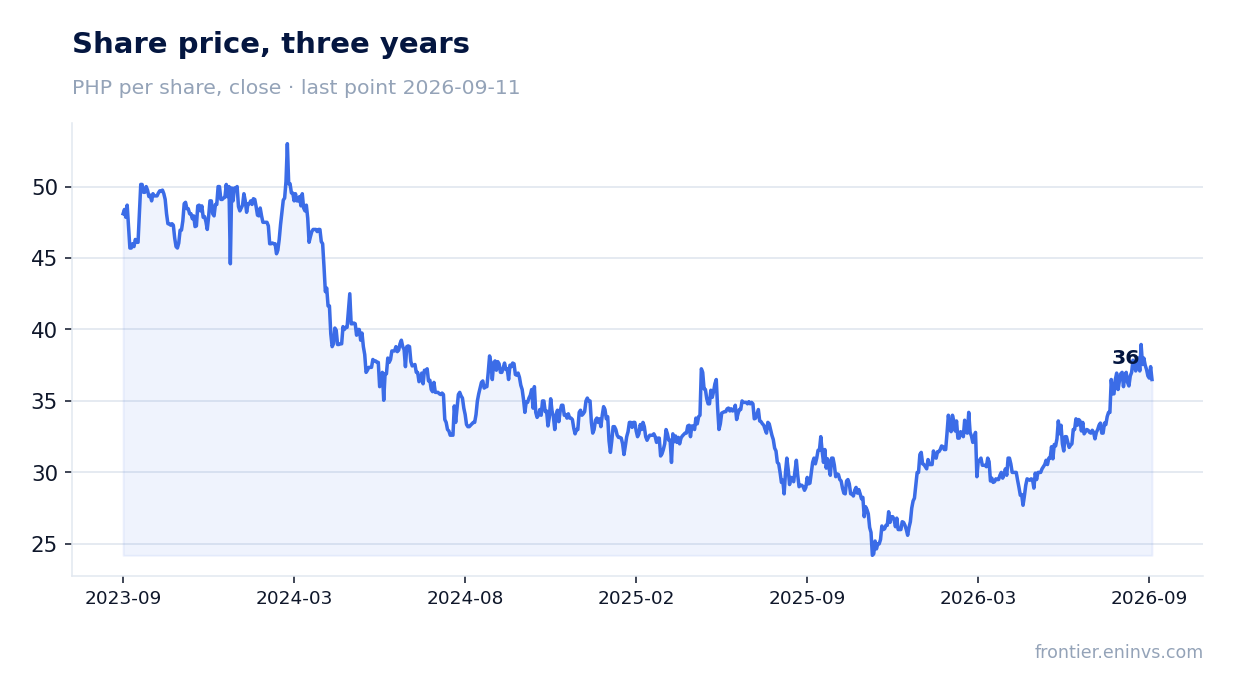
Valuation is cheap versus its own history: P/E LTM 4.9 and EV/EBITDA LTM 3.0, while the portal's model implies +12% upside to fair value
The trailing P/E is 4.9 and EV/EBITDA is 3.0. These are low values that may indicate undervaluation. However, we do not have data on the average values over the past three years for comparison, so it cannot be stated that the stock trades below its historical level – only that current multiples are low in absolute terms.
The portal's model estimates upside to fair value at +12%. This is our own model, not market consensus. Combined with a dividend yield of 9.6%, the total expected return could be attractive, but it depends on the sustainability of profit. If one-off factors do not repeat, profit may decline and multiples would rise.
Free cash flow is in question: quarterly operating cash flow PHP 7.2 bn, but capex is not disclosed and dividend payments absorb a large share
Operating cash flow for Q2 2026 was PHP 7.2 bn. This is less than net profit, explained by the non-cash nature of part of the profit. Capital expenditures for the quarter are not disclosed, so free cash flow cannot be assessed. In previous periods, capex was volatile: from PHP 0.5 bn in Q2 2025 to PHP 8.3 bn in Q4 2024.
Dividend payments for 2025 amounted to about PHP 4.0 bn, a significant outflow. At the same time, the company reduced net debt, which may indicate sufficient cash flow to cover investments and dividends. However, without quarterly capex data, the assessment of free cash flow sustainability remains incomplete.
Valuation on the latest reported figures
Metric
Value
Market cap
109 bn PHP
P/E (LTM)
4.9
EV/EBITDA (LTM)
3.0
P/B
0.74
Net debt / EBITDA (LTM)
0.76
Operating cash flow (LTM)
25.2 bn
ROE
16.4%
Dividend yield (12m)
9.6%
Bottom line
Bottom line: in Q2 2026 DMCI Holdings delivered impressive profit growth, but it was almost entirely due to a one-off non-cash effect from reassessing SLPGC asset useful lives. Revenue fell 36% on coal segment issues, and without the one-off factor the financial results would have looked much weaker. The company maintains low leverage (net debt/EBITDA 0.76) and a high dividend yield (9.6%), making the stock attractive for income-oriented investors. However, the sustainability of cash flow and the ability to maintain dividend payments at the current level are questionable. Verdict – rather attractive: the dividend and low multiples outweigh the risks, but confirmation of sustainability requires capex data and commodity price trends.
On 17 July Bank of the Philippine Islands released its Q2 2026 report. Quarterly net profit came in at PHP 15.99bn, down 2.0% year on year, even as net interest income rose to PHP 40.89bn from PHP 36.74bn. The entire increase in net interest income – and about PHP 4.15bn more – was absorbed by impairment provisions, which jumped to PHP 7.84bn from PHP 4.25bn a year earlier. The stock trades at a P/E LTM of 8.1 and a dividend yield of 4.7%, and with trailing-twelve-month profit of PHP 66.7bn and a 12% upside on the portal's model, the share looks rather attractive than neutral.
Key takeaways
— Net interest income rose 11.3% year on year, but profit fell 2.0% because of provisions
— Impairment provisions nearly doubled and swallowed the entire net interest income gain
— Fee and commission income added 27.3% and partly offset the pressure on profit
— Personnel and infrastructure costs are growing faster than revenue, pushing cost-to-income up
— P/E of 8.1 and dividend yield of 4.7% look attractive against ROE of 25.3%
— The portal's model implies 12% upside to fair value, outweighing the quarterly weakness
Attractiveness
Key figures, PHP bn
Metric
Q2 2025
Q2 2026
Change
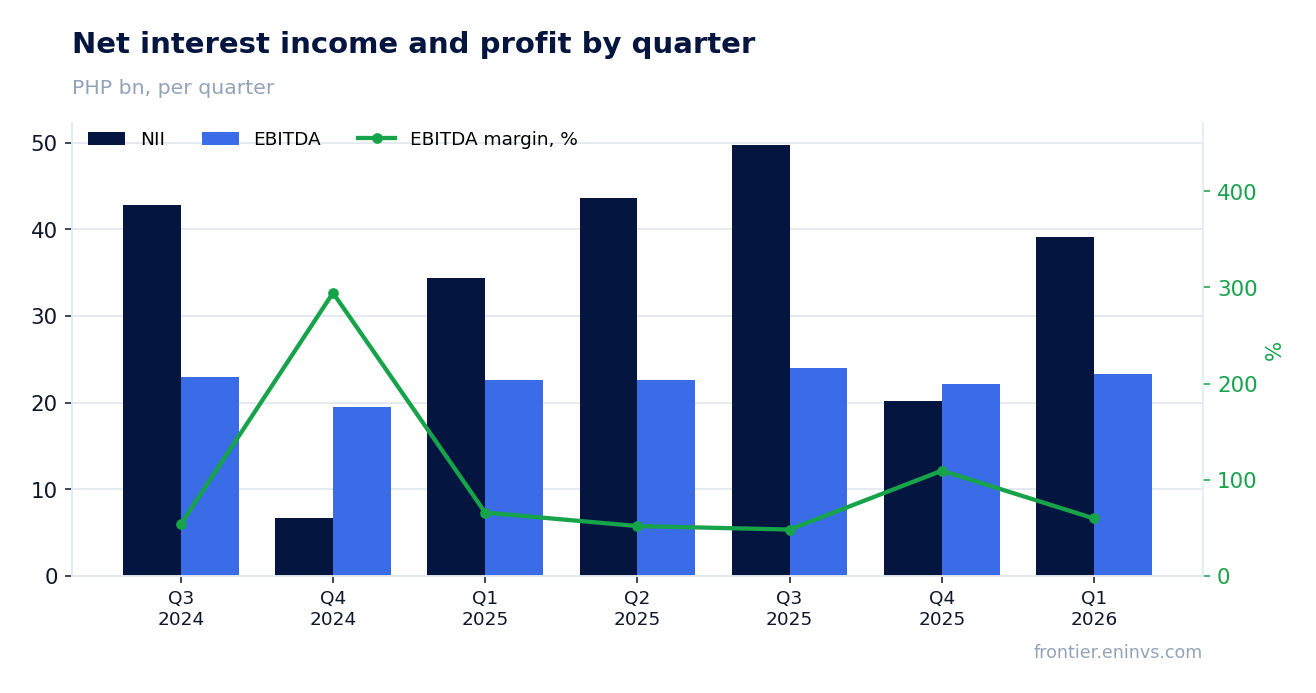
Net interest income
43.6
—
—
EBITDA
22.6
—
—
Operating profit
21.2
20.1
-4.9%
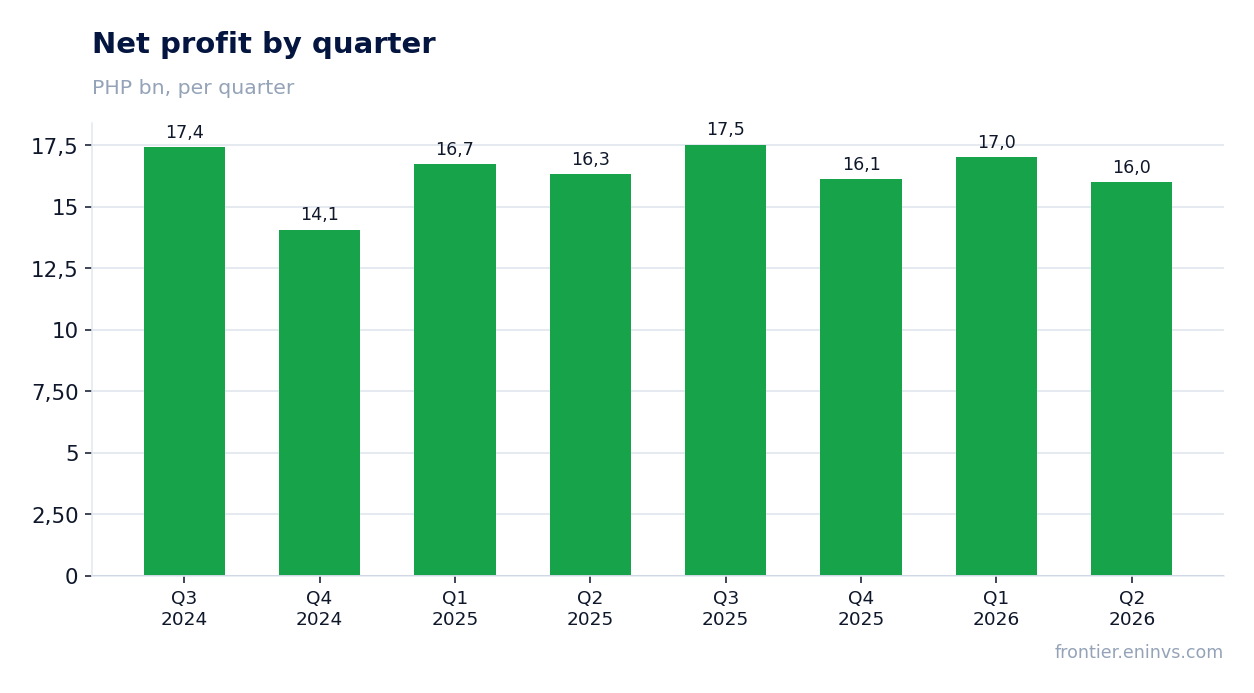
Net profit
16.3
16.0
-2.0%
Capex
1.56
—
—
EBITDA margin
51.8%
—
—
Net margin
37.4%
—
—
Net interest income rose 11.3% year on year, but profit fell 2.0% because of provisions
In Q2 2026, BPI's net interest income reached PHP 40.89bn, up 11.3% from PHP 36.74bn in the same quarter last year. Interest income rose to PHP 58.50bn from PHP 52.73bn, while interest expense increased to PHP 17.61bn from PHP 16.00bn. Loan growth drove the revenue increase: interest income on loans and advances added 10.9% year on year, to PHP 49.81bn.
However, quarterly net profit fell to PHP 15.99bn from PHP 16.44bn a year earlier. The culprit was a sharp rise in impairment provisions: they amounted to PHP 7.84bn versus PHP 4.25bn in Q2 2025. That increase of PHP 3.59bn more than offset the PHP 4.15bn gain in net interest income, leaving profit below last year's level.
The provision build reflects deteriorating credit quality: the non-performing loan (NPL) ratio reached 2.42%, which the report attributes to risks in business banking, consumer loans (credit cards and auto loans), and the corporate portfolio. The bank notes that the NPL ratio remains acceptable and below the industry average, with sufficient provisioning.
Revenue and EBITDA by quarter
Impairment provisions nearly doubled and swallowed the entire net interest income gain
Impairment provisions in Q2 2026 amounted to PHP 7.84bn, up 84.4% from PHP 4.25bn a year earlier. This was the largest increase among all expense items. As a result, net interest income after impairment losses rose only 1.7%, to PHP 33.05bn, even though the pre-provision figure grew 11.3%.
The provision build is linked to deteriorating asset quality: the NPL ratio rose to 2.42%, which the report attributes to credit risks in business banking, consumer loans (credit cards and auto loans), and borrower-specific risks in the corporate portfolio. The bank emphasises that the NPL ratio remains below the industry average, with sufficient provisioning.
If provisions stay at this level, pressure on profit will persist. However, the bank notes that it regularly updates macroeconomic forecasts and uses them to estimate expected credit losses, allowing it to respond promptly to changes in portfolio quality.
Net profit by quarter
Fee and commission income added 27.3% and partly offset the pressure on profit
Fee and commission income in Q2 2026 rose to PHP 4.53bn, up 27.3% from PHP 3.56bn a year earlier. This was the fastest growth among all revenue lines. Together with insurance income (PHP 1.14bn) and other operating income (PHP 5.66bn), total other income reached PHP 12.21bn, up 9.9% year on year.
The growth in fee income partly offset the pressure on profit from provisions. However, its contribution to the overall picture is limited: fees account for about 7.7% of total income, while net interest income generates more than 70%. Nevertheless, steady growth in fee income indicates diversification of revenue sources.
The report does not provide a detailed breakdown of fee income by type, but its dynamics noticeably outpace interest income growth, which may point to increased volumes in transaction banking and asset management services.
Personnel and infrastructure costs are growing faster than revenue, pushing cost-to-income up
Operating expenses in Q2 2026 rose to PHP 25.13bn, up 12.0% from PHP 22.45bn a year earlier. Compensation and fringe benefits increased 11.0%, to PHP 8.80bn; occupancy and equipment-related expenses rose 10.4%, to PHP 7.37bn; other operating expenses grew 14.2%, to PHP 8.97bn. Expense growth outpaced total income growth (which rose 10.5%), pushing the cost-to-income ratio higher.
According to the financial indicators, the cost-to-income ratio for H1 2026 was 46.76% versus 46.19% a year earlier. This is a moderate increase, but it indicates that the bank cannot yet fully offset cost growth with revenue growth.
The main contributor to expense growth is other operating expenses, which include technology, marketing, and administrative costs. The bank is actively investing in digitalisation and cybersecurity, which partly explains the rise in this line.
P/E of 8.1 and dividend yield of 4.7% look attractive against ROE of 25.3%
BPI shares trade at a P/E (LTM) of 8.1 and a dividend yield of 4.7% (trailing 12 months). At the same time, return on equity (ROE) over the last 12 months stands at 25.3%, well above the cost of capital, supporting the bank's ability to generate profit and pay dividends.
The bank's market capitalisation is PHP 540.2bn, with trailing-twelve-month profit of PHP 66.7bn. Net interest income for the same period was PHP 152.8bn. A price-to-earnings ratio below 10 with ROE above 25% points to potential undervaluation if the bank can sustain its current profitability.
According to the portal's model, the fair value of the share implies 12% upside to the current price. This is our own estimate based on comparing ROE and P/B, not a market consensus.
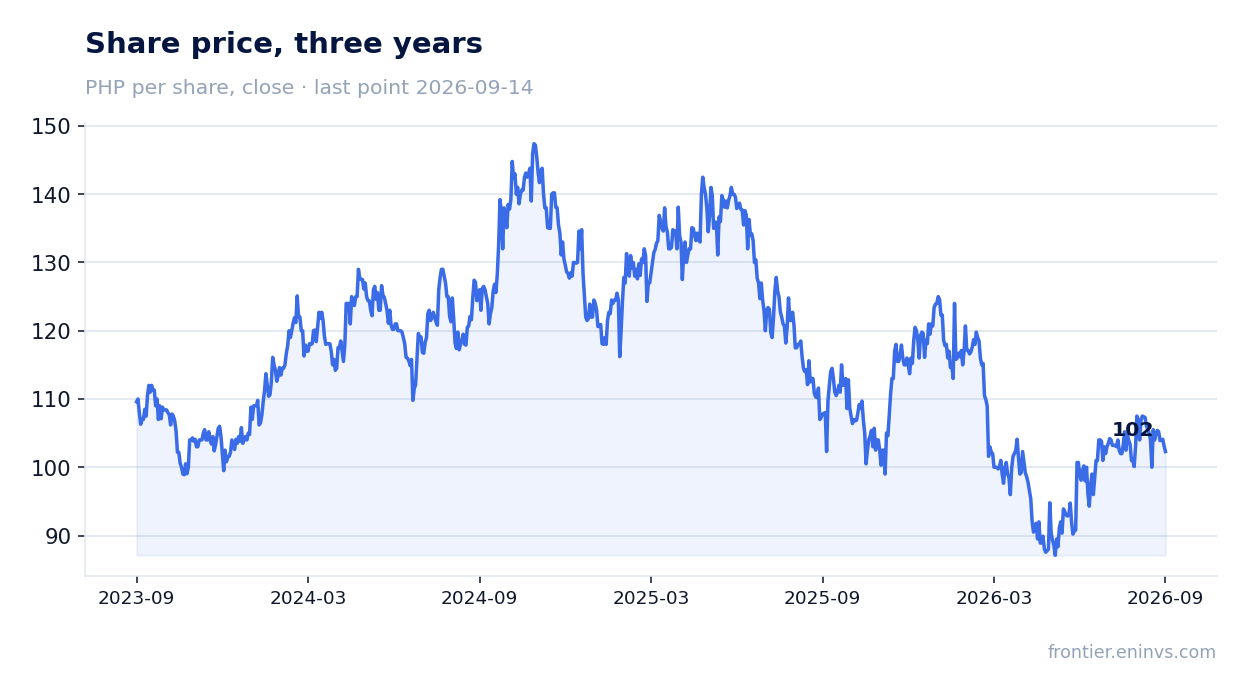
Share price, three years
The portal's model implies 12% upside to fair value, outweighing the quarterly weakness
Despite the decline in quarterly profit, the bank's fundamentals remain strong. Return on equity (ROE) over the last 12 months is 25.3%, well above the banking sector average. This provides a basis for maintaining dividend payments and capital growth.
According to our model, the fair value of the share is 12% above the current market price. This estimate takes into account the current ROE level and the price-to-book ratio. If the bank can stabilise provisions and return profit to growth, the upside may increase.
The dividend yield of 4.7% also supports the stock's appeal, especially amid declining deposit rates. The latest declared dividend was PHP 2.58 per share, paid on 18 June 2026. If current profit and the payout ratio are maintained, dividend payments are likely to remain at a comparable level.
Valuation on the latest reported figures
Metric
Value
Market cap
540 bn PHP
P/E (LTM)
8.1
P/B
1.13
ROE
0.3%
Dividend yield (12m)
4.7%
Bottom line
Bottom line: BPI delivered a weak quarter on profit but strong fundamentals. Net interest income rose 11.3%, fee income added 27.3%, and ROE remains at 25.3%. However, impairment provisions nearly doubled and expense growth outpaced revenue, pushing profit down 2.0%. The stock trades at a P/E of 8.1 and a dividend yield of 4.7%, which looks attractive against current profitability. The portal's model implies 12% upside to fair value. The key question for a holder is whether the bank can stabilise provisions and return profit to growth next quarter.
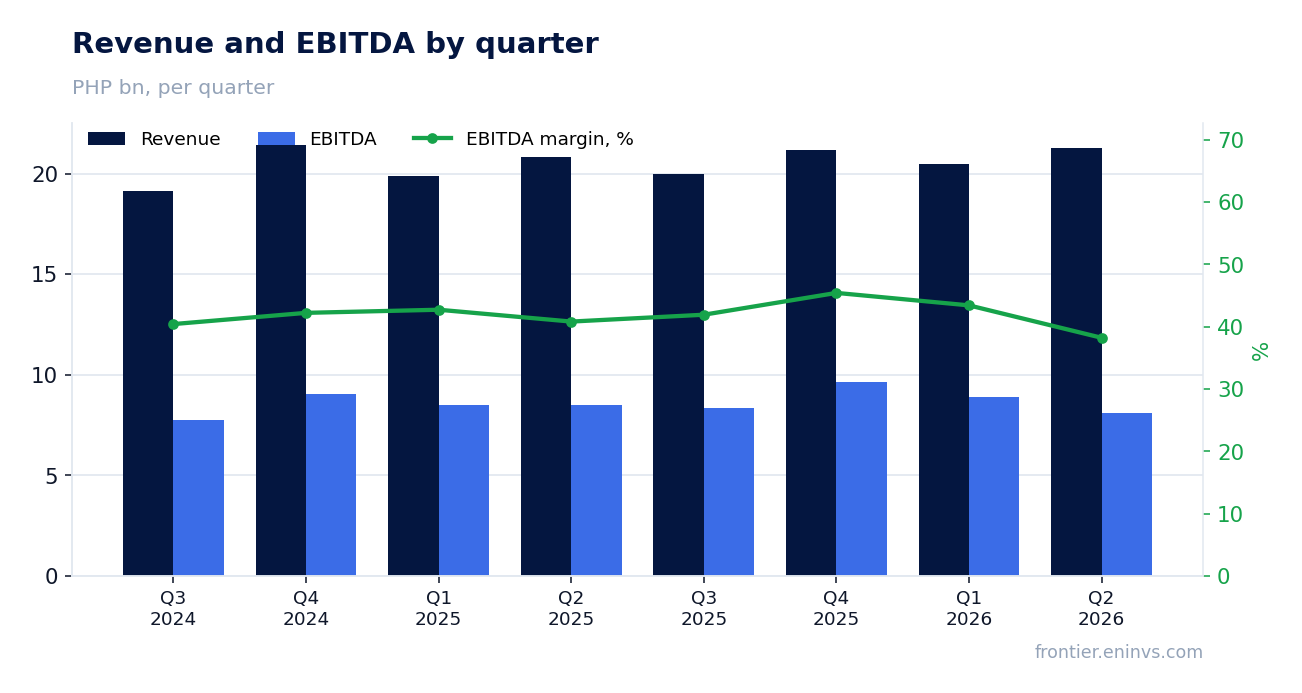
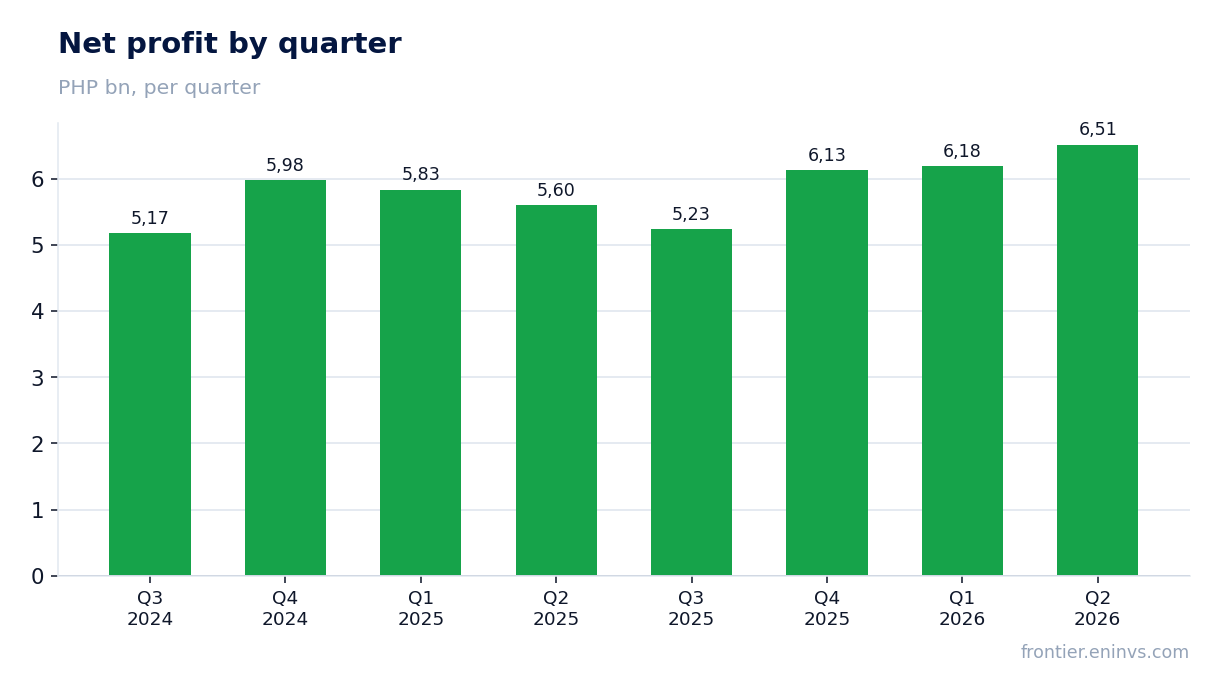
On 4 May Megaworld Corporation released its Q1 2026 report. Revenue for the quarter rose 3.0% year on year to PHP 20.5bn, net profit increased 6.1% to PHP 6.18bn, and the net margin improved to 30.2% from 29.3%. However, in Q2, based on published quarterly data, revenue grew only 2.2% while EBITDA declined to PHP 8.11bn from PHP 8.49bn a year earlier. With a trailing P/E of 3.02 and a dividend yield of 5.38%, the stock looks rather attractive, but weak revenue growth and the absence of Q2 operating cash flow data call for caution.
Key takeaways
— Q1 2026 revenue grew 3.0% to PHP 20.5bn, but Q2 growth slowed to 2.2%
— Q1 net profit rose 6.1% to PHP 6.18bn, with the net margin improving to 30.2% from 29.3%
— Q2 EBITDA fell to PHP 8.11bn from PHP 8.49bn a year earlier, while operating profit remained at PHP 8.11bn
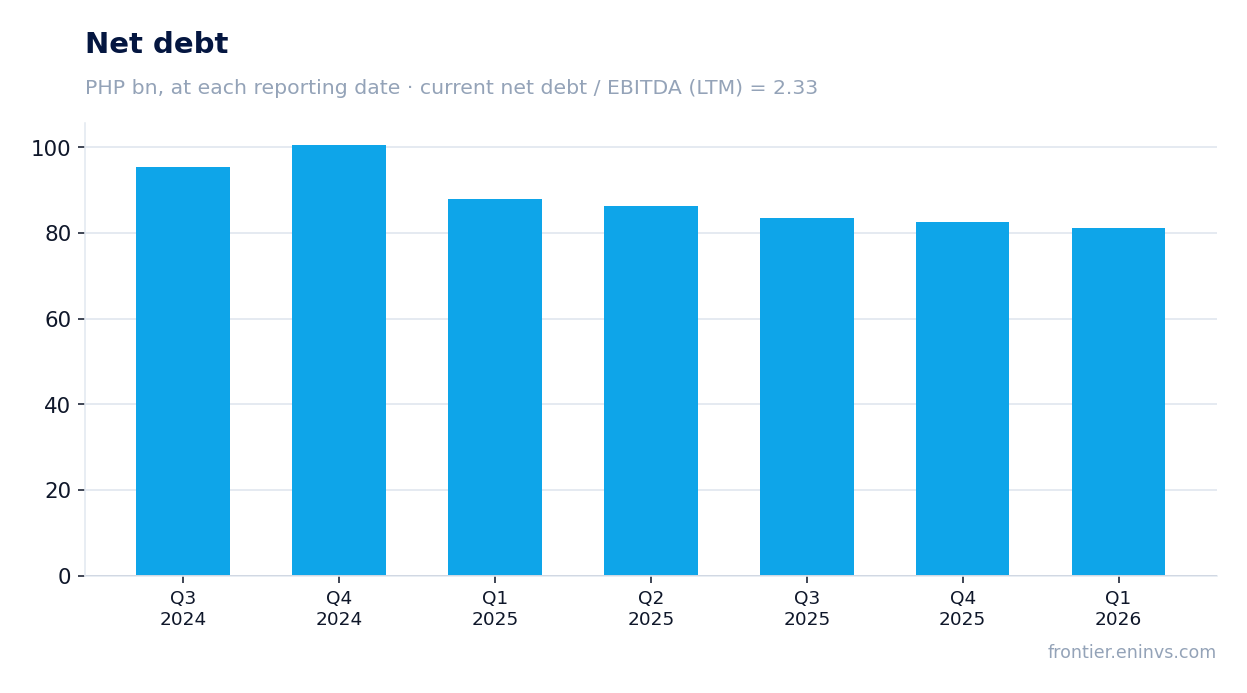
— Leverage stands at 2.33x LTM EBITDA, with net debt down PHP 6.8bn over 12 months
— A 5.38% dividend yield and a trailing P/E of 3.02 make the stock one of the cheapest in the sector, but dividend sustainability hinges on profit
— Q1 2026 operating cash flow was PHP 4.26bn, and PHP 11.4bn over the trailing twelve months
— The portal's model puts the upside to fair value at +20%
Attractiveness
Key figures, PHP bn
Metric
Q2 2025
Q2 2026
Change
Revenue
20.8
21.3
+2.2%
EBITDA
8.49
—
—
Operating profit
7.58
8.11
+7.0%
Net profit
5.60
6.51
+16.3%
Operating cash flow
4.12
—
—
EBITDA margin
40.8%
—
—
Net margin
26.9%
30.6%
+3.7 pp
Q1 2026 revenue grew 3.0% to PHP 20.5bn, but Q2 growth slowed to 2.2%
In Q1 2026 Megaworld's revenue reached PHP 20.5bn, up 3.0% year on year. Real estate sales contributed PHP 13.3bn and rental income PHP 5.65bn. The growth was modest compared with the double-digit rates of previous years.
In Q2 2026 revenue grew only 2.2% year on year to PHP 21.3bn. This is the weakest quarterly increase in several quarters: Q1 2025 saw 6.4% growth, Q2 9.5%, Q3 4.3%, Q4 a 1.2% decline, and Q1 2026 3.0%.
The slowdown reflects a high base from last year and possibly more cautious housing demand. The company does not disclose Q2 segment details, so the exact cause cannot be identified. But the fact remains: revenue growth has nearly stalled.
Revenue and EBITDA by quarter
Q1 net profit rose 6.1% to PHP 6.18bn, with the net margin improving to 30.2% from 29.3%
Q1 2026 net profit came in at PHP 6.18bn, up 6.1% from PHP 5.83bn a year earlier. The net margin improved to 30.2% from 29.3% in Q1 2025.
The margin improvement occurred despite a 10.6% increase in operating expenses and higher interest costs. It was supported by lower cost of real estate sales and higher other income. A reduction in the share of non-controlling interests also helped.
In Q2 2026 net profit rose 16.3% year on year, with the margin reaching 30.6% versus 26.9% a year earlier. This is a strong result, but it was achieved on weak revenue growth, indicating efficiency gains and possibly one-off factors.
Net profit by quarter
Q2 EBITDA fell to PHP 8.11bn from PHP 8.49bn a year earlier, while operating profit remained at PHP 8.11bn
In Q2 2026 Megaworld's EBITDA amounted to PHP 8.11bn, down 4.4% from PHP 8.49bn a year earlier. This decline occurred despite a 2.2% revenue increase, pointing to margin pressure.
Operating profit in Q2 also stood at PHP 8.11bn, matching EBITDA. This may indicate that depreciation and other non-cash items were minimal or that the company changed its expense classification. In any case, operating efficiency declined.
Over the trailing twelve months EBITDA reached PHP 35.2bn. The year-on-year decline in the quarterly figure is a warning sign, especially since Q1 2026 EBITDA rose to PHP 8.87bn from PHP 8.49bn a year earlier.
Net debt at reporting dates
Leverage stands at 2.33x LTM EBITDA, with net debt down PHP 6.8bn over 12 months
Megaworld's net debt at the latest reporting date stood at PHP 82.0bn. The net debt to trailing twelve-month EBITDA ratio is 2.33x. This is a moderate level for a developer, but it cannot be compared with earlier values as no prior ratio is available in the facts.
Over the past 12 months net debt decreased by PHP 6.8bn, and by PHP 1.6bn from the previous reporting date. The debt reduction is occurring alongside profit growth, strengthening the financial position.
Interest expenses in Q1 2026 rose to PHP 1.64bn from PHP 1.41bn a year earlier, reflecting higher borrowing costs. However, at the current debt and EBITDA levels the company can service its obligations.
A 5.38% dividend yield and a trailing P/E of 3.02 make the stock one of the cheapest in the sector, but dividend sustainability hinges on profit
Megaworld's trailing twelve-month dividend yield is 5.38%. This is above the yield on most Philippine bonds and the policy rate, making the stock attractive for income-oriented investors.
The trailing P/E is 3.02, which is very low. Historically, the company traded at higher multiples. EV/EBITDA LTM stands at 4.40. Such a valuation implies that the market is pricing in either a profit decline or risks related to the development cycle.
Dividend payments are funded from net profit, which over the trailing twelve months amounted to PHP 24.1bn. With a payout ratio of around 20%, the annual dividend is approximately PHP 4.8bn. A decline in profit or an increase in capital expenditures could lead to a dividend cut.
Share price, three years
Q1 2026 operating cash flow was PHP 4.26bn, and PHP 11.4bn over the trailing twelve months
Operating cash flow in Q1 2026 was PHP 4.26bn, up 9.0% from PHP 3.91bn a year earlier. This is a positive signal, as cash flow is growing faster than revenue.
Over the trailing twelve months operating cash flow reached PHP 11.4bn. However, in Q4 2025 it was negative at minus PHP 7.02bn, due to seasonal factors and an increase in receivables. Overall, the ability to generate cash flow remains key to funding dividends and capital expenditures.
Q2 2026 operating cash flow data is not available, preventing an assessment of the dynamics in the second quarter. This creates uncertainty.
The portal's model puts the upside to fair value at +20%
According to the portal's model, Megaworld's fair value implies +20% upside from the current price. The model incorporates EBITDA growth and a target multiple. This is our own estimate, not a market consensus.
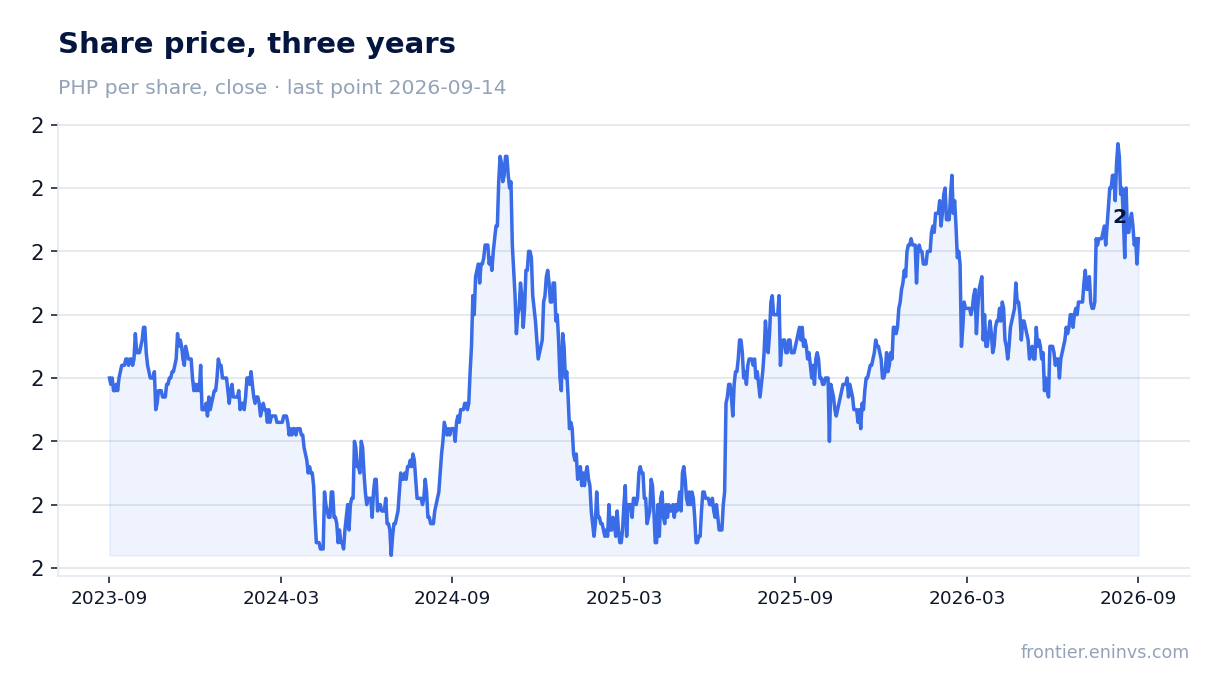
The current market capitalisation is PHP 72.6bn. With EV/EBITDA LTM at 4.40 and P/E LTM at 3.02, the stock is trading below its historical levels. If the company can resume revenue growth and maintain its margin, the multiples could expand.
However, the model does not account for a possible decline in profit or a deterioration in market conditions. The 20% upside looks realistic but requires confirmation in the form of accelerating revenue and stable cash flow.
Valuation on the latest reported figures
Metric
Value
Market cap
72.6 bn PHP
P/E (LTM)
3.0
EV/EBITDA (LTM)
4.4
P/B
0.24
Net debt / EBITDA (LTM)
2.33
Operating cash flow (LTM)
11.4 bn
ROE
8.3%
Dividend yield (12m)
5.4%
Bottom line
Megaworld reported Q1 2026 with revenue up 3.0% and net profit up 6.1%, while in Q2 profit rose 16.3% with a 30.6% margin. However, Q2 revenue grew only 2.2% and EBITDA fell to PHP 8.11bn from PHP 8.49bn a year earlier. Leverage stands at 2.33x LTM EBITDA, with net debt down PHP 6.8bn over the year. A 5.38% dividend yield and a trailing P/E of 3.02 make the stock cheap, but dividend sustainability hinges on profit. The portal's model puts upside at +20%. Overall, the stock looks rather attractive, but confirmation requires sustainable revenue and cash flow growth.
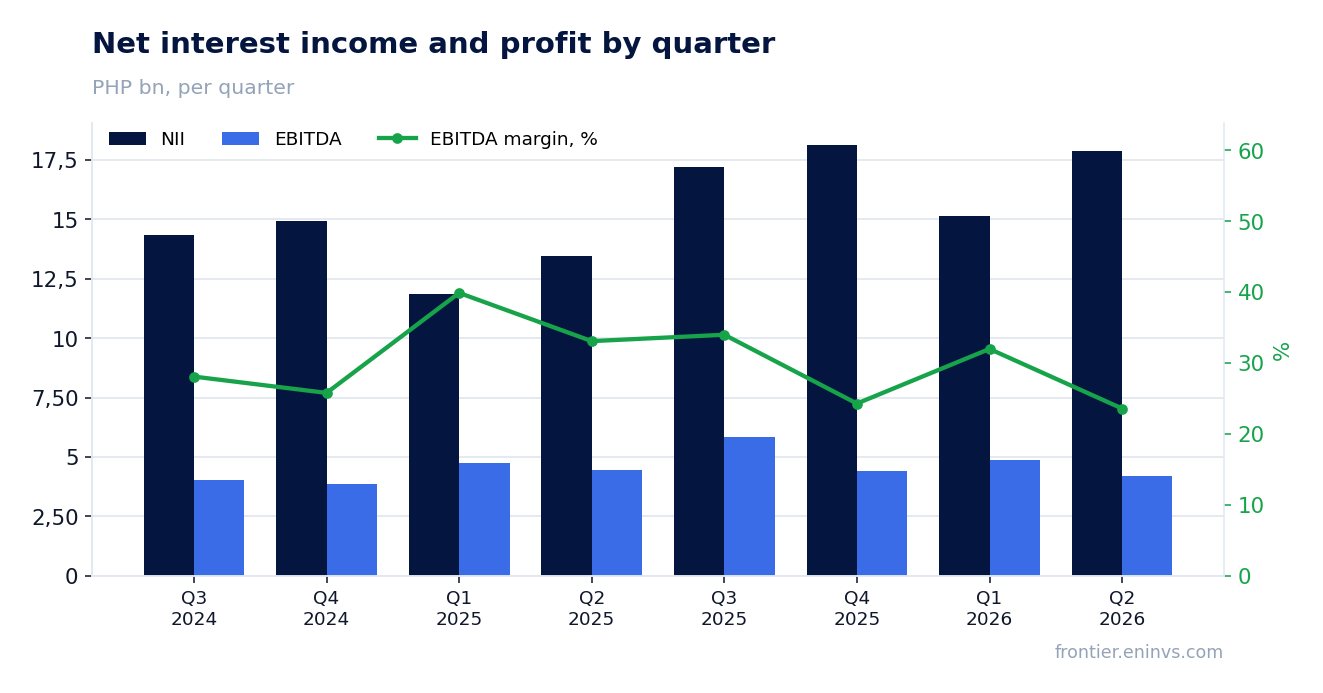
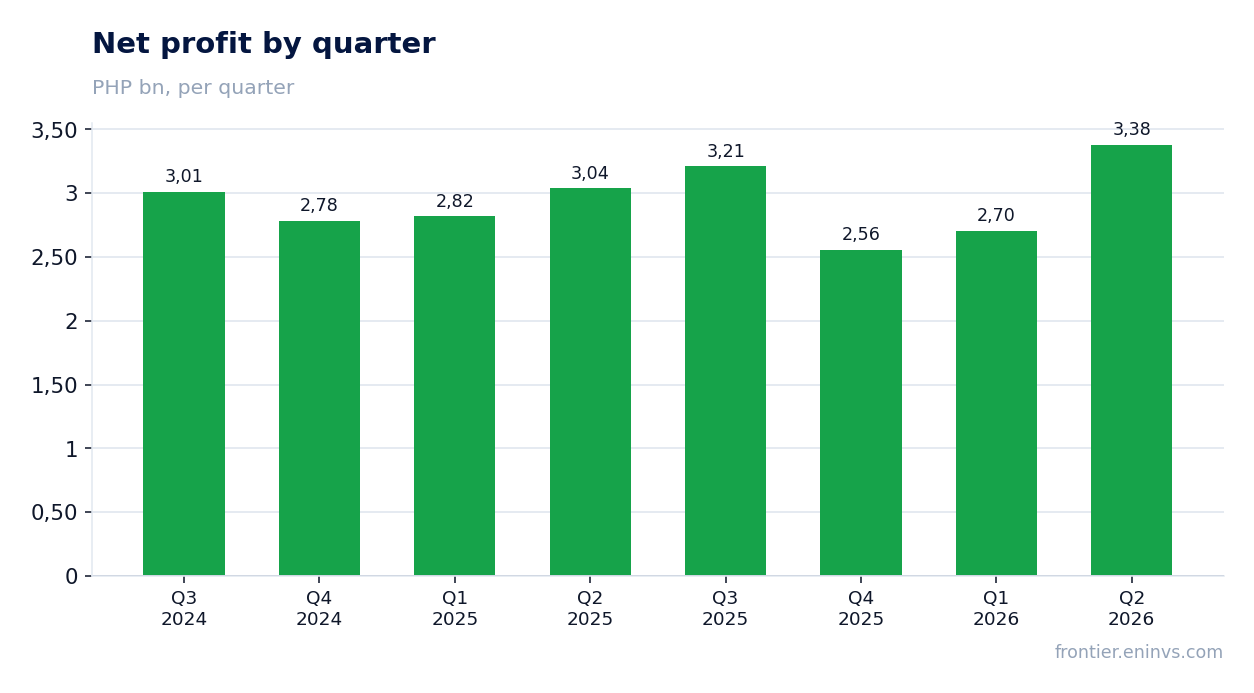
On 14 May Security Bank Corporation released its first-quarter 2026 report. Net interest income rose to PHP 15,161.4 mn from 11,881.3 mn a year earlier, quarterly net profit came in at PHP 2,704.2 mn versus 2,821.2 mn, while loan-loss provisions jumped to PHP 3,880.2 mn from 2,377.6 mn. The bank trades at 4.1x LTM P/E with an 8.7% ROE, and the portal model puts the upside to fair value at +28%; with a 4.7% dividend yield and a growing top line, the share looks rather attractive, but the key question is credit quality.
Key takeaways
— Net interest income grew 27.6% YoY, but quarterly profit fell 4.1% due to provisions
— Loan-loss provisions rose 1.6x and consumed the entire increase in net interest income
— Fee income fell 4.4%, while trading and FX losses added pressure on revenue
— Personnel and tax expenses were almost flat, but depreciation rose 20.5%
— The bank trades at 4.1x P/E and 8.7% ROE, below cost of equity, yet the portal model sees +28% upside
— A 4.7% dividend yield on a PHP 5.7 mn quarterly payout is a low base for re-rating
— Deposits grew by PHP 7.5 bn in the quarter, but the mix shifted toward expensive time deposits
Attractiveness
Key figures, PHP bn
Metric
Q2 2025
Q2 2026
Change
Net interest income
13.5
—
—
EBITDA
4.45
—
—
Operating profit
3.99
4.22
+5.8%
Net profit
3.04
3.38
+11.3%
Capex
0.85
—
—
EBITDA margin
33.1%
—
—
Net margin
22.6%
—
—
Net interest income grew 27.6% YoY, but quarterly profit fell 4.1% due to provisions
In Q1 2026, net interest income reached PHP 15,161.4 mn, up 27.6% year-on-year. This is the fastest growth in five quarters: 21.7% in Q4 2025 and 20.0% in Q3. The acceleration was driven by higher interest income on loans and investments, coupled with a decline in funding costs: interest expense fell to PHP 4,762.6 mn from 6,764.6 mn a year earlier.
However, quarterly net profit declined to PHP 2,704.2 mn from 2,821.2 mn a year earlier. The reason is a sharp increase in loan-loss provisions, which reached PHP 3,880.2 mn versus 2,377.6 mn in Q1 2025. Without this jump, profit would have been significantly higher. The 1.6x rise in provisions points to either deteriorating asset quality or a conservative approach to risk assessment.
Thus, the operating growth remains strong, but its conversion into profit is hampered by credit costs. This is a key risk for future dynamics.
Revenue and EBITDA by quarter
Loan-loss provisions rose 1.6x and consumed the entire increase in net interest income
Loan-loss provisions in Q1 2026 amounted to PHP 3,880.2 mn, an increase of PHP 1,502.6 mn from a year earlier. This increase is almost equal to the entire rise in net interest income (PHP 3,280.1 mn). Thus, all the additional income from loan growth and lower funding costs was directed to cover potential loan losses.
The share of provisions in operating expenses rose to 29.0% from 20.3% a year earlier. This significantly pressures profitability. If provisions had remained at last year's level, pre-tax profit would have been around PHP 5,133 mn, and net profit around PHP 3,800 mn. In reality, the bank earned only PHP 2,704.2 mn.
The reasons for the provision increase are not disclosed in the report. However, such a jump could be linked to either deteriorating portfolio quality or changes in macroeconomic forecasts used in the expected credit loss model. For investors, this is the main signal to monitor: if provisions remain high, profit will not grow even with strong net interest income.
Net profit by quarter
Fee income fell 4.4%, while trading and FX losses added pressure on revenue
Service charges, fees and commissions in Q1 2026 amounted to PHP 2,061.9 mn, down 4.4% from PHP 2,155.8 mn a year earlier. This decline contrasts with the growth in net interest income and points to weakness in non-interest operations. It may be due to lower transaction volumes or pressure on fees.
In addition, the bank recorded a net trading loss of PHP 712.5 mn versus a gain of PHP 165.8 mn a year earlier, and a foreign exchange loss of PHP 977.5 mn versus a gain of PHP 145.8 mn. These two items together worsened the result by PHP 2,001.6 mn compared to last year. This is a significant negative contribution that added pressure on profit.
Rental income and other operating income partially offset the decline: rent brought PHP 408.4 mn, and share in net income of joint ventures was PHP 316.4 mn versus a loss a year earlier. Nevertheless, the overall dynamics of non-interest income remain weak.
Personnel and tax expenses were almost flat, but depreciation rose 20.5%
Operating expenses excluding loan-loss provisions grew moderately. Compensation and fringe benefits amounted to PHP 3,357.3 mn versus PHP 3,326.3 mn a year earlier, taxes and licenses – PHP 1,175.1 mn versus PHP 1,161.1 mn. This indicates tight control over fixed costs.
However, depreciation and amortization of software costs increased more notably: together they reached PHP 1,225.9 mn versus PHP 1,042.3 mn a year earlier, up 17.6%. This may be linked to investments in technology and infrastructure expansion. Rising depreciation reflects past capital expenditures that now weigh on profit.
Other operating expenses also rose to PHP 3,641.1 mn from PHP 3,680.5 mn, but here there was a decline. Overall, excluding provisions, operating expenses grew 8.5%, below revenue growth, but provisions completely offset this effect.
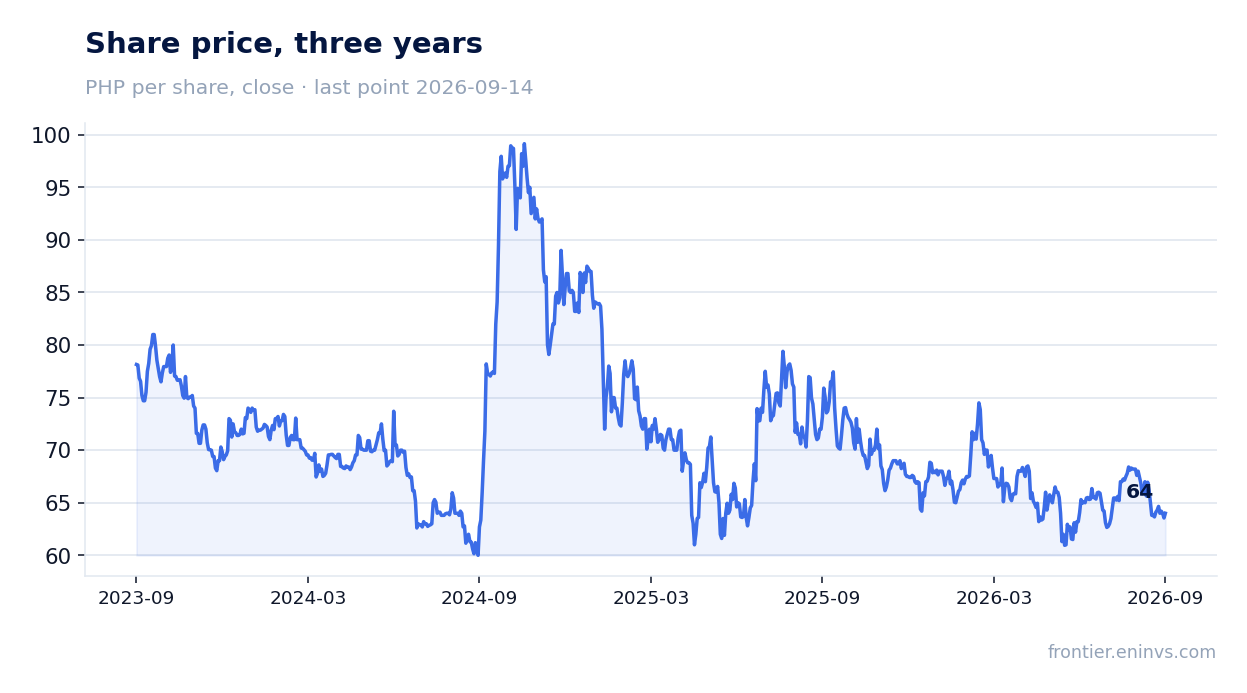
The bank trades at 4.1x P/E and 8.7% ROE, below cost of equity, yet the portal model sees +28% upside
The current LTM P/E multiple is 4.1x, below the historical average for the bank. At the same time, ROE is 8.7%, below the cost of equity estimated by the market. This combination suggests that the market is pricing in either further deterioration in asset quality or low growth rates.
The portal's model, based on comparing ROE and P/B, estimates upside to fair value at +28%. This is the portal's own estimate, not a market consensus. It implies that the current price is undervalued relative to the fundamental value of the bank's capital.
For comparison: a 4.7% dividend yield and 4.1x P/E create prerequisites for a re-rating if the bank manages to stabilize provisions and return profit to growth. Without that, multiples may remain low.
Share price, three years
A 4.7% dividend yield on a PHP 5.7 mn quarterly payout is a low base for re-rating
In Q1 2026, the bank paid dividends of PHP 5.7 mn, corresponding to a 4.7% dividend yield on the current price. This is a low absolute payout compared to net profit of PHP 2,704.2 mn. The payout ratio is less than 1% of quarterly profit, indicating a conservative dividend policy.
For comparison: a year earlier, PHP 1,136.0 mn was paid in Q1. The current payout is significantly lower, which may be due to a decision to direct profit toward capital strengthening or covering credit losses. If the bank maintains this approach, the dividend yield will remain at or below 4.7%.
Our estimate for the current year: if profit remains at the LTM level (PHP 11,854.0 mn) and the payout ratio is around 30%, the dividend could be approximately PHP 3,556 mn, yielding about 7.3% on the current market cap. However, this is only an assumption based on historical payout ratios and is not guaranteed. The key risk is further growth in provisions, which could reduce profit and payouts.
Deposits grew by PHP 7.5 bn in the quarter, but the mix shifted toward expensive time deposits
Total deposits as of 31 March 2026 amounted to PHP 937,981.8 mn, up PHP 7,479.1 mn from the beginning of the year. However, the structure changed: time deposits rose to PHP 459,962.9 mn from PHP 471,193.1 mn at end-2025, while demand and savings deposits increased. This means the bank is attracting more expensive funding, which could pressure the net interest margin in the future.
Despite deposit growth, the loan portfolio contracted to PHP 679,443.6 mn from PHP 696,637.5 mn at end-2025. This decline of PHP 17,193.9 mn may indicate caution in issuing new loans or loan repayments. The combination of rising deposits and shrinking loans leads to liquidity accumulation, reflected in the increase in cash and cash equivalents to PHP 109,566.5 mn from PHP 85,674.4 mn at the beginning of the year.
This dynamic may be temporary, but it signals a possible slowdown in the lending business. If lending does not recover, interest income may stop growing.
Valuation on the latest reported figures
Metric
Value
Market cap
48.6 bn PHP
P/E (LTM)
4.1
P/B
0.32
ROE
8.7%
Dividend yield (12m)
4.7%
Bottom line
The strong side of the report is the acceleration in net interest income growth to 27.6% YoY and tight control over operating expenses. However, all this growth was consumed by loan-loss provisions, which rose 1.6x. Quarterly profit fell 4.1%, and without stabilization of provisions, the bank will not be able to realize the potential embedded in the current low valuation. A 4.7% dividend yield and 4.1x P/E look attractive but require confirmation of asset quality. The verdict is rather attractive, with a caveat on credit risk.
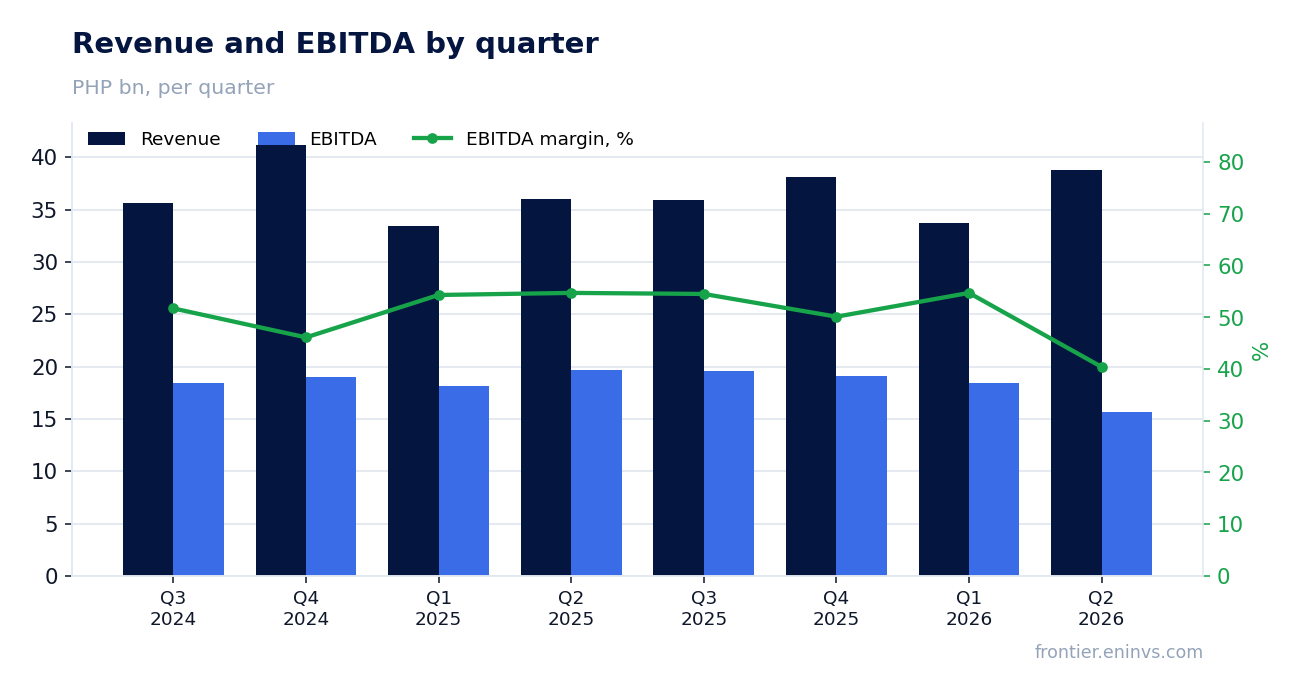
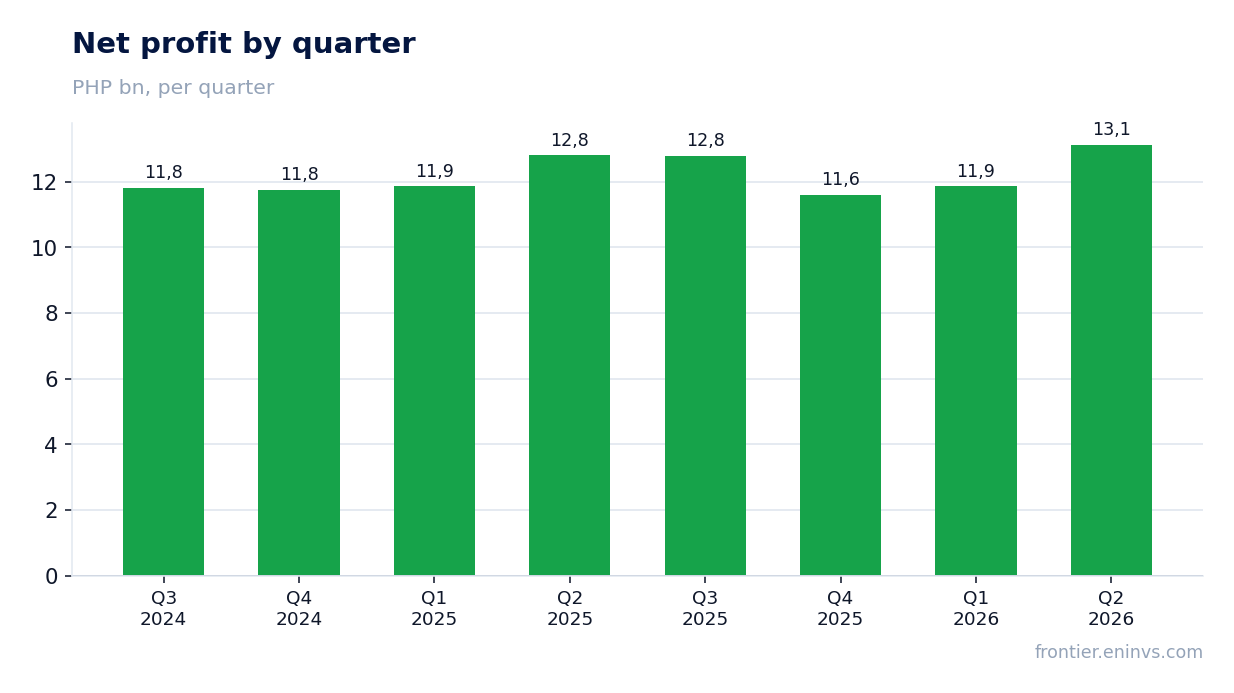
SM Prime Holdings reported second-quarter 2026 results. Revenue rose 7.6% year on year to 38.8 bn pesos, net profit added only 2.5% to 13.1 bn pesos, and net margin narrowed to 33.8% from 35.5% a year earlier. Over the trailing twelve months the company earned 49.4 bn pesos of net profit on revenue of 146.6 bn pesos, and the stock trades at about 10.2 times that profit. At the current price the share looks rather attractive: revenue is accelerating, the dividend yield is 2.37% against a policy rate that appears to be falling, and the portal's model puts upside to fair value at +17%.
Key takeaways
— Revenue rose 7.6% year on year, the best quarterly pace in five quarters
— Net profit added only 2.5% because margin compressed to 33.8% from 35.5%
— Operating profit was flat year on year, and quarterly EBITDA fell to 15.7 bn pesos
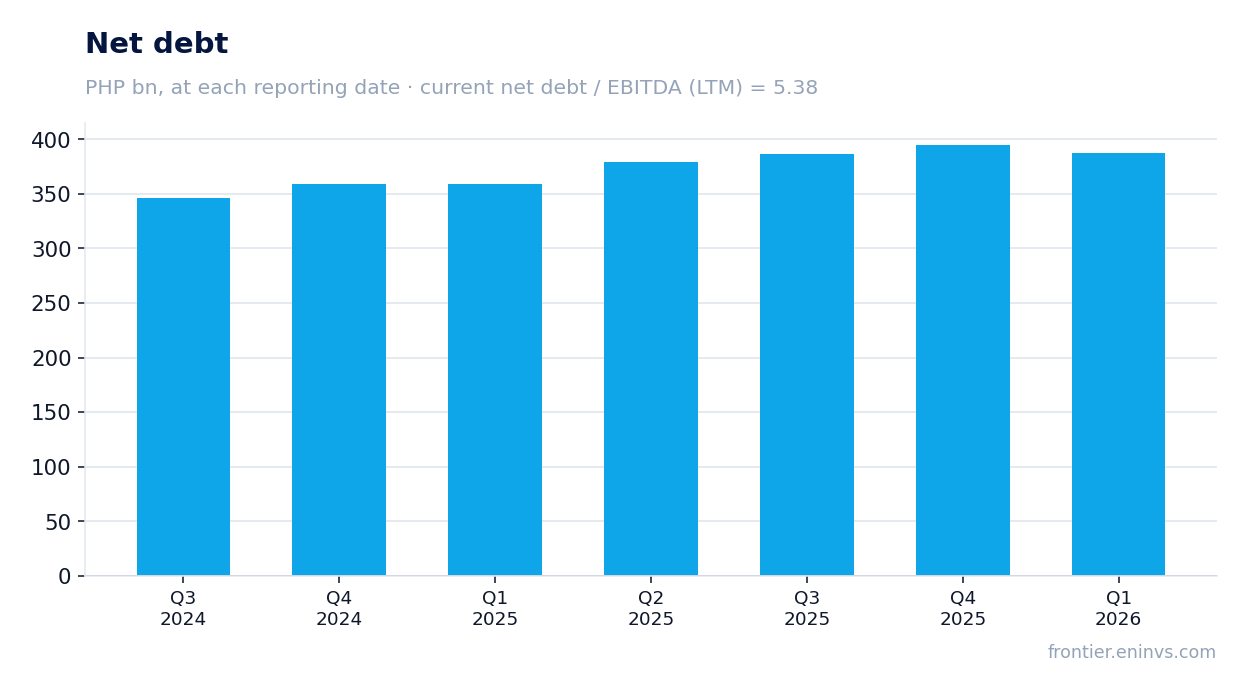
— Leverage of 5.38 EBITDA is a level, not a direction: the trend is not disclosed
— Dividend yield of 2.37% with a payout ratio that leaves room for growth
— Valuation at 10.2 times earnings and 12.2 times EBITDA is below its multi-year average
— The portal's model shows +17% upside to fair value, but that is our estimate, not consensus
Attractiveness
Key figures, PHP bn
Metric
Q2 2025
Q2 2026
Change
Revenue
36.0
38.8
+7.6%
EBITDA
19.7
—
—
Operating profit
15.9
15.7
-1.1%
Net profit
12.8
13.1
+2.5%
Operating cash flow
16.0
—
—
Capex
19.1
—
—
EBITDA margin
54.7%
—
—
Net margin
35.5%
33.8%
-1.7 pp
Revenue rose 7.6% year on year, the best quarterly pace in five quarters
In the second quarter of 2026, SM Prime's revenue reached 38.8 bn pesos, up 7.6% year on year. This is the best quarterly pace in five quarters: in the first quarter of 2026 growth was only 0.9%, in the fourth quarter of 2025 revenue even declined by 7.6%, and in the third quarter of 2025 it added just 0.9%. The acceleration in the second quarter looks notable against the weak dynamics of previous periods.
The main contribution to growth came from rental income: in the first quarter of 2026 (the latest detailed data available) rent rose to 21.6 bn pesos from 20.0 bn pesos a year earlier, or 8%. Real estate sales, on the contrary, fell to 7.8 bn pesos from 9.2 bn pesos. Thus, revenue growth in the second quarter likely relied on rent rather than home sales.
Over the trailing twelve months, revenue amounted to 146.6 bn pesos. This is not a quarterly figure but the sum of four quarters, and it cannot be directly compared with quarterly dynamics. Nevertheless, it shows the scale of the business, which remains the largest in the Philippine commercial real estate segment.
Revenue and EBITDA by quarter
Net profit added only 2.5% because margin compressed to 33.8% from 35.5%
Net profit in the second quarter of 2026 was 13.1 bn pesos, only 2.5% more than a year earlier. With revenue growing 7.6%, this dynamic means expenses grew faster than income. Net margin fell to 33.8% from 35.5% a year earlier. This compression of 1.7 percentage points explains why profit barely grew despite a notable increase in revenue.
The main reason is faster growth in costs. In the first quarter of 2026 (the latest detailed data available), cost of sales and operating expenses increased to 16.6 bn pesos from 16.1 bn pesos a year earlier, or 2.8%, while revenue grew 1.5% in the same quarter. This was already putting pressure on margin. In the second quarter, judging by the final margin, the pressure intensified.
Over the trailing twelve months, net profit amounted to 49.4 bn pesos. This is the sum of four quarters, and it should not be used to calculate quarterly growth rates. For assessing profitability, more important is that the margin in the second quarter was lower than a year earlier, and this is the key negative point of the report.
Net profit by quarter
Operating profit was flat year on year, and quarterly EBITDA fell to 15.7 bn pesos
Operating profit in the second quarter of 2026 was 15.7 bn pesos, exactly the same as a year earlier. This means that all revenue growth was eaten up by higher operating expenses. Quarterly EBITDA also amounted to 15.7 bn pesos, down from 19.7 bn pesos in the second quarter of 2025. A decline in EBITDA alongside revenue growth is a warning signal, although it may be related to one-off factors not disclosed in the report.
In the first quarter of 2026, EBITDA was 18.4 bn pesos and operating profit was 14.4 bn pesos. Thus, in the second quarter EBITDA was lower than in the first, despite higher revenue. This confirms that pressure on profitability intensified specifically in the second quarter.
Over the trailing twelve months, EBITDA amounted to 73.5 bn pesos. This is also the sum of four quarters, and it cannot be directly compared with quarterly figures. Nevertheless, the ratio of EBITDA to revenue over this period is about 50%, which is lower than in previous years when EBITDA margin exceeded 55%.
Net debt at reporting dates
Leverage of 5.38 EBITDA is a level, not a direction: the trend is not disclosed
SM Prime's net debt at the latest reporting date is 395.1 bn pesos, and the ratio of net debt to trailing-twelve-month EBITDA is 5.38. This is a high level for a capital-intensive business. It is important to emphasise: the facts do not contain a previous value for this ratio, so one cannot claim that leverage rose or fell. Only the current level can be stated.
Over the trailing twelve months, net debt increased by 28.6 bn pesos, while compared with the previous reporting date it decreased by 7.8 bn pesos. This is a mixed movement: over the year debt grew, but over the quarter it slightly declined. The absolute increase in debt over the year is a fact, but it does not necessarily mean a deterioration in credit quality if EBITDA is growing at a comparable pace.
Interest expense in the first quarter of 2026 was 3.3 bn pesos, slightly lower than 3.4 bn pesos a year earlier. This is a positive: the cost of servicing debt is not rising despite the increase in its absolute size. Operating cash flow over the trailing twelve months was 74.9 bn pesos, which covers interest expense with a large margin.
Dividend yield of 2.37% with a payout ratio that leaves room for growth
SM Prime's dividend yield over the trailing twelve months is 2.37%. This is a modest figure by Philippine market standards, where yields are often higher. However, the company pays out only part of its profit: with trailing-twelve-month net profit of 49.4 bn pesos and a market capitalisation of 501.8 bn pesos, the payout ratio looks moderate. This leaves room for dividend increases in the future.
Our estimate for the current year's dividend assumes the payout ratio remains at its established level and profit stays close to 49–50 bn pesos. This is our forecast, not consensus. It could be reduced if margin continues to compress, as in the second quarter, or if the company increases capital expenditure. In the first quarter of 2026, capital expenditure was 12.9 bn pesos, lower than 16.0 bn pesos a year earlier — this supports free cash flow.
The key policy rate in the Philippines has been declining in recent years, making a dividend yield of 2.37% relatively more attractive. If the rate continues to fall, the spread between the stock's yield and the policy rate will narrow, supporting valuation. However, if profit does not grow, the dividend may remain unchanged, and then the yield will depend only on the share price.
Share price, three years
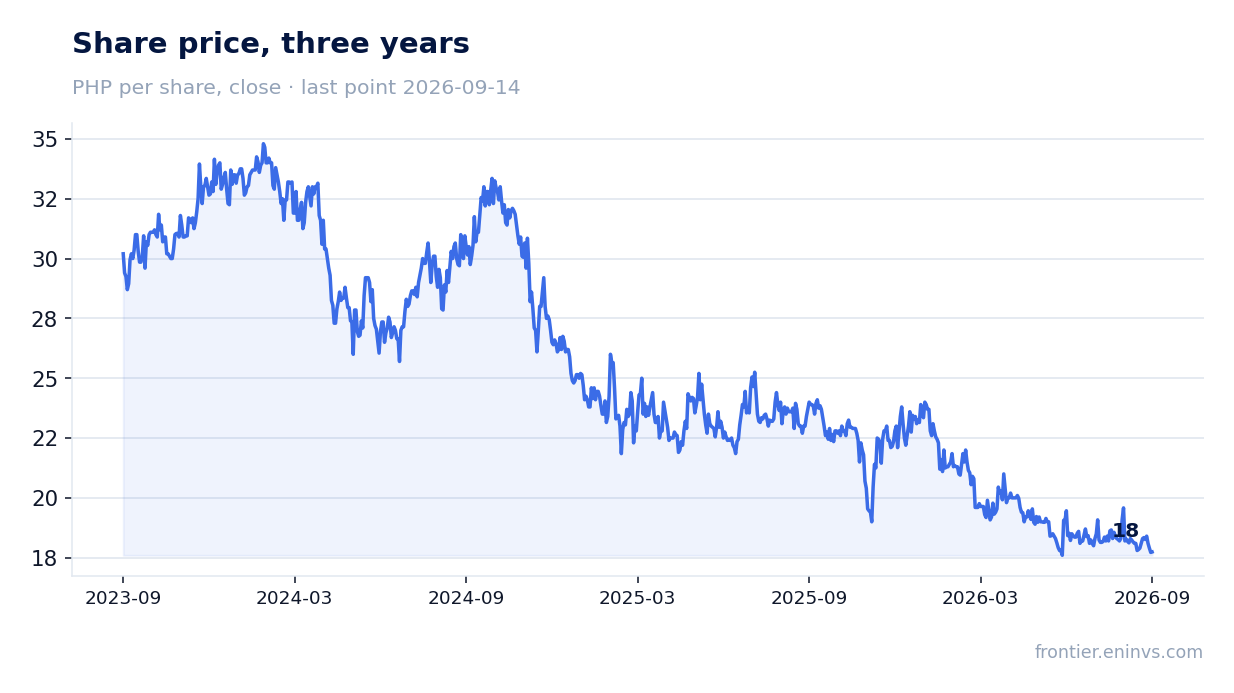
Valuation at 10.2 times earnings and 12.2 times EBITDA is below its multi-year average
SM Prime shares trade at a trailing-twelve-month P/E of 10.2 and EV/EBITDA of 12.2. This is below the averages of the past three years, when P/E often exceeded 15 and EV/EBITDA — 14. The current valuation implies that the market is pricing in either a slowdown in growth or risks related to debt load and margin compression.
Comparison with its own history shows that the stock is below its average valuation. This could be an opportunity to buy if the market's concerns are not confirmed. However, if margin continues to decline, the current multiple may not look so low relative to future earnings.
The portal's model estimates fair value at 17% above the current price. This is our own calculation based on EBITDA growth and a target multiple, not market consensus. It assumes that the company can maintain EBITDA at the current level or slightly increase it, and that the multiple remains stable.
The portal's model shows +17% upside to fair value, but that is our estimate, not consensus
Our fundamental model, based on EBITDA growth and a target multiple, shows upside to fair value of +17%. This is not market consensus or a target price, but the result of our own calculation. It assumes that the company maintains its current revenue growth rate and does not allow further margin compression.
The model is sensitive to two parameters: EBITDA dynamics and the target multiple. If EBITDA in the second half of 2026 remains at the second-quarter level (15.7 bn pesos), the annual figure may be lower than over the trailing twelve months, and then the upside would shrink. If margin recovers, the model could produce a higher valuation.
It is important to understand that the model does not account for possible one-off factors that could affect profit in either direction. It is also not a recommendation to buy or sell shares. It is merely a benchmark for assessing the current value of the business.
Valuation on the latest reported figures
Metric
Value
Market cap
502 bn PHP
P/E (LTM)
10.2
EV/EBITDA (LTM)
12.2
P/B
1.07
Net debt / EBITDA (LTM)
5.38
Operating cash flow (LTM)
74.9 bn
ROE
10.9%
Dividend yield (12m)
2.4%
Bottom line
In the second quarter of 2026, SM Prime showed revenue acceleration to 7.6% year on year, the best result in five quarters. However, net profit grew only 2.5%, and margin compressed to 33.8% from 35.5% — this is the main negative. Operating profit was flat year on year, and quarterly EBITDA fell to 15.7 bn pesos. Leverage remains high at 5.38 EBITDA, but interest expense is not rising, and operating cash flow over the trailing twelve months was 74.9 bn pesos. Valuation at 10.2 times earnings and 12.2 times EBITDA is below historical levels, and a dividend yield of 2.37% with a falling policy rate looks moderately attractive. The portal's model shows +17% upside to fair value. Overall, the share looks rather attractive, but the key question is whether the company can stop margin compression.
On August 13, PLDT released its H1 2026 results. Half-year revenue rose 2% to PHP 112,006 million, with Q2 revenue up 2.2% year-on-year to PHP 55,493 million. However, Q2 net profit fell 16.4% to PHP 7,616 million, and the net margin dropped to 13.7% from 16.8% a year earlier. Half-year adjusted EBITDA grew 1% to PHP 56,050 million, but quarterly EBITDA was only PHP 13,361 million versus PHP 25,938 million a year ago. At the current price, the stock trades at 8.7x trailing 12-month earnings and 8.7x EBITDA, below historical levels, while the 8.0% dividend yield remains the main support. Verdict: neutral — the dividend and valuation are attractive, but the quarterly EBITDA collapse and rising debt require confirmation of business stability.
Key takeaways
— Revenue grows for a second quarter, but growth is driven mainly by non-core segments
— Quarterly EBITDA halved due to one-off items, not operational deterioration
— Q2 net profit fell 16.4%, and the margin compressed to 13.7%
— Debt rose to PHP 286.4 billion, with net debt/EBITDA LTM at 4.69x
— The 8.0% dividend yield remains the main support for the stock
— Valuation at 8.7x earnings and 8.7x EBITDA LTM is below historical levels
Attractiveness
Key figures, PHP bn
Metric
Q2 2025
Q2 2026
Change
Revenue
54.3
55.5
+2.2%
EBITDA
23.8
—
—
Operating profit
14.8
13.4
-9.8%
Net profit
9.11
7.62
-16.4%
Operating cash flow
22.2
—
—
Capex
17.9
—
—
EBITDA margin
43.9%
—
—
Net margin
16.8%
13.7%
-3.1 pp
Revenue grows for a second quarter, but growth is driven mainly by non-core segments
Consolidated revenue for H1 2026 was PHP 112,006 million, up 2% from PHP 109,501 million a year earlier. Q2 revenue reached PHP 55,493 million, up 2.2% year-on-year. This is the second consecutive quarter of 2.2% year-on-year growth, following 2.2% in Q1 2026.
The wireless segment and device sales drove growth. Wireless revenue for the half-year rose 2% to PHP 52,292 million, while Fixed Line revenue fell 2% to PHP 65,897 million. Sales of devices and accessories increased to PHP 3,274 million from PHP 3,266 million a year earlier.
Within Fixed Line, dynamics were mixed: voice revenue rose to PHP 17,908 million from PHP 16,887 million, while data revenue fell to PHP 47,829 million from PHP 49,891 million. Corporate data and ICT declined to PHP 21,376 million from PHP 23,363 million, indicating weakness in the corporate segment.
Revenue and EBITDA by quarter
Quarterly EBITDA halved due to one-off items, not operational deterioration
Adjusted EBITDA for H1 2026 was PHP 56,050 million, up 1% from PHP 55,250 million a year earlier. However, in the standalone second quarter, EBITDA was only PHP 13,361 million versus PHP 25,938 million in Q2 2025. This sharp decline contrasts with stable growth in Q1, where EBITDA was PHP 26,046 million.
The quarterly EBITDA drop is explained by one-off items in the financial statements. In H1 2026, the company recorded manpower rightsizing program (MRP) expenses of PHP 375 million, accelerated depreciation of PHP 668 million, and write-down of noncurrent assets of PHP 118 million. Additionally, the reporting period lacked the one-time gain from the sale and leaseback of towers, which amounted to PHP 942 million in H1 2025.
Operating profit in Q2 2026 was PHP 13,361 million, matching EBITDA, whereas a year earlier operating profit was PHP 14,819 million with EBITDA of PHP 25,938 million. This discrepancy indicates that depreciation and one-off write-downs were minimal in the reporting quarter, and the main pressure on EBITDA came from one-time factors.
Net profit by quarter
Q2 net profit fell 16.4%, and the margin compressed to 13.7%
Q2 2026 net profit was PHP 7,616 million, down 16.4% from PHP 9,112 million in the same period of 2025. The net margin fell to 13.7% from 16.8% a year earlier. For H1, net profit was PHP 16,534 million versus PHP 17,513 million a year earlier, a 6% decline.
The profit decline is linked to higher expenses and the absence of one-off gains. Consolidated expenses for the half-year rose 4% to PHP 84,884 million, mainly due to higher depreciation, interconnection costs, and device costs. Other expenses net increased 7% to PHP 5,842 million due to net foreign exchange losses of PHP 1,365 million versus foreign exchange gains of PHP 1,406 million a year earlier.
Core income for the half-year remained virtually unchanged at PHP 17,329 million versus PHP 17,358 million a year earlier. This indicates that operational efficiency did not deteriorate, and the net profit decline was driven by volatile and one-off items.
Net debt at reporting dates
Debt rose to PHP 286.4 billion, with net debt/EBITDA LTM at 4.69x
Net debt at the latest reporting date was PHP 286,396 million, up PHP 13.9 billion from the previous reporting date and up PHP 11.7 billion over the past 12 months. The net debt to EBITDA ratio for the trailing 12 months is 4.69x. This is a level that warrants attention, although the direction of the ratio change is not disclosed.
Operating cash flow for the trailing 12 months was PHP 98,700 million. Capital expenditures for the half-year fell 30% to PHP 23,736 million from PHP 34,078 million a year earlier, freeing up cash. However, debt continued to rise, which may be linked to financing investments and dividend payments.
Interest expenses remain significant: net financing costs for the half-year were PHP 8,723 million. At the current debt and EBITDA levels, debt servicing remains manageable, but further growth in leverage could limit financial flexibility.
The 8.0% dividend yield remains the main support for the stock
The trailing 12-month dividend yield is 7.99%. This is a high level that supports investor interest in the stock. The company has historically paid out a significant portion of earnings as dividends, and the current yield exceeds that of many fixed-income instruments.
Core income for the half-year was PHP 17,329 million, virtually in line with last year. This provides a basis for stable dividend payments. However, net profit declined, and if one-off factors persist, this could pressure future dividend payments.
The company's dividend policy targets a payout of at least 60% of core income. At the current price and a yield of 8.0%, the stock looks attractive for income-oriented investors. The main risk is a decline in profit, which could lead to a dividend cut.
Share price, three years
Valuation at 8.7x earnings and 8.7x EBITDA LTM is below historical levels
The trailing 12-month price-to-earnings ratio is 8.73x, and EV/EBITDA is 8.74x. These levels are below the company's historical averages, which may indicate undervaluation. Market capitalisation is PHP 248,032 million.
Return on equity (ROE) for the trailing 12 months is 23.2%, a high figure indicating efficient use of capital. However, the high ROE is partly due to significant debt, which increases financial risk.
According to the portal's model, the upside to fair value is +10%. This is the portal's own estimate, not a market consensus. The stock is held in the portal's live model strategies, Frontier AI Selection, reflecting its compliance with the selection criteria.
Valuation on the latest reported figures
Metric
Value
Market cap
248 bn PHP
P/E (LTM)
8.7
EV/EBITDA (LTM)
8.7
P/B
1.94
Net debt / EBITDA (LTM)
4.69
Operating cash flow (LTM)
98.7 bn
ROE
23.2%
Dividend yield (12m)
8.0%
Bottom line
PLDT delivered mixed results for H1 2026. Revenue grew for a second consecutive quarter, and core income remained stable, indicating the health of the core business. However, quarterly EBITDA halved due to one-off items, and net profit fell 16.4%. Debt rose to PHP 286.4 billion, with a net debt/EBITDA ratio of 4.69x. The 8.0% dividend yield and valuation at 8.7x trailing earnings make the stock attractive for income-oriented investors, but high debt and profit volatility warrant caution. Verdict: neutral — the current valuation and dividend compensate for risks, but a sustained increase in EBITDA without one-off factors is needed to improve attractiveness.
On 25 August PH_UBP released its second-quarter 2026 results. Net profit for the reported period rose 69.3% year on year to PHP 3,078.3m, while net interest income added only 1.0% year on year to PHP 25,602.6m. Trailing-twelve-month profit reached PHP 13,662.0m, giving a P/E of 5.3 and an ROE of 6.0%. At the current price the stock looks rather attractive: the multiple sits below its own history, the 4.4% dividend yield exceeds the key rate, and the portal model implies 16% upside to fair value.
Key takeaways
— The 69.3% year-on-year profit increase is a low-base effect from last year, not an acceleration of the business
— Net interest income added only 1.0% year on year to PHP 25,602.6m – business growth has stalled
— Quarterly operating profit of PHP 4,202.8m against net profit of PHP 3,078.3m – the gap between operating and net result is narrow
— P/E of 5.3 with ROE of 6.0% – the market values the bank below book, making the 4.4% dividend yield more attractive
— The 4.4% dividend yield exceeds the key rate, but the payout rests on profit that reached PHP 13,662.0m over the last twelve months
— The portal model estimates 16% upside to fair value – this is our own calculation, not a market consensus
Attractiveness
Key figures, PHP bn
Metric
Q2 2025
Q2 2026
Change
Operating profit
2.41
4.20
+74.7%
Net profit
1.82
3.08
+69.3%
The 69.3% year-on-year profit increase is a low-base effect from last year, not an acceleration of the business
PH_UBP's net profit for the second quarter of 2026 was PHP 3,078.3m, up 69.3% from a year earlier. However, this growth is explained not by an improvement in the business but by a low base: in the second quarter of 2025, profit was only PHP 1,818.0m. Compared with the first quarter of 2026, when profit reached PHP 3,833.3m, the second-quarter result was 19.7% lower.
The main source of income – net interest income – barely grew: PHP 25,602.6m versus PHP 25,358.3m a year earlier, an increase of just 1.0%. This means that profit growth was not supported by growth in the core business. Most likely, the improvement came from cost cuts or one-off factors, but the provided data does not confirm specific causes.
For an investor, this is an important signal: the sustainability of profit is in question if it is not backed by growth in interest income. In the next report, one should watch the dynamics of net interest income – if it continues to stagnate, profit may return to more modest levels.
Revenue and EBITDA by quarter
Net interest income added only 1.0% year on year to PHP 25,602.6m – business growth has stalled
Net interest income in the second quarter of 2026 was PHP 25,602.6m, only 1.0% above the second quarter of 2025 (PHP 25,358.3m). This is a sharp deceleration compared with the first quarter of 2026, when the figure reached PHP 16,762.7m, and with the first quarter of 2025 (PHP 15,389.7m). However, comparison with the first quarter is incorrect due to different period lengths, but year on year growth is virtually absent.
This dynamic suggests that the bank is not increasing interest income, possibly due to margin pressure or weak loan portfolio growth. In a high key-rate environment, this is particularly alarming: if the bank cannot increase interest income, its ability to generate profit is limited.
For an investor, this means that the main driver of profit has stopped working. Without growth in net interest income, further profit increases are unlikely unless there is a significant cost reduction or one-off income.
Net profit by quarter
Quarterly operating profit of PHP 4,202.8m against net profit of PHP 3,078.3m – the gap between operating and net result is narrow
PH_UBP's operating profit in the second quarter of 2026 was PHP 4,202.8m, while net profit was PHP 3,078.3m. The difference between them – PHP 1,124.5m – is taxes and other non-operating items. Such a small gap indicates that the tax burden and other expenses do not consume a significant portion of the operating result.
For a bank, this is a normal situation, but it is important that operating profit also shows no growth: a year earlier it was PHP 2,406.1m, i.e. it grew by 74.7%. However, this growth, as with net profit, is due to the low base of the previous year, not to improved operating efficiency.
It is worth noting that in the first quarter of 2026, operating profit was PHP 4,752.2m, which is higher than in the second quarter. This confirms that the second quarter was weaker than the first, and the sustainability of profit is questionable.
P/E of 5.3 with ROE of 6.0% – the market values the bank below book, making the 4.4% dividend yield more attractive
The P/E multiple on trailing-twelve-month earnings is 5.3, and return on equity (ROE) is 6.0%. This means the market values the bank below its book value: with an ROE of 6.0%, a fair P/E could be higher if the market expected growth. The current valuation implies either stagnation or risks that the market prices in.
The trailing-twelve-month dividend yield is 4.4%, which is above the key rate. This makes the stock attractive for income-oriented investors. However, the sustainability of the dividend depends on the bank's ability to generate profit, and, as we have seen, growth in net interest income has stalled.
The portal model estimates 16% upside to fair value, confirming undervaluation. But this calculation is based on current earnings, and if profit declines, the upside may shrink.
The 4.4% dividend yield exceeds the key rate, but the payout rests on profit that reached PHP 13,662.0m over the last twelve months
PH_UBP's trailing-twelve-month dividend yield is 4.4%, which is above the current key rate. This makes the stock attractive for investors seeking regular income. However, it is important to understand that the dividend is paid out of profit, which over the last twelve months amounted to PHP 13,662.0m.
Trailing-twelve-month profit is the sum of four quarters and includes both strong and weak periods. If profit declines in the future, the dividend may be cut. For now, the payout ratio is not disclosed, but with profit of PHP 13,662.0m and a market capitalisation of PHP 72,795.1m, dividend payments look sustainable if profit does not fall.
For an investor, the key question is whether the bank can maintain profit at the current level. Given the stagnation in net interest income, there is a risk of a dividend cut, but the current 4.4% yield remains attractive against the key rate.
Share price, three years
The portal model estimates 16% upside to fair value – this is our own calculation, not a market consensus
According to the portal model, the upside potential for PH_UBP shares to fair value is 16%. This calculation is based on comparing ROE and P/B and is our own estimate, not a market consensus. It assumes that the current price is undervalued relative to the bank's fundamental value.
However, the model is sensitive to profit: if profit declines, fair value will also decrease. Given that net interest income is barely growing, the realisation of this upside depends on the bank's ability to maintain profit at the current level or find new sources of income.
For an investor, this means that the current price may be attractive, but growth is only possible if profit stabilises. In the next report, one should pay attention to the dynamics of net interest income and operating expenses.
Valuation on the latest reported figures
Metric
Value
Market cap
72.8 bn PHP
P/E (LTM)
5.3
P/B
0.36
ROE
6.0%
Dividend yield (12m)
4.4%
Bottom line
Bottom line: PH_UBP showed strong net profit growth of 69.3% year on year, but this growth is due to the low base of the previous year, not to an improvement in the business. Net interest income barely grew, which casts doubt on the sustainability of profit. At the same time, the stock trades at a P/E of 5.3 and a dividend yield of 4.4%, above the key rate, and the portal model implies 16% upside. The verdict is rather attractive, but confirmation of the trend requires growth in net interest income in the coming quarters.
On 25 August ICTSI released its Q2 2026 results. Revenue grew 25.3% year on year, net profit – by 33.7%, to USD 326.7 million, and the net margin rose to 34.1% from 31.9%. At the same time, quarterly EBITDA declined versus the previous quarter, while leverage remains at 0.81x LTM EBITDA. In our view, the share looks neutral: the business continues to grow, but this is already priced in – EV/EBITDA of 14.7 against a portal-model upside of just +6%.
Key takeaways
— Revenue grows at double-digit rates but is decelerating: from 28.9% in Q1 to 25.3% in Q2
— Quarterly EBITDA fell to USD 509.4 million – the first decline in five quarters
— Net profit rose 33.7%, but was supported by one-off income rather than operating efficiency
— Leverage at 0.81x LTM EBITDA is comfortable, but absolute debt rose by RUB 1.3 bn in the quarter
— Trailing dividend yield of 1.81% is low for the market, but the payout ratio remains high
— EV/EBITDA of 14.7 is above the historical average, and the portal-model upside is just +6%
Attractiveness
Key figures, USD bn
Metric
Q2 2025
Q2 2026
Change
Revenue
0.77
0.96
+25.3%
EBITDA
0.50
—
—
Operating profit
0.41
0.51
+22.8%
Net profit
0.24
0.33
+33.7%
Operating cash flow
0.36
—
—
Capex
0.07
—
—
EBITDA margin
64.8%
—
—
Net margin
31.9%
34.1%
+2.2 pp
Revenue grows at double-digit rates but is decelerating: from 28.9% in Q1 to 25.3% in Q2
In Q2 2026, ICTSI revenue reached USD 958.7 million, up 25.3% year on year. This is the second consecutive quarter with growth above 25%, but the pace slowed: in Q1 growth was 28.9%. The deceleration is due to a high base: in Q2 2025 revenue had already grown 11.9%.
The main contribution comes from the Americas segment: in Q1 2026 revenue there rose to USD 373.0 million from 282.2 million a year earlier, or 32%. The EMEA segment grew 48% to USD 212.2 million, helped by the start of operations in Durban (South Africa) on 1 January 2026. The Asia segment grew 17.5% to USD 375.9 million.
The consolidation of Durban Gateway Terminal (DGT) added USD 68.0 million of revenue in Q1 2026 but contributed only USD 1.5 million of net income attributable to equity holders. This means the new asset is still operating at low profitability, putting pressure on the overall margin.
Revenue dynamics remain strong, but the market already prices in these growth rates. Further growth requires either an acceleration in organic growth or improved profitability of new assets.
Revenue and EBITDA by quarter
Quarterly EBITDA fell to USD 509.4 million – the first decline in five quarters
EBITDA in Q2 2026 was USD 509.4 million, down 6.7% from Q1 (USD 617.8 million). This is the first quarterly decline in EBITDA since Q1 2025. Year on year, EBITDA is still higher: in Q2 2025 it was USD 495.7 million, implying growth of 2.8%.
The quarter-on-quarter decline is explained by higher operating expenses. In Q1 2026, manpower costs rose to USD 144.6 million from 94.8 million a year earlier, driven by the DGT consolidation and inflation. Equipment and facilities-related expenses rose to USD 61.0 million from 47.0 million.
The EBITDA margin in Q2 2026 was 53.1% (509.4 / 958.7), down from 64.3% in Q1 but also down from 64.8% in Q2 2025 (495.7 / 765.1). This is a significant year-on-year deterioration that requires explanation.
The main reason is the rise in depreciation and interest expenses, which are not included in EBITDA but affect net profit. However, the quarter-on-quarter decline in EBITDA is a warning sign that may indicate pressure on operating efficiency.
Net profit by quarter
Net profit rose 33.7%, but was supported by one-off income rather than operating efficiency
Net profit in Q2 2026 was USD 326.7 million, up 33.7% year on year (USD 244.3 million). The net margin rose to 34.1% from 31.9%. However, this growth was not driven by operating performance: EBITDA grew only 2.8% year on year, while net profit grew 33.7%.
The difference is explained by one-off factors. In Q1 2026, the company sold its 51% stake in Yantai International Container Terminal, recording a loss of USD 14.7 million, but also received income from revaluation and other items. In addition, the report notes that in Q1 2026 the company received a USD 5.0 million government grant, which also supported profit.
It is also important to note that net profit includes the share of non-controlling interests. Profit attributable to equity holders of the parent was USD 293.6 million in Q1 2026, up 22.6% year on year. In Q2 2026, total net profit was USD 326.7 million, but the profit attributable to parent shareholders may be lower.
Thus, the 33.7% growth in net profit looks impressive, but it does not reflect sustainable operating dynamics. Without one-off income, growth would have been more modest.
Net debt at reporting dates
Leverage at 0.81x LTM EBITDA is comfortable, but absolute debt rose by RUB 1.3 bn in the quarter
Net debt at the latest reporting date was USD 1,791.7 million, and the net debt / LTM EBITDA ratio was 0.81. This is a comfortable level for an infrastructure company, leaving room for manoeuvre. However, absolute net debt rose by RUB 1.3 bn compared to the previous reporting date and by RUB 0.6 bn over the last 12 months.
The increase is linked to the acquisition of Durban Gateway Terminal for USD 618.0 million and the consolidation of FII Inhaúma. These deals increased assets but also added debt. The report notes that the company raised long-term borrowings of USD 13.3 million in Q1 2026 and repaid USD 10.1 million.
Interest expenses remain significant: in Q1 2026, interest on borrowings was USD 39.1 million, on leases – USD 42.4 million, on concession rights – USD 16.3 million. Total interest expenses exceed USD 97 million per quarter, eating a substantial part of operating profit.
The debt level is not a concern, but its growth and high interest expenses limit the scope for dividend increases or share buybacks.
Trailing dividend yield of 1.81% is low for the market, but the payout ratio remains high
The trailing 12-month dividend yield is 1.81%. This is lower than many emerging-market companies and below the key rate. However, this reflects not low payouts but a high valuation: market capitalisation is USD 30,763.7 million, and dividends over the last 12 months were about USD 557 million.
In Q1 2026, the company paid dividends of USD 615.8 million (of which USD 54.5 million to non-controlling interests). This is a significant amount exceeding quarterly net profit. The high payout is explained by the distribution of prior-period profits.
Our estimate for the 2026 dividend: assuming a payout ratio of about 50% of net profit and expected annual net profit of around USD 1.3 billion, the dividend could be about USD 650 million, or roughly USD 0.32 per share. At the current price, this implies a yield of about 2.1%. However, this estimate depends on profit, which may be reduced by one-off factors.
The risk of a dividend cut is linked to rising capital expenditures and debt. If the company continues to actively acquire assets, as with DGT, free cash flow may come under pressure, limiting payouts.
Share price, three years
EV/EBITDA of 14.7 is above the historical average, and the portal-model upside is just +6%
LTM EV/EBITDA is 14.7, P/E – 25.5. This is above the historical average for a company that typically traded at an EV/EBITDA of around 10–12. The current valuation implies that the market expects high growth rates to continue and profitability to improve.
Our valuation model (portal model) gives an upside to fair value of just +6%. This means the share is trading close to its fair value, and further growth is possible only if earnings exceed expectations or operating efficiency improves.
For comparison: ROE is 53.8%, which is very high and indicates efficient use of capital. However, the high ROE is partly explained by the effect of financial leverage and one-off income.
Thus, the valuation looks fair but leaves little room for growth. To become more attractive, either earnings growth must exceed expectations or risks must decline.
Valuation on the latest reported figures
Metric
Value
Market cap
30.8 bn USD
P/E (LTM)
25.5
EV/EBITDA (LTM)
14.7
P/B
12.40
Net debt / EBITDA (LTM)
0.81
Operating cash flow (LTM)
0.49 bn
ROE
53.8%
Dividend yield (12m)
1.8%
Bottom line
Bottom line: ICTSI showed strong revenue and net profit growth, but the quality of this growth is questionable. Quarterly EBITDA declined, while net profit grew mainly due to one-off factors. Leverage is comfortable but rising, and the dividend yield is low. EV/EBITDA of 14.7 leaves little upside. In our view, the share looks neutral: the current price already reflects market expectations, and a sustained improvement in operating efficiency is needed to justify a higher valuation.
P/E and EV/EBITDA use LTM from up to four quarter rows when they look comparable (incl. Q2/Q4); if the feed is only Q1 and Q3, we use latest FY profit/EBITDA instead of summing them. P/B is market cap ÷ latest FY equity. Hover multiples for the exact formula. Financial rows: year(period_end) ≥ max(2023, current calendar year − 2) (hide older).