PH_ICT: revenue and EBITDA up 26–29%, but quarterly operating cash flow turned negative at $796M

On March 31, 2026, PH_ICT reported results for Q1 2026. Revenue grew 28.9% to $961.1M, EBITDA rose 26.2% to $617.8M, and net profit increased 20.6% to $314.7M. However, quarterly operating cash flow was negative $796.0M, a sharp reversal from positive $449.0M a year earlier. At the current price, the share looks rather attractive: growth is accelerating, leverage is moderate, and the dividend yield supports the valuation.
Key takeaways
— Q1 2026 revenue grew 28.9% to $961.1M, accelerating from 23.5% in Q4 2025
— EBITDA margin declined from 65.7% to 64.3% due to higher manpower costs and other expenses
— Net profit rose 20.6%, but lagged revenue growth due to one-off losses on asset disposals
— Quarterly operating cash flow turned negative at $796.0M — the main negative in the report
— Leverage: net debt / EBITDA LTM = 0.81, but absolute debt rose by $0.5B during the quarter
— Dividends for 2025 totaled $615.8M, corresponding to a 1.9% trailing yield
— The portal's model implies +6% upside to the current price
Attractiveness
Key figures, USD bn
| Metric | Q1 2025 | Q1 2026 | Change |
|---|---|---|---|
| Revenue | 0.75 | 0.96 | +28.9% |
| EBITDA | 0.49 | 0.62 | +26.2% |
| Operating profit | 0.41 | 0.51 | +23.9% |
| Net profit | 0.26 | 0.31 | +20.6% |
| Operating cash flow | 0.45 | 0.61 | +36.1% |
| Capex | 0.08 | 0.08 | +7.8% |
| EBITDA margin | 65.7% | 64.3% | -1.4 pp |
| Net margin | 35.0% | 32.7% | -2.3 pp |
Q1 2026 revenue grew 28.9% to $961.1M, accelerating from 23.5% in Q4 2025
In Q1 2026, PH_ICT reported revenue of $961.1M, up 28.9% year-on-year. This is an acceleration from the 23.5% growth in Q4 2025. All three geographic segments contributed: Asia rose to $375.9M, EMEA to $212.2M, and the Americas to $373.0M.
Container volumes grew 17.7% to 4,084,901 TEUs for the quarter. Revenue grew faster than volumes, indicating an improved cargo mix or higher tariffs. The company continues to expand its concession portfolio: it began operations in Durban (South Africa) in January 2026 and signed an extension in Melbourne until 2066 in February.
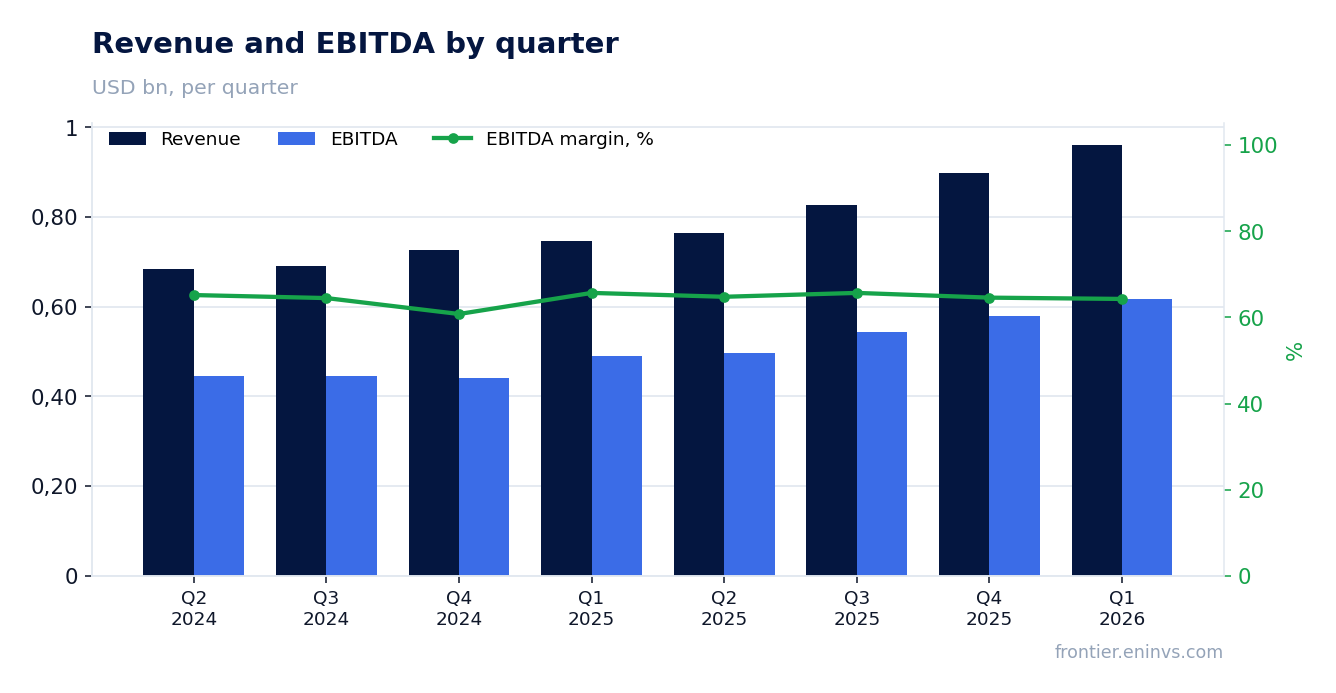
EBITDA margin declined from 65.7% to 64.3% due to higher manpower costs and other expenses
EBITDA for Q1 2026 amounted to $617.8M, up 26.2% year-on-year. The EBITDA margin declined from 65.7% to 64.3%. Pressure on margin came from manpower costs, which rose from $94.8M to $144.6M, and other operating expenses, up from $45.9M to $56.1M.
The 52.5% increase in manpower costs significantly outpaced revenue growth, possibly reflecting business expansion (new concessions) and wage inflation. Nevertheless, the EBITDA margin remains high at above 64%, confirming the company's operational efficiency.
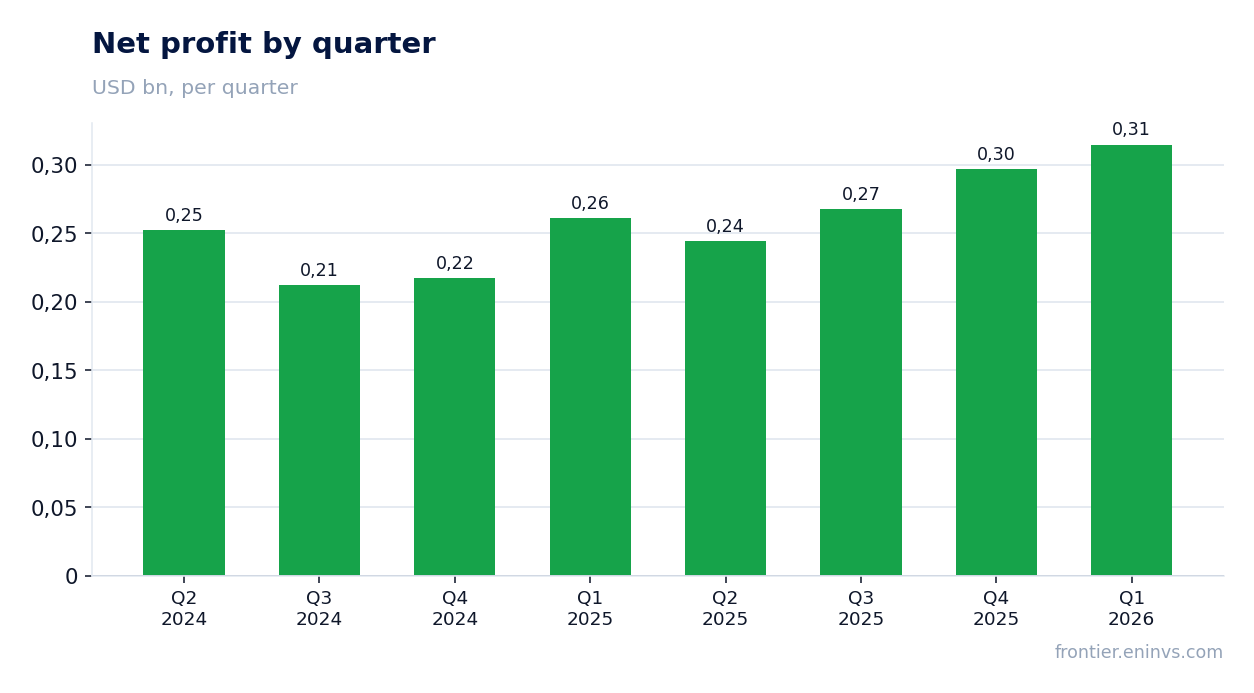
Net profit rose 20.6%, but lagged revenue growth due to one-off losses on asset disposals
Net profit for Q1 2026 was $314.7M, up 20.6% year-on-year. Profit growth lagged revenue (28.9%) due to one-off losses. In March 2026, the company sold its 51% stake in Chinese terminal YICTL, resulting in a loss of $14.7M, mainly due to reclassification of cumulative translation adjustments.
Excluding this loss, net profit would have grown by approximately 26%, closer to EBITDA dynamics. Net margin declined from 35.0% to 32.7%, reflecting both one-off factors and higher depreciation after acquisitions.
Quarterly operating cash flow turned negative at $796.0M — the main negative in the report
Operating cash flow (OCF) for Q1 2026 was negative $796.0M versus +$449.0M a year earlier. This sharp deterioration is related to working capital changes: receivables increased by $35.6M, inventories and prepayments rose, and a significant increase in accounts payable of $119.8M did not offset the outflow.
The key reason for negative OCF is likely the DGT acquisition in South Africa: the company paid $618.0M in December 2025, but this amount is not reflected as an operating outflow in Q1 2026 because it was paid earlier. Nevertheless, negative quarterly OCF is a warning sign, especially amid high capital expenditures.
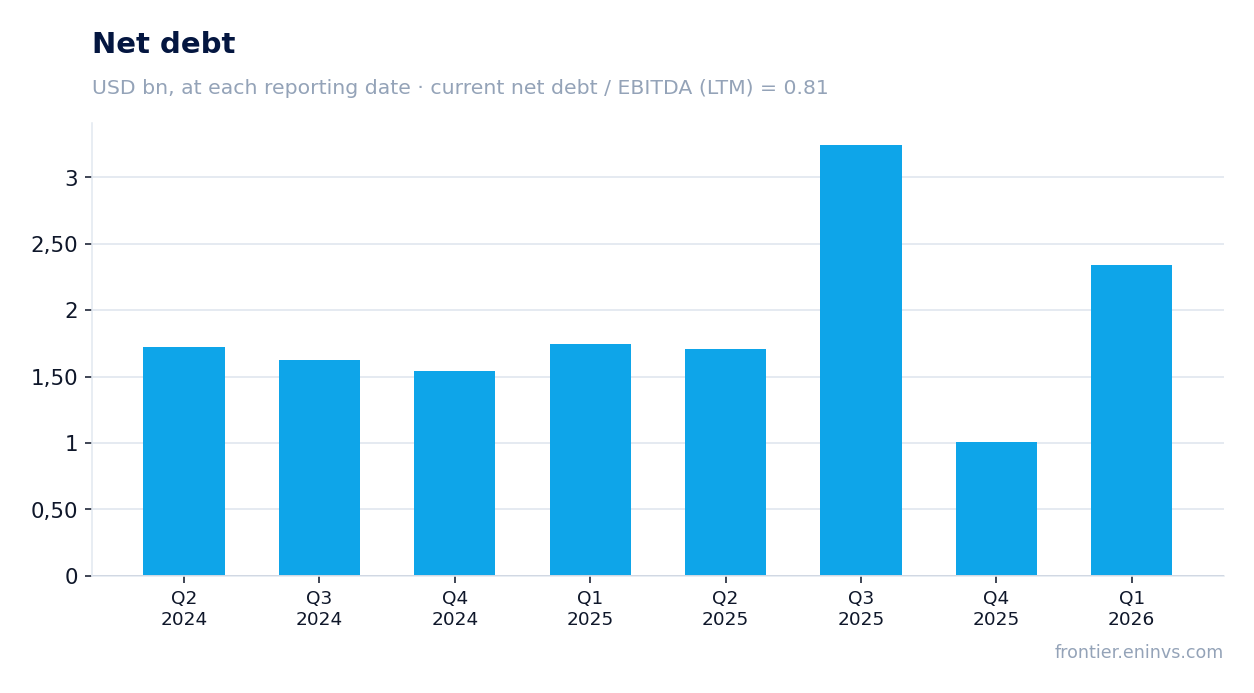
Leverage: net debt / EBITDA LTM = 0.81, but absolute debt rose by $0.5B during the quarter
At the end of Q1 2026, net debt stood at $1,791.7M, corresponding to a net debt / EBITDA LTM ratio of 0.81. During the quarter, net debt increased by $0.5B, and over the last 12 months by $0.6B. The increase is related to acquisitions, including DGT and expansion in Brazil.
Despite the rise in absolute debt, the net debt / EBITDA ratio remains low — below 1.0, providing significant financial headroom. Interest expenses for the quarter were $39.1M on borrowings, $16.3M on concession rights payable, and $42.4M on lease liabilities — totaling about $97.8M, covered by operating profit.
Dividends for 2025 totaled $615.8M, corresponding to a 1.9% trailing yield
In Q1 2026, the company paid dividends totaling $615.8M (including previously declared dividends). Over the last 12 months, the dividend yield was 1.91% based on the current market capitalization of $31,489.9M. This is a moderate level, but it is supported by growing profits.
The company does not disclose a formal dividend policy, but historically it pays out a significant portion of free cash flow. Given current profit levels and low leverage, payouts are likely to continue. The main risk to dividends is the negative operating cash flow in the reported quarter, which could constrain free funds.
The portal's model implies +6% upside to the current price
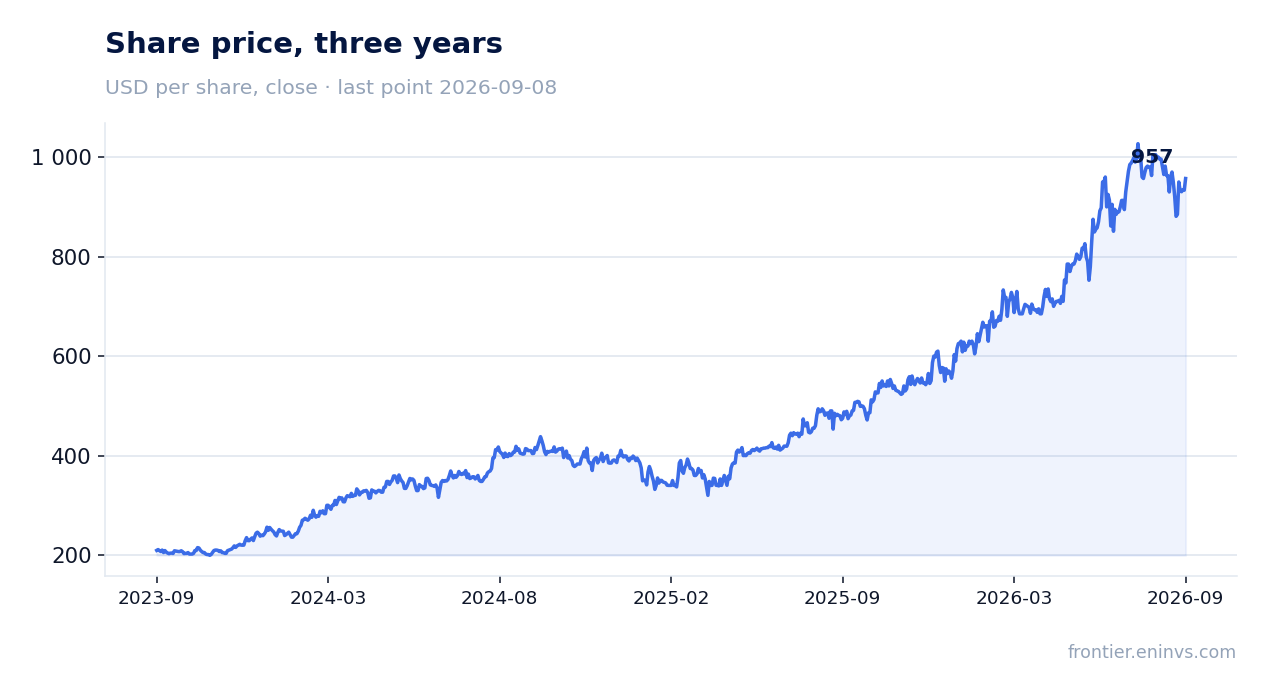
Our fundamental value-creation model, based on EBITDA growth and a target multiple, implies an upside of +6% to the current price. This is a moderate upside, reflecting an already high valuation: P/E LTM is 28.0, EV/EBITDA LTM is 15.1.
The share trades at a premium to its own historical levels, justified by accelerating revenue and EBITDA growth. ROE is 51.6%, indicating high capital efficiency. Further valuation upside would require sustaining current growth rates and improving cash flow.
Valuation on the latest reported figures
| Metric | Value |
|---|---|
| Market cap | 31.5 bn USD |
| P/E (LTM) | 28.0 |
| EV/EBITDA (LTM) | 15.1 |
| P/B | 12.69 |
| Net debt / EBITDA (LTM) | 0.81 |
| Operating cash flow (LTM) | 0.49 bn |
| ROE | 51.6% |
| Dividend yield (12m) | 1.9% |
Bottom line
PH_ICT delivered a strong quarter: revenue and EBITDA grew more than 26%, driven by portfolio expansion and volume growth. However, operating cash flow turned deeply negative, which is a serious warning despite low leverage. The dividend yield is moderate but supported by growing profits. The share trades at a premium to its own history, and the portal's model implies only +6% upside. Verdict: rather attractive — growth is strong, but cash flow and valuation warrant caution.
Open the company's financial profile ICT →
See also: market overview · valuation map · stock screeners