SM Investments: revenue grows, but the main driver is banking and property profitability

On April 29, 2026, SM Investments Corporation reported first quarter 2026 results. Revenue grew 4.9% YoY to PHP 159,405 million, EBITDA rose 4.0% to PHP 45,493 million, and net profit increased 5.7% to PHP 29,189 million. The shares trade at P/E LTM 5.4 and EV/EBITDA LTM 5.6, which looks attractive given stable growth and moderate debt, but the bulk of profit comes from the banking segment rather than operating divisions.
Key takeaways
— Q1 2026 revenue grew 4.9% to PHP 159,405 million, but retail segment added only 5.6% and property declined 15.8%
— EBITDA margin fell from 28.1% to 27.9% due to higher retail costs and lower property sales
— Net profit rose 5.7% to PHP 29,189 million, with banking segment contributing 37% of total profit
— Operating cash flow grew 7.8% to PHP 10,550 million, but investments in property and equipment totaled PHP 15,842 million, leading to negative free cash flow
— Net debt decreased by PHP 1.7 billion over 12 months but increased by PHP 83.8 billion from the previous reporting date; Net debt/EBITDA LTM stands at 2.05
— Capex in Q1 2026 was PHP 2,856 million, below the year-ago level (PHP 2,143 million), but the bulk of investment goes through investment properties
— According to the portal's model, the share has +19% upside from the current price, confirming valuation attractiveness
Attractiveness
Key figures, PHP bn
| Metric | Q1 2025 | Q1 2026 | Change |
|---|---|---|---|
| Revenue | 152 | 159 | +4.9% |
| EBITDA | 42.7 | 44.4 | +4.0% |
| Operating profit | 36.1 | 38.4 | +6.5% |
| Net profit | 27.6 | 29.2 | +5.7% |
| Operating cash flow | 9.79 | 10.6 | +7.8% |
| Capex | 2.14 | 2.86 | +33.3% |
| EBITDA margin | 28.1% | 27.9% | -0.2 pp |
| Net margin | 18.2% | 18.3% | +0.1 pp |
Q1 2026 revenue grew 4.9% to PHP 159,405 million, but retail segment added only 5.6% and property declined 15.8%
In Q1 2026, SM Investments' consolidated revenue reached PHP 159,405 million, up 4.9% YoY. The main contributors were retail and banking: retail revenue increased from PHP 99,994 million to PHP 105,577 million (+5.6%), and banking (share in BDO and Chinabank) from PHP 10,665 million to PHP 10,906 million (+2.3%). Retail growth was driven by merchandise sales, which rose from PHP 97,099 million to PHP 102,632 million.
The weak spot was the property segment: revenue fell slightly from PHP 30,647 million to PHP 30,987 million, but real estate sales dropped from PHP 9,217 million to PHP 7,757 million (–15.8%). Rental revenue, however, grew from PHP 16,518 million to PHP 17,965 million (+8.8%), partially offsetting the decline. Portfolio investments (2GO, geothermal energy, Belle, etc.) added 12.3%, from PHP 10,005 million to PHP 11,240 million.
Thus, consolidated revenue growth was mainly driven by retail and banking, while the property development business experienced a sales decline. This matters because the property segment traditionally generates high margins and stable cash flow.
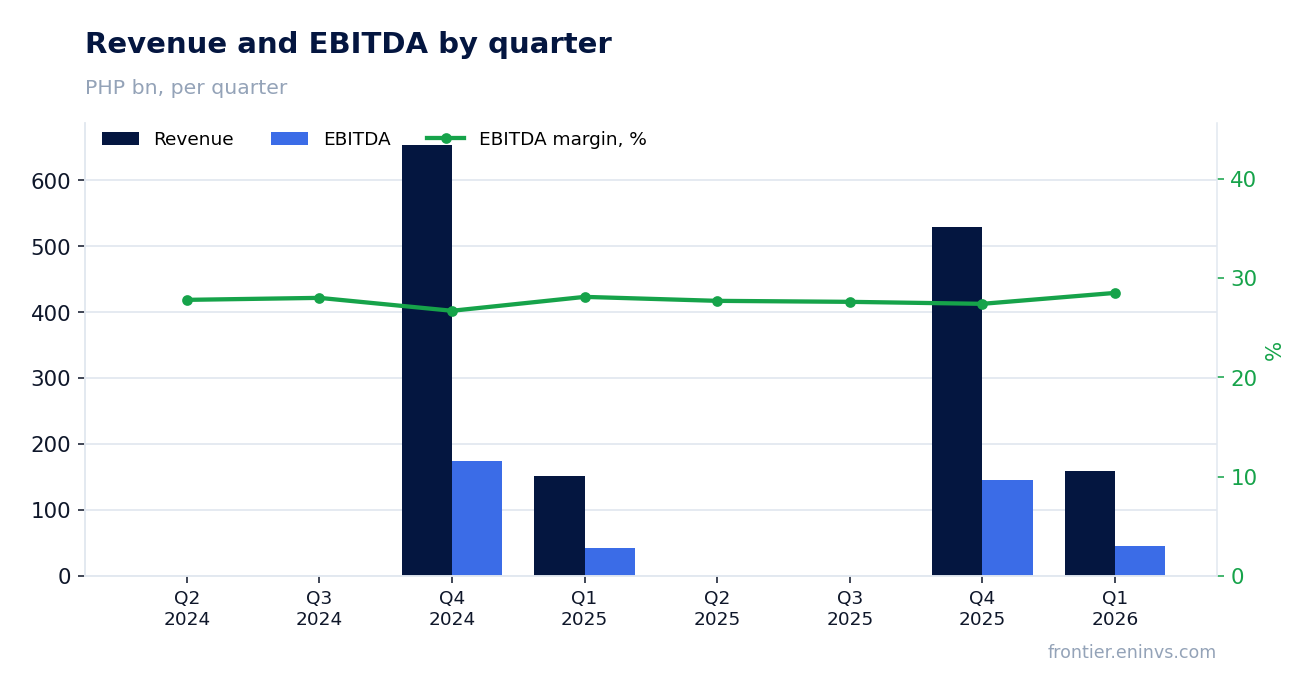
EBITDA margin fell from 28.1% to 27.9% due to higher retail costs and lower property sales
EBITDA for Q1 2026 was PHP 45,493 million versus PHP 42,701 million a year earlier (+4.0%). However, margin slightly declined from 28.1% to 27.9%. The reason is the revenue mix: the share of low-margin retail increased, while high-margin property sales contracted.
Cost of merchandise sold rose from PHP 70,913 million to PHP 73,916 million (+4.2%), almost in line with sales growth. Meanwhile, cost of real estate sold decreased from PHP 3,913 million to PHP 3,817 million, but revenue fell more, squeezing segment margin.
Operating profit increased from PHP 36,054 million to PHP 38,402 million (+6.5%), slightly better than EBITDA dynamics due to cost control. Net margin remained nearly stable: 18.3% versus 18.2% a year earlier.
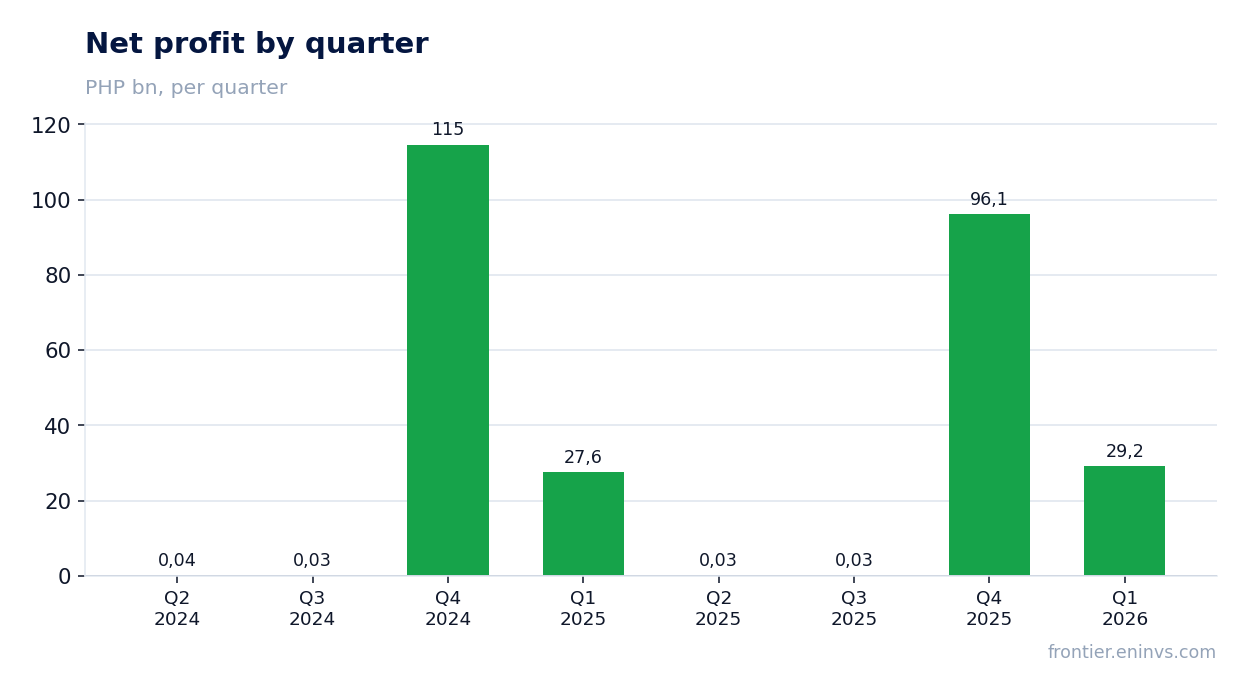
Net profit rose 5.7% to PHP 29,189 million, with banking segment contributing 37% of total profit
Net profit for Q1 2026 was PHP 29,189 million versus PHP 27,606 million a year earlier. The main source was banking: the share in BDO and Chinabank contributed PHP 10,906 million of net profit, or 37% of the consolidated result. This is typical for SMIC, but it is important to remember that banking profit depends on the credit cycle and interest rates.
The property segment earned PHP 11,886 million of net profit (almost unchanged), retail – PHP 4,435 million (+13.2%), portfolio investments – PHP 1,966 million (+58.9%). The growth in portfolio investments is related to improved results at 2GO and other associates.
Among other income, one-off items are visible: forfeiture income amounted to PHP 0.3 billion versus PHP 0.4 billion a year earlier. The company also received dividends from associates of PHP 3,774 million, partially offsetting lower interest income.
Operating cash flow grew 7.8% to PHP 10,550 million, but investments in property and equipment totaled PHP 15,842 million, leading to negative free cash flow
Operating cash flow in Q1 2026 was PHP 10,550 million versus PHP 9,788 million a year earlier (+7.8%). The improvement was driven by higher pre-tax profit and a positive contribution from working capital changes, although inventories increased by PHP 7,785 million and accounts payable decreased by PHP 15,537 million.
Investing activities consumed PHP 9,451 million, with major items being additions to investment properties (PHP 12,986 million) and property and equipment (PHP 2,856 million). In total, this is PHP 15,842 million, significantly exceeding operating cash flow. Free cash flow (OCF minus capex) is negative: approximately –PHP 5,292 million.
The negative free cash flow is covered by borrowing: net proceeds from bank loans and long-term debt totaled PHP 37,239 million (52,849 + 24,019 – 15,610 – 61,359). This explains the increase in net debt from the previous reporting date.
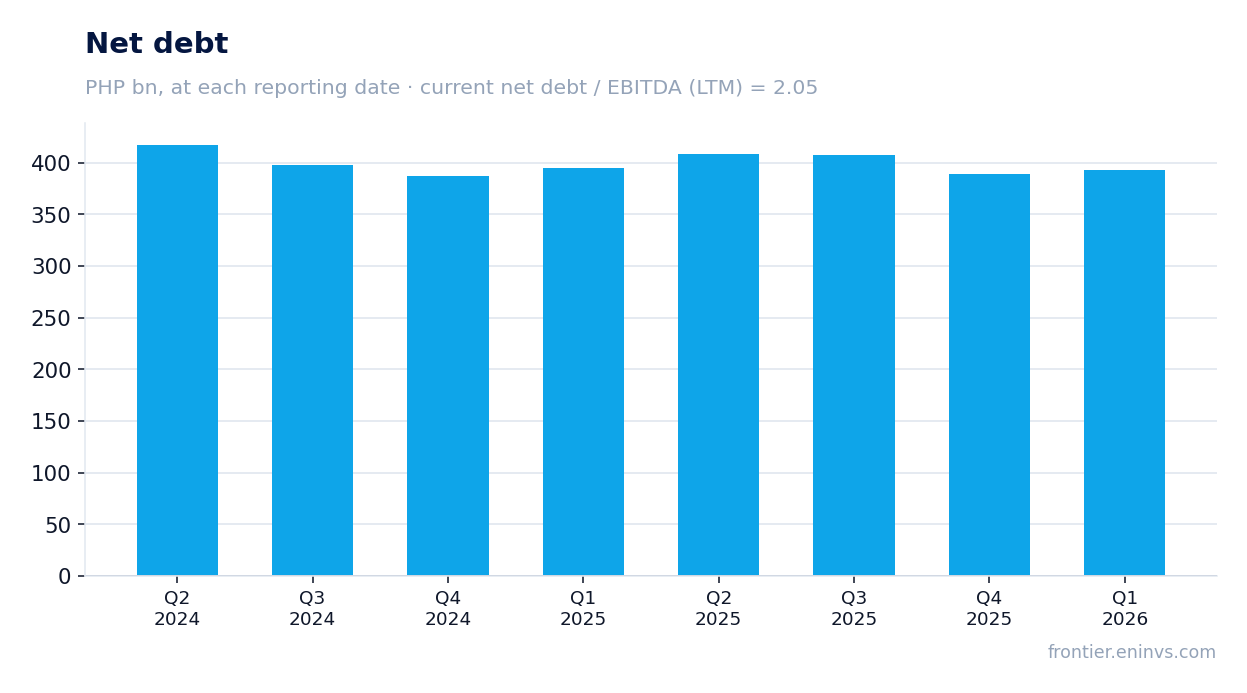
Net debt decreased by PHP 1.7 billion over 12 months but increased by PHP 83.8 billion from the previous reporting date; Net debt/EBITDA LTM stands at 2.05
At the end of Q1 2026, SM Investments' net debt stood at PHP 389,389 million. Over the last 12 months it decreased by PHP 1.7 billion, but compared to the previous reporting date (December 31, 2025) it increased by PHP 83.8 billion. This is due to seasonal short-term borrowing to finance working capital and investments.
Net debt / EBITDA LTM is 2.05 – a moderate level for a diversified holding. Interest expenses in Q1 fell from PHP 5,709 million to PHP 5,268 million (–7.7%), reflecting lower rates or refinancing.
Debt burden remains manageable, but the quarterly increase warrants attention: if property investments continue at this pace and operating cash flow does not accelerate, free cash flow will remain negative.
Capex in Q1 2026 was PHP 2,856 million, below the year-ago level (PHP 2,143 million), but the bulk of investment goes through investment properties
Capital expenditures in the cash flow statement are shown as additions to property and equipment: PHP 2,856 million in Q1 2026 versus PHP 2,143 million a year earlier. However, this is only part of the investment: additions to investment properties were PHP 12,986 million, totaling PHP 15,842 million with capex.
Property investments include construction and development of malls, residential complexes, and office buildings. The company continues to expand its portfolio despite weak property sales, indicating a long-term strategy.
For shareholders, the trailing twelve-month dividend yield is 3.02%, which is below the market average, but at the current valuation (P/E 5.4) it corresponds to a reasonable payout level.
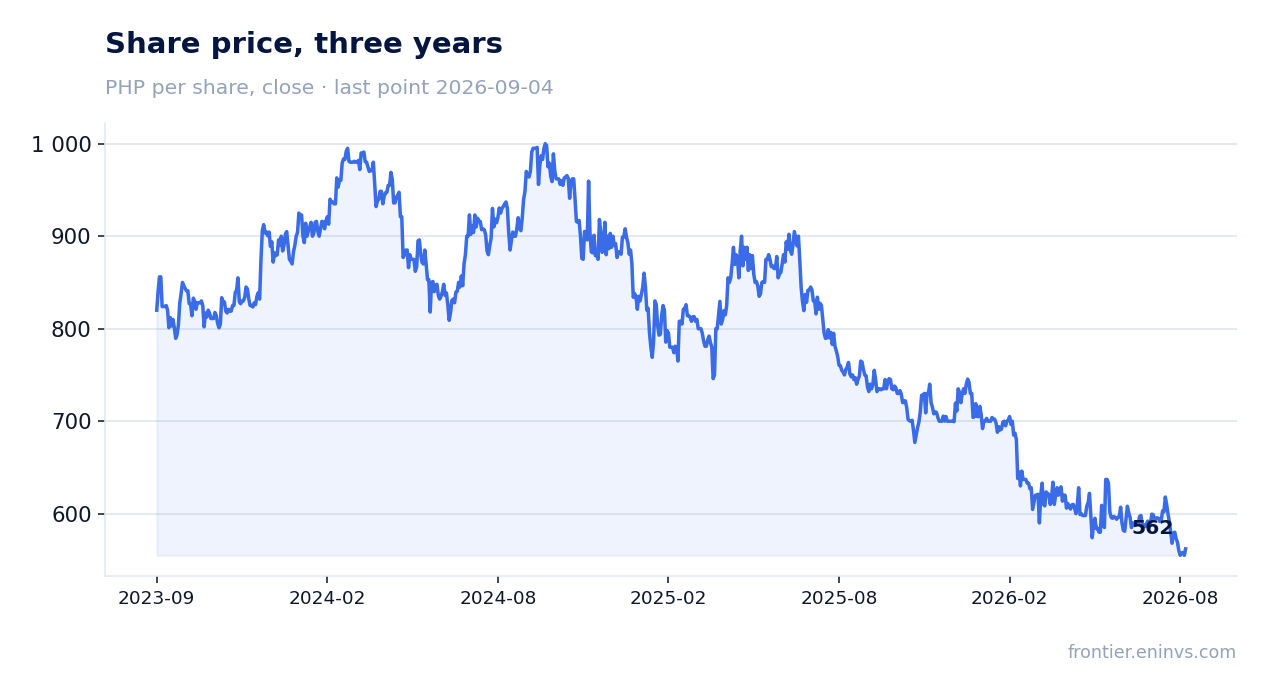
According to the portal's model, the share has +19% upside from the current price, confirming valuation attractiveness
Our fundamental value-creation model, based on EBITDA growth and target multiple, estimates the share's upside at +19% from the current market price. This implies the market prices the company cheaper than it is worth given expected profit growth.
Current multiples – P/E LTM 5.4 and EV/EBITDA LTM 5.6 – look low for a holding with ROE 12.1% and stable revenue growth. However, investors likely discount risks from the banking cycle and dependence on the Philippine property market.
SMIC shares are included in our live portfolio strategy PH FVC (quality). This reflects the company's fit with our screening criteria, but is not a buy recommendation.
Valuation on the latest reported figures
| Metric | Value |
|---|---|
| Market cap | 678 bn PHP |
| P/E (LTM) | 5.4 |
| EV/EBITDA (LTM) | 5.6 |
| P/B | 0.71 |
| Net debt / EBITDA (LTM) | 2.05 |
| Operating cash flow (LTM) | 117 bn |
| ROE | 12.1% |
| Dividend yield (12m) | 3.0% |
Bottom line
SM Investments reported moderate revenue and profit growth for Q1 2026, but the quality of growth is mixed: retail and banking are pulling up, while property, traditionally a high-margin business, is contracting. Operating cash flow grew but is insufficient to cover investments, leading to negative free cash flow and higher debt. Nevertheless, valuation remains attractive: P/E 5.4 and EV/EBITDA 5.6 are below historical averages for a quality holding, and the portal's model shows +19% upside. The key question for holders is whether the property segment can recover and whether the banking cycle deteriorates. At the current price, the shares look rather attractive than fairly valued.
Open the company's financial profile SM →
See also: market overview · valuation map · stock screeners