IDGC Center & Volga: Q1 2026 profit up 26%, net debt turns negative – the company became a net lender
15 мая 2026 года МРСК ЦП раскрыла результаты за первый квартал 2026 года: выручка выросла на 13,9% год к году, до 46,4 млрд руб., EBITDA – на 18,6%, до 15,9 млрд руб., чистая прибыль – на 26,0%, до 8,8 млрд руб.. В обзоре разберём, что стоит за этими цифрами: рост маржинальности, отрицательный чистый долг и что это значит для акционеров.
Key takeaways
— Выручка за I квартал 2026 выросла на 13,9% год к году, до 46,4 млрд руб., на фоне роста тарифов и полезного отпуска
— EBITDA-маржа достигла 34,3% против 33,0% годом ранее – операционная эффективность продолжает улучшаться
— Чистая прибыль за квартал выросла на 26,0%, до 8,8 млрд руб., благодаря операционному рычагу и контролю над расходами
— Чистый долг на конец марта 2026 года стал отрицательным: -4,96 млрд руб. – компания впервые стала нетто-кредитором
— Операционный денежный поток за квартал составил 13,2 млрд руб., что покрывает капзатраты в 6,7 млрд руб. с запасом
— Дивидендная доходность за последние 12 месяцев – 15,1%, а наш прогноз на следующий платёж – 0,08 руб. на акцию, что даёт форвардную доходность 16,6%
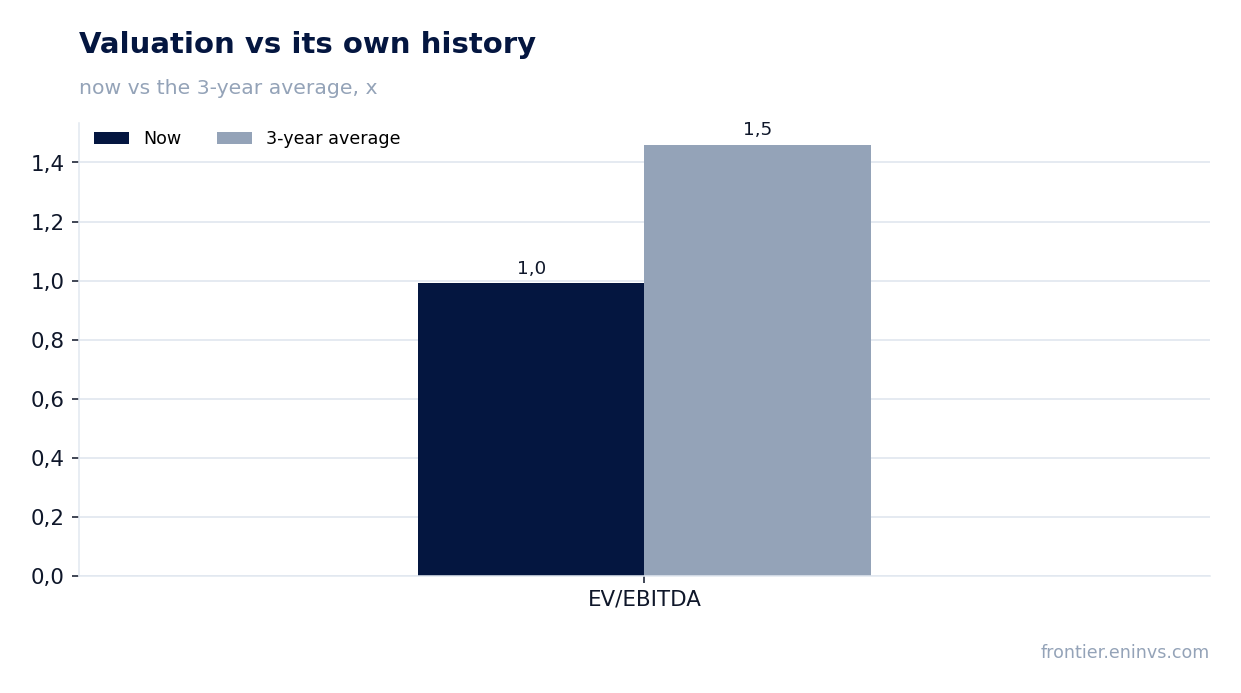
— Акции торгуются с P/E 2,16 и EV/EBITDA 0,99 – заметно ниже среднего за три года (1,46), что отражает недоверие рынка к устойчивости результатов
Key figures, RUB bn
| Metric | Q1 2025 | Q1 2026 | Change |
|---|---|---|---|
| Revenue | 40.7 | 46.4 | +13.9% |
| EBITDA | 13.4 | 15.9 | +18.6% |
| Operating profit | 9.82 | 11.9 | +20.8% |
| Net profit | 7.01 | 8.83 | +26.0% |
| Operating cash flow | 12.4 | 13.2 | +6.3% |
| Capex | 5.57 | 6.71 | +20.5% |
| EBITDA margin | 33.0% | 34.3% | +1.3 pp |
| Net margin | 17.2% | 19.0% | +1.8 pp |
Q1 2026 revenue up 13.9% YoY to RUB 46.4 bn on tariff growth and higher electricity distribution
In Q1 2026, IDGC Center & Volga's revenue reached RUB 46,417.3 mn, up 13.9% year-on-year. Growth was driven by tariff indexation for electricity transmission and higher volumes of distributed electricity. This continues the trend: growth rates accelerated from +9.6% in Q4 2024 to +19.4% in Q4 2025, though the reported quarter saw a slight slowdown to +13.9%.
Quarterly dynamics show revenue remains at a high level: RUB 46.4 bn in Q1 2026 is the second-highest quarterly figure in the past two years, only slightly below Q4 2025's RUB 50.1 bn. Seasonality in the grid business is smoothing out, and the company is steadily increasing its top line.
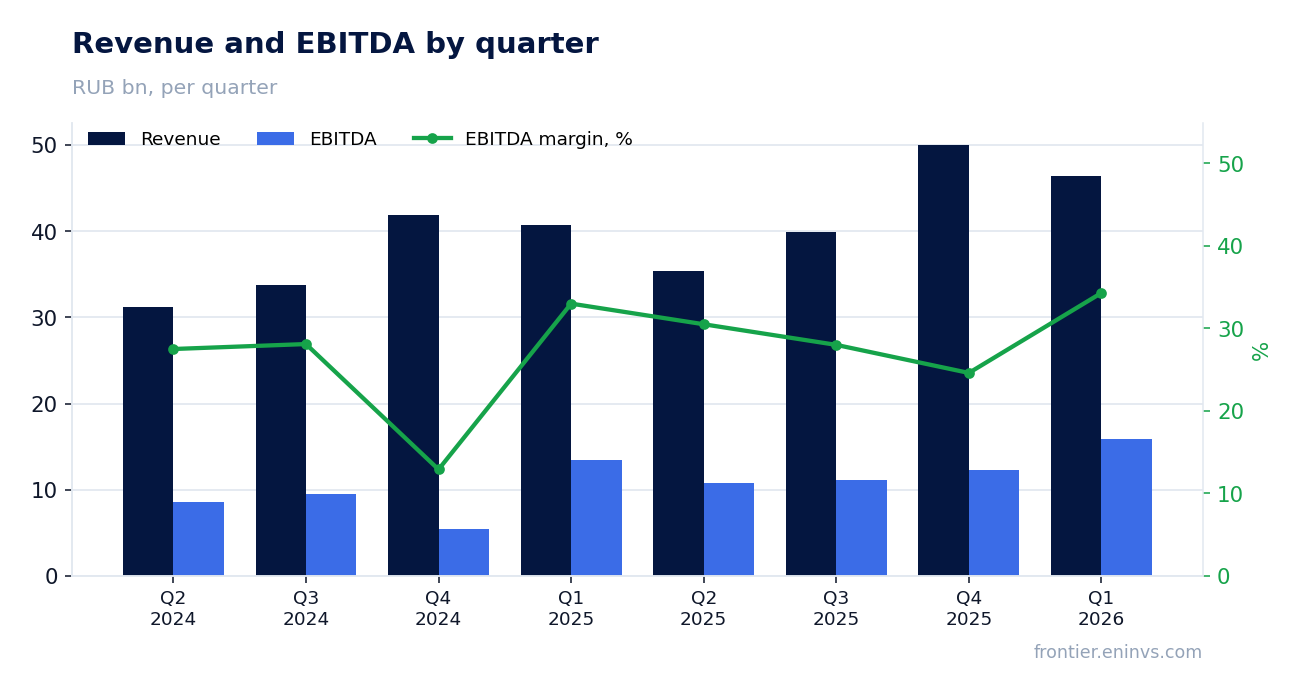
EBITDA margin reached 34.3% versus 33.0% a year earlier – operating efficiency keeps improving
EBITDA for Q1 2026 reached RUB 15,923.6 mn, up 18.6% year-on-year. EBITDA margin rose from 33.0% to 34.3% – the company keeps costs under control despite inflation and rising personnel and maintenance expenses.
The margin improvement is a result of operating leverage: revenue is growing faster than operating costs. This is confirmed by operating profit dynamics: RUB 11,862.0 mn for the quarter, corresponding to an operating margin of about 25.6%.
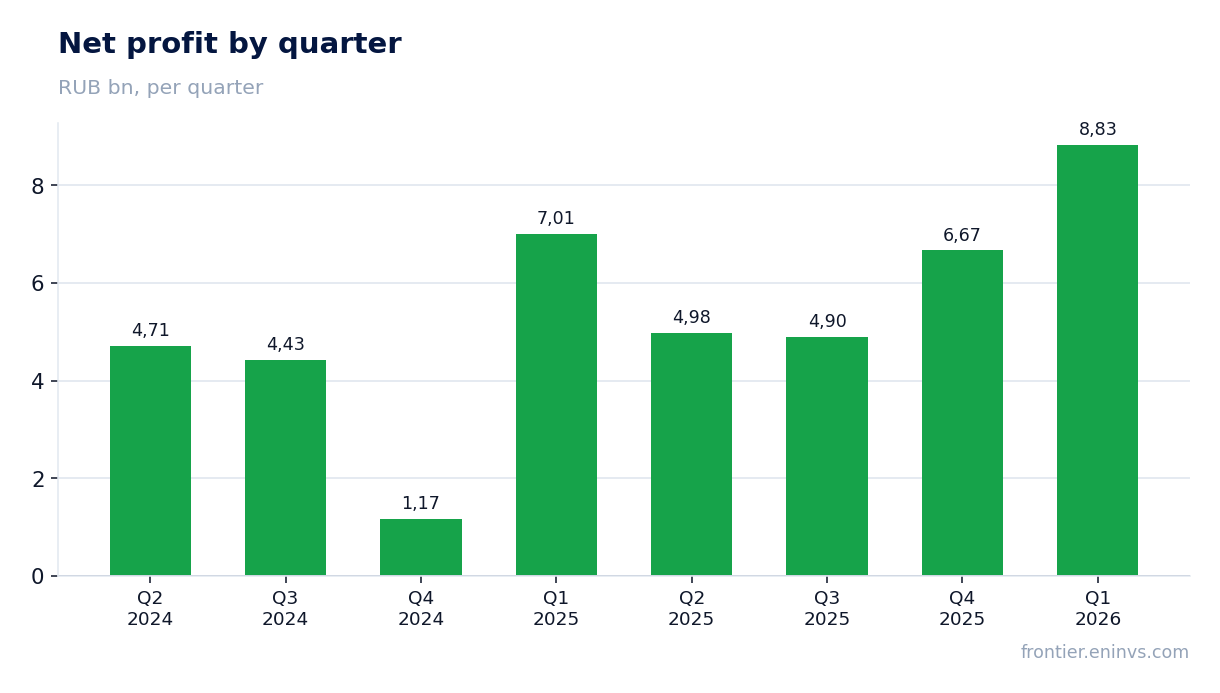
Net profit for the quarter rose 26.0% to RUB 8.8 bn, driven by operating leverage and cost control
Net profit for Q1 2026 reached RUB 8,833.0 mn, up 26.0% year-on-year. Profit growth outpaced revenue and EBITDA growth, indicating positive operating leverage and efficient interest expense management.
Net margin rose from 17.2% to 19.0% – one of the highest in the distribution grid sector. Quarterly profit is almost double the average quarterly level of 2024, when it was around RUB 4.5–5 bn.
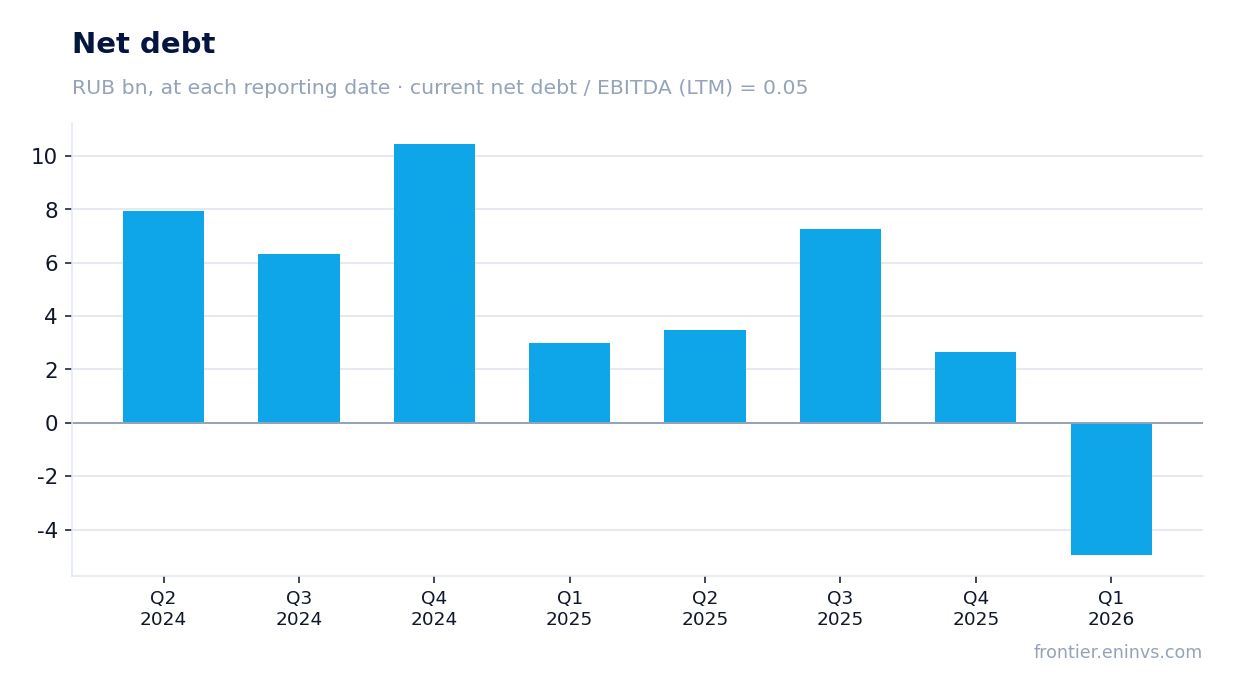
Net debt at end-March 2026 turned negative: RUB -4.96 bn – the company became a net lender for the first time
At end-Q1 2026, IDGC Center & Volga's net debt stood at RUB -4,962.8 mn, meaning cash and financial investments exceeded total debt. Net debt decreased by RUB 7.6 bn during the quarter and by RUB 7.9 bn over the last 12 months.
Net debt to EBITDA for the trailing twelve months is 0.05 – a level at which the company is virtually debt-free. Negative net debt provides financial flexibility: it can fund its investment program without borrowing and increase shareholder payouts.
Operating cash flow for the quarter was RUB 13.2 bn, covering capex of RUB 6.7 bn with a comfortable cushion
Operating cash flow for Q1 2026 reached RUB 13,195.6 mn – the best quarterly figure in the past two years. Capital expenditures amounted to RUB 6,707.2 mn, significantly below operating cash flow, resulting in positive free cash flow of about RUB 6.5 bn.
The strong operating cash flow is explained by profit growth and efficient working capital management. In previous quarters, operating cash flow was less stable: for example, in Q2 2025 it was only RUB 2,722.7 mn, due to seasonal factors. The current level allows the company to fund its investment program and dividends without increasing debt.
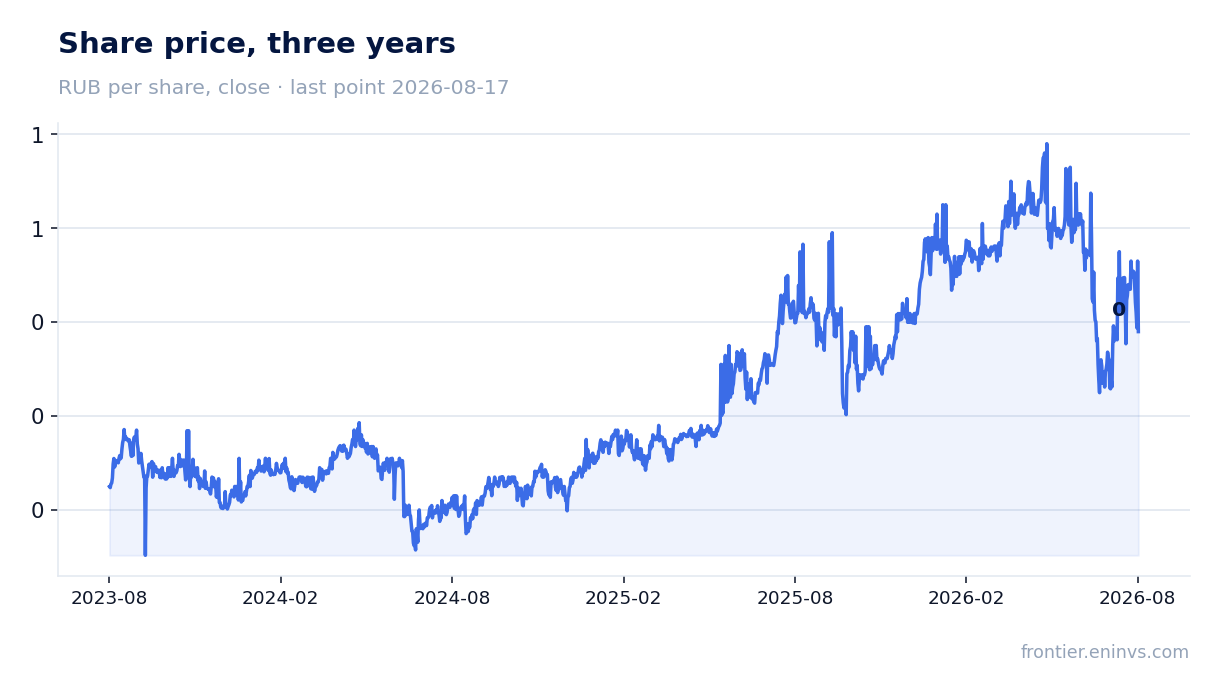
Trailing dividend yield is 15.1%, and our next payout estimate is RUB 0.08 per share, implying a forward yield of 16.6%
Over the last 12 months, the company paid dividends of RUB 0.0725 per share, providing a yield of 15.1% at the current price. Our model estimates the next payout at RUB 0.08 per share, implying a forward yield of 16.6%.
The payout ratio is estimated at 0.35 of net profit – the company distributes only a third of profit to shareholders, retaining significant room for investment. The fair yield for this issuer, in our view, is 10.5%, well below current and forward yields, indicating potential for share price appreciation.
Shares trade at P/E of 2.16 and EV/EBITDA of 0.99 – well below the 3-year average (1.46), reflecting market skepticism about sustainability
IDGC Center & Volga's market capitalization is RUB 54,748.6 mn, which, with trailing net profit of RUB 25,383.3 mn, gives a P/E of just 2.16. The EV/EBITDA multiple is 0.99 – less than half the three-year average (1.46).
Such a low valuation reflects investor skepticism about earnings quality and concerns that high results are not sustainable. However, negative net debt and stable operating cash flow suggest the company is in good financial shape. If results persist, the market may revise its assessment upward.
Valuation on the latest reported figures
| Metric | Value |
|---|---|
| Market cap | 54.7 bn ₽ |
| P/E (LTM) | 2.2 |
| EV/EBITDA (LTM) | 1.0 |
| P/B | 0.47 |
| Net debt / EBITDA (LTM) | 0.05 |
| Operating cash flow (LTM) | 37.2 bn |
| ROE | 29.0% |
| Dividend yield (12m) | 8.3% |
| EV/EBITDA, 3-year average | 1.5 |
Bottom line
The Q1 2026 report shows the company in excellent shape: revenue and profit are growing at double-digit rates, margins are improving, and net debt has turned negative, providing financial flexibility. Operating cash flow comfortably covers capex, and dividend yield remains double-digit. The key question for shareholders is the sustainability of these results: if tariff growth slows or one-off write-offs appear, the current low valuation may be justified. For now, the company looks undervalued relative to its own history and the sector.
Open the company's financial profile MRKP →
See also: market overview · valuation map · stock screeners