Rosseti Moscow Region: revenue accelerated to +21.9%, and free cash flow finally covered dividends
21 мая 2026 года «Россети Московский регион» раскрыли результаты за первый квартал 2026 года. Выручка выросла на 21,9% год к году, до 84,2 млрд руб., EBITDA – на 27,0%, до 29,2 млрд руб., чистая прибыль – на 34,1%, до 14,4 млрд руб. В обзоре разберём, что обеспечило ускорение, как изменилась долговая нагрузка и почему денежный поток впервые за четыре квартала покрыл дивидендные выплаты.
Key takeaways
— Revenue accelerated to +21.9% on higher tariffs and electricity transmission volumes
— EBITDA margin expanded to 34.7% as revenue outpaced costs
— Net profit rose 34.1% on operating leverage and a low base
— Operating cash flow reached RUB 35.1 bn, delivering positive free cash flow
— Net debt fell by RUB 7.3 bn in the quarter to RUB 57.5 bn
— Dividend yield of 12.0% exceeds the fair level, and the payout is covered by cash flow
— Valuation multiples remain below historical averages: EV/EBITDA of 1.4 vs 1.8 over three years
Key figures, RUB bn
| Metric | Q1 2025 | Q1 2026 | Change |
|---|---|---|---|
| Revenue | 69.0 | 84.2 | +21.9% |
| EBITDA | 23.0 | 29.2 | +27.0% |
| Operating profit | 16.2 | 21.4 | +31.6% |
| Net profit | 10.7 | 14.4 | +34.1% |
| Operating cash flow | 22.6 | 35.1 | +55.1% |
| Capex | 30.3 | 28.3 | -6.6% |
| EBITDA margin | 33.3% | 34.7% | +1.4 pp |
| Net margin | 15.6% | 17.1% | +1.5 pp |
Revenue accelerated to +21.9% on higher tariffs and electricity transmission volumes
In Q1 2026, Rosseti Moscow Region's revenue reached RUB 84.2 bn, up 21.9% year-on-year. This is a marked acceleration: in the previous four quarters, growth ranged from 7% to 20.1%. The main driver was electricity transmission, which brought in RUB 78.6 bn versus RUB 62.8 bn a year earlier.
Growth was supported by both higher tariffs and higher transmission volumes. The transmission segment reported revenue of RUB 78.6 bn, up 25% from last year. Grid connection services, by contrast, fell 12.5% to RUB 4.3 bn, but their share in revenue is small.
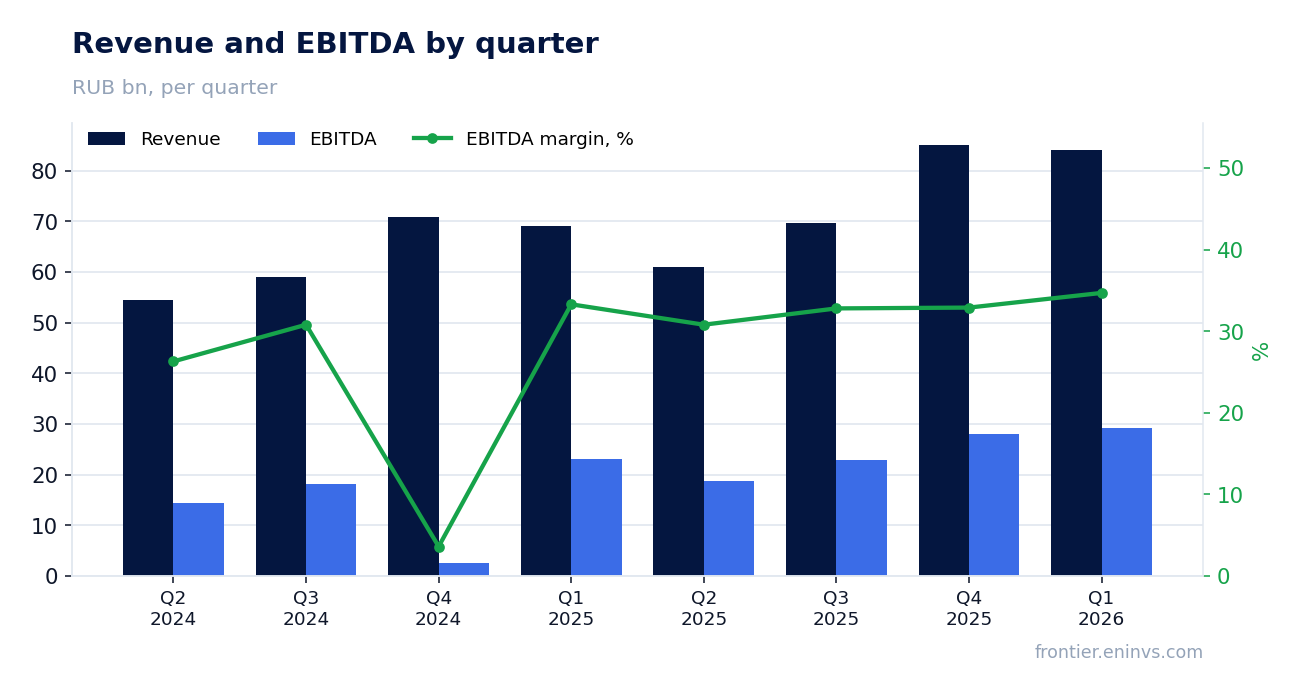
EBITDA margin expanded to 34.7% as revenue outpaced costs
EBITDA for Q1 2026 rose 27.0% year-on-year to RUB 29.2 bn, and the EBITDA margin expanded from 33.3% to 34.7%. Revenue growth outpaced operating costs: cost of sales rose 15.8% while revenue grew 21.9%.
Key cost items – purchased electricity to compensate losses and transmission services – rose 21.6% and 15.6% respectively, but their share in revenue declined. Staff costs increased 25.4% to RUB 10.7 bn, below the revenue growth rate.
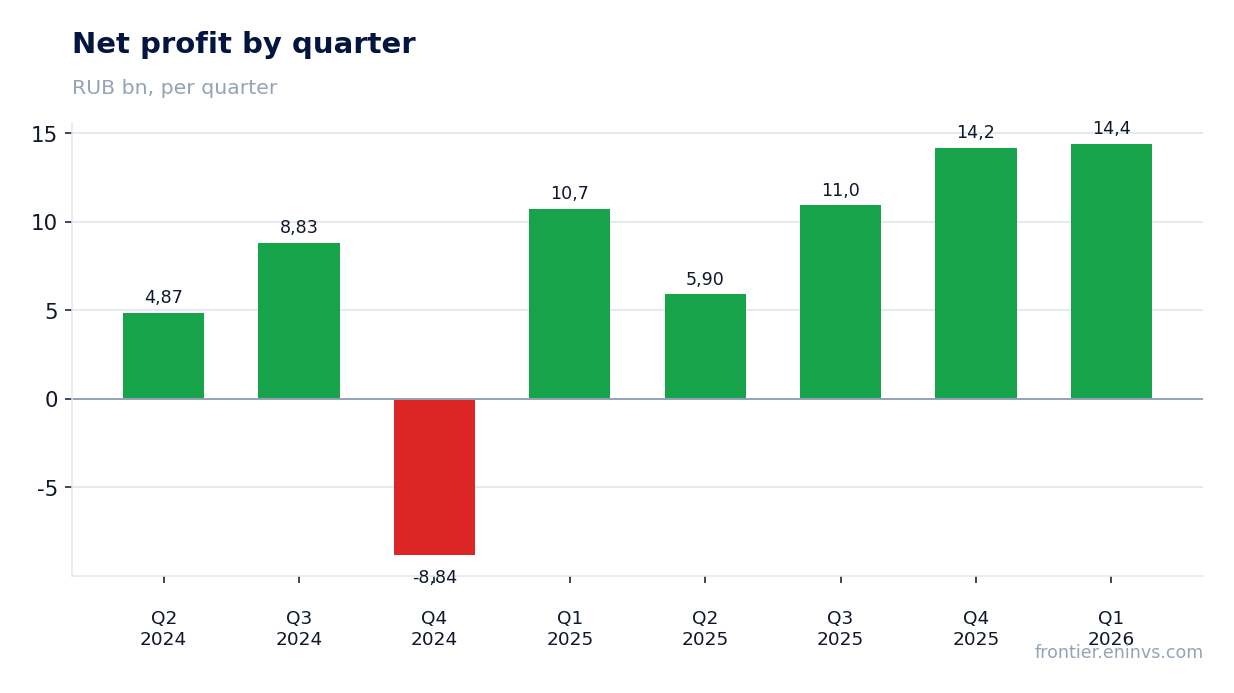
Net profit rose 34.1% on operating leverage and a low base
Net profit for Q1 2026 reached RUB 14.4 bn, up 34.1% year-on-year. Growth was driven by operating leverage: operating profit rose 31.6% to RUB 21.4 bn, while finance costs fell 2.9% to RUB 2.7 bn.
The effective tax rate was 25.4% versus 23.9% a year earlier, partially offsetting the rise in pre-tax profit. Still, net margin increased from 15.6% to 17.1%.
Operating cash flow reached RUB 35.1 bn, delivering positive free cash flow
Operating cash flow for Q1 2026 reached RUB 35.1 bn versus RUB 22.6 bn a year earlier. The 55.1% increase was driven by higher profit and improved working capital: the company received RUB 5.4 bn in long-term advances and RUB 5.1 bn in tax liabilities.
Capital expenditures amounted to RUB 28.3 bn, down 6.6% from last year. As a result, free cash flow turned positive at RUB 6.8 bn, the first time in four quarters. This is important for dividend sustainability.
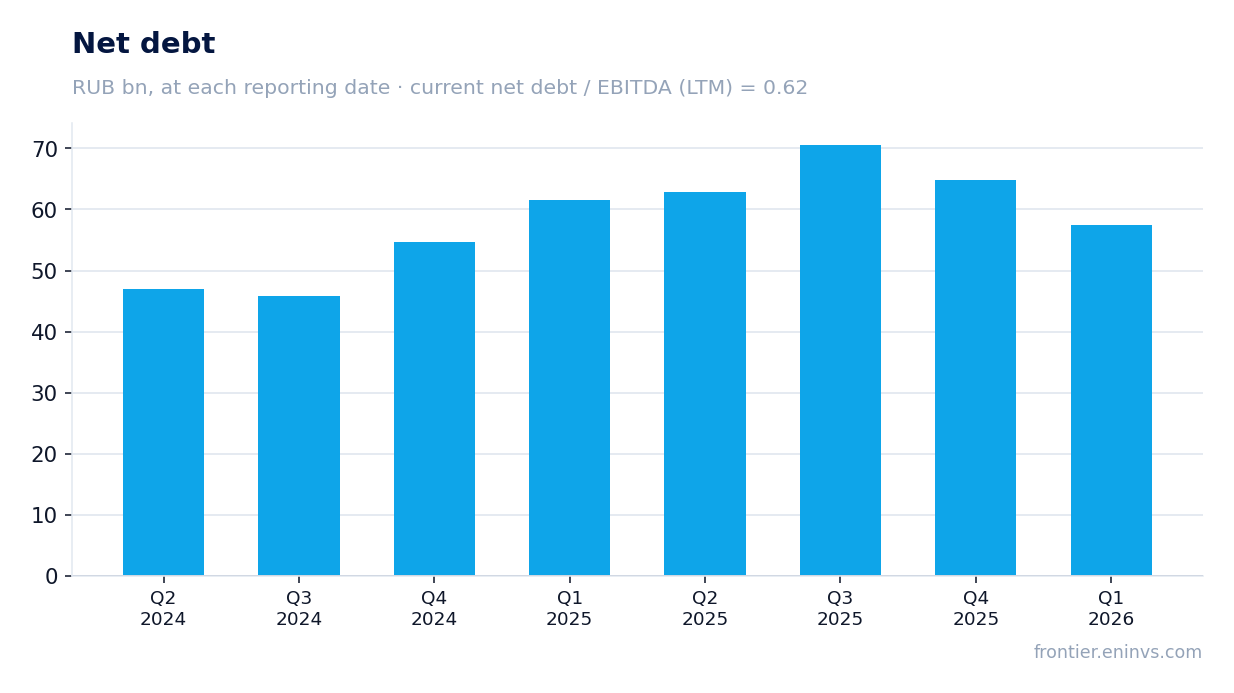
Net debt fell by RUB 7.3 bn in the quarter to RUB 57.5 bn
At the end of March 2026, net debt stood at RUB 57.5 bn, down RUB 7.3 bn from the start of the year. Over the past 12 months, the decline was RUB 4.2 bn. The company actively repaid short-term loans: it raised and repaid RUB 50.9 bn each, indicating refinancing.
Net debt to EBITDA for the trailing twelve months is 0.62x. This is a moderate level, comparable to previous periods. The debt burden remains comfortable for continuing the investment program.
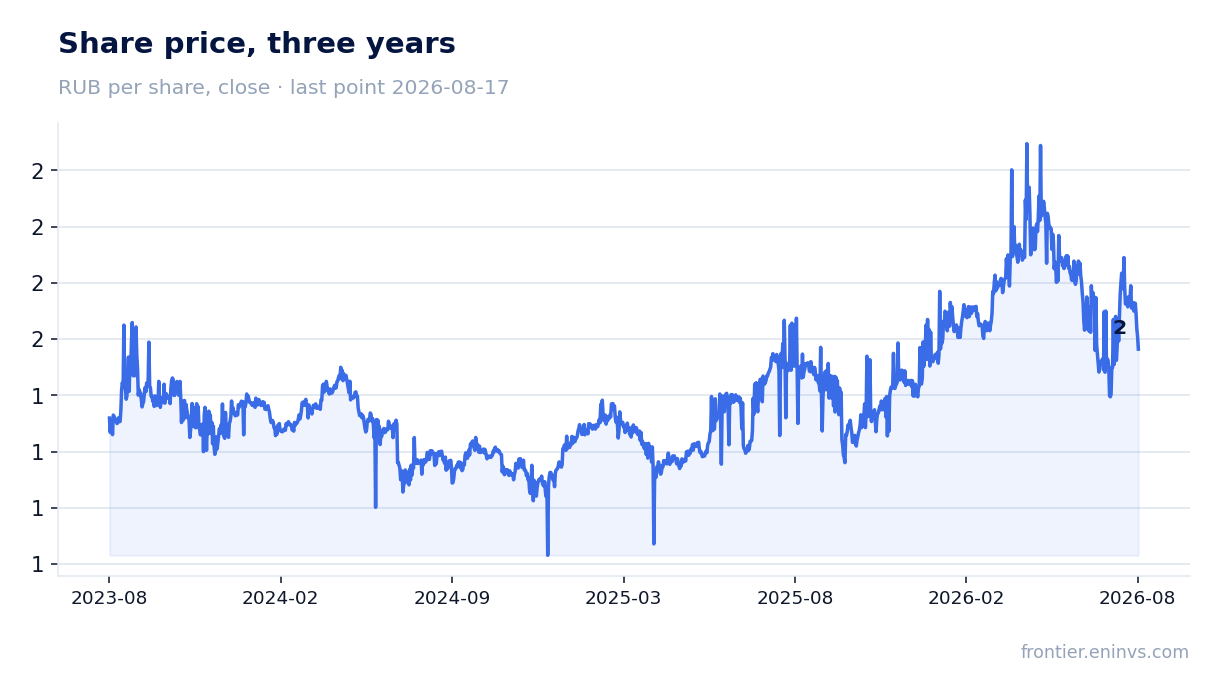
Dividend yield of 12.0% exceeds the fair level, and the payout is covered by cash flow
Over the last 12 months, the company paid dividends of RUB 0.1865 per share, providing a yield of 12.0%. Our model estimates the next payout at RUB 0.19 per share, also giving 12.0% at the current price. The fair yield for this issuer is 10.5%, meaning the stock trades at a yield premium.
The payout ratio is 0.4 of profit, which is conservative. Positive free cash flow in Q1 – RUB 6.8 bn – covers quarterly dividend payments (approximately RUB 5.7 bn at an annual dividend of RUB 0.19 per share). This reduces the risk of payout cuts.
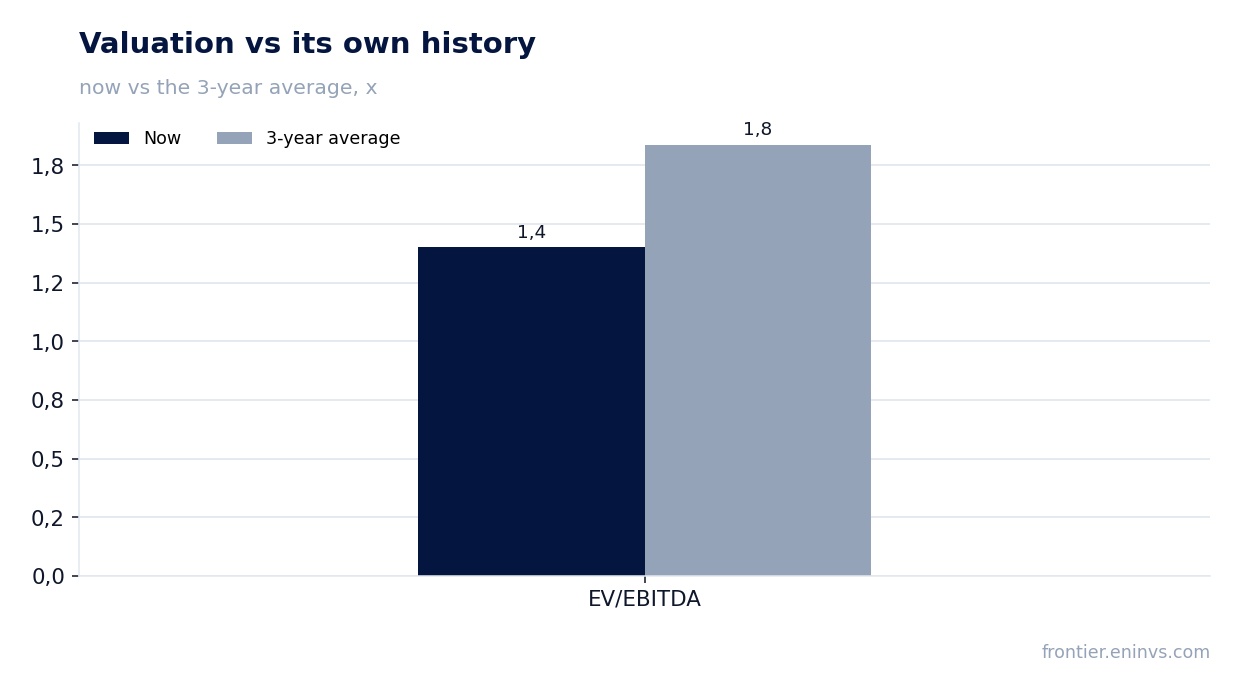
Valuation multiples remain below historical averages: EV/EBITDA of 1.4 vs 1.8 over three years
For the trailing twelve months, EV/EBITDA is 1.40x versus the three-year average of 1.84x. P/E is 1.78x, also extremely low. Market capitalization is RUB 81.1 bn, less than the annual net profit of RUB 45.4 bn.
The stock trades at a discount to its own history: EV/EBITDA is 24% below the three-year average. This reflects both general pessimism toward the sector and concerns about tariff regulation. However, with a current yield of 12% and growing revenue, the valuation looks attractive.
Valuation on the latest reported figures
| Metric | Value |
|---|---|
| Market cap | 81.1 bn ₽ |
| P/E (LTM) | 1.8 |
| EV/EBITDA (LTM) | 1.4 |
| P/B | 0.32 |
| Net debt / EBITDA (LTM) | 0.62 |
| Operating cash flow (LTM) | 98.1 bn |
| ROE | 21.8% |
| Dividend yield (12m) | 8.4% |
| EV/EBITDA, 3-year average | 1.8 |
Bottom line
Q1 2026 was strong for Rosseti Moscow Region: revenue accelerated to +21.9%, EBITDA margin expanded, and net profit rose by a third. The key improvement was operating cash flow, which grew to RUB 35.1 bn, delivering positive free cash flow for the first time in a year and covering dividends. Net debt fell to RUB 57.5 bn, and the ratio to EBITDA is 0.62x, leaving room for investment. The dividend yield of 12% is above fair, and the payout looks covered. The main question for holders is whether revenue acceleration will persist in H2 when the comparison base becomes higher, and whether capex will increase in the second half of the year.
Open the company's financial profile MSRS →
See also: market overview · valuation map · stock screeners