APPLIED OPTOELECTRONICS, INC.: revenue up 86.4%, but profit consumed by capacity expansion costs
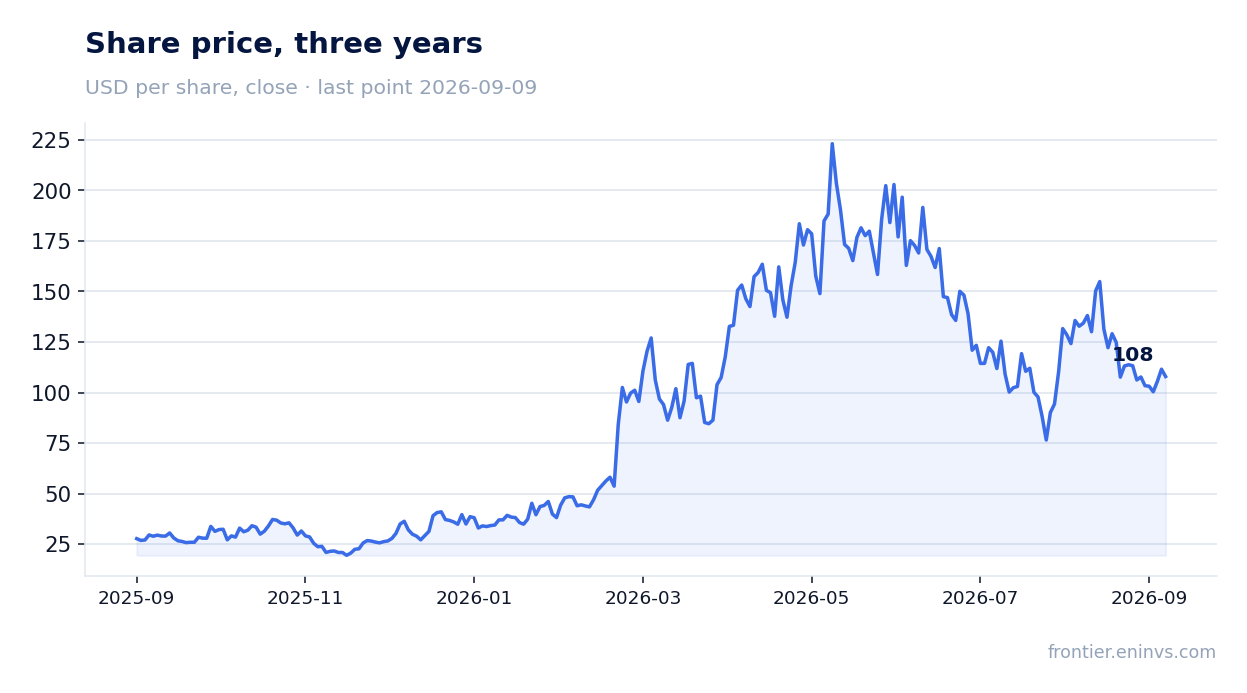
On August 6, APPLIED OPTOELECTRONICS, INC. reported second-quarter 2026 results. Revenue reached $191.9 million, up 86.4% year-on-year and 27% quarter-on-quarter. The company posted near-breakeven adjusted EBITDA (–$0.5 million vs. –$9.6 million a year earlier), but the net loss widened to $22.8 million due to a sharp increase in operating expenses and capital expenditures. The shares fell 3.4% the day after the release and are down 16% since. At the current price the stock looks unattractive: the portal's model values it 56% below the market, and leverage keeps rising.
Key takeaways
— Revenue grew 86.4% year-on-year to $191.9 million, but growth decelerated from 137.9% in Q2 2025
— Gross margin fell to 27.7% from 30.3% a year earlier due to rising production expansion costs
— Operating expenses jumped 65% to $77.9 million, resulting in an operating loss of $24.7 million
— Adjusted EBITDA improved to –$0.5 million but remains negative
— Capital expenditures hit a record $285.6 million, while operating cash flow turned positive for the first time in a year at $11.6 million
— Net debt rose to $371.7 million, while cash on the balance sheet increased to $508.8 million
— The portal's model values the stock 56% below the current market price
Attractiveness
Key figures, USD bn
| Metric | Q2 2025 | Q2 2026 | Change |
|---|---|---|---|
| Revenue | 0.10 | 0.19 | +86.4% |
| EBITDA | -0.01 | -0.00 | — |
| Operating profit | -0.02 | -0.02 | — |
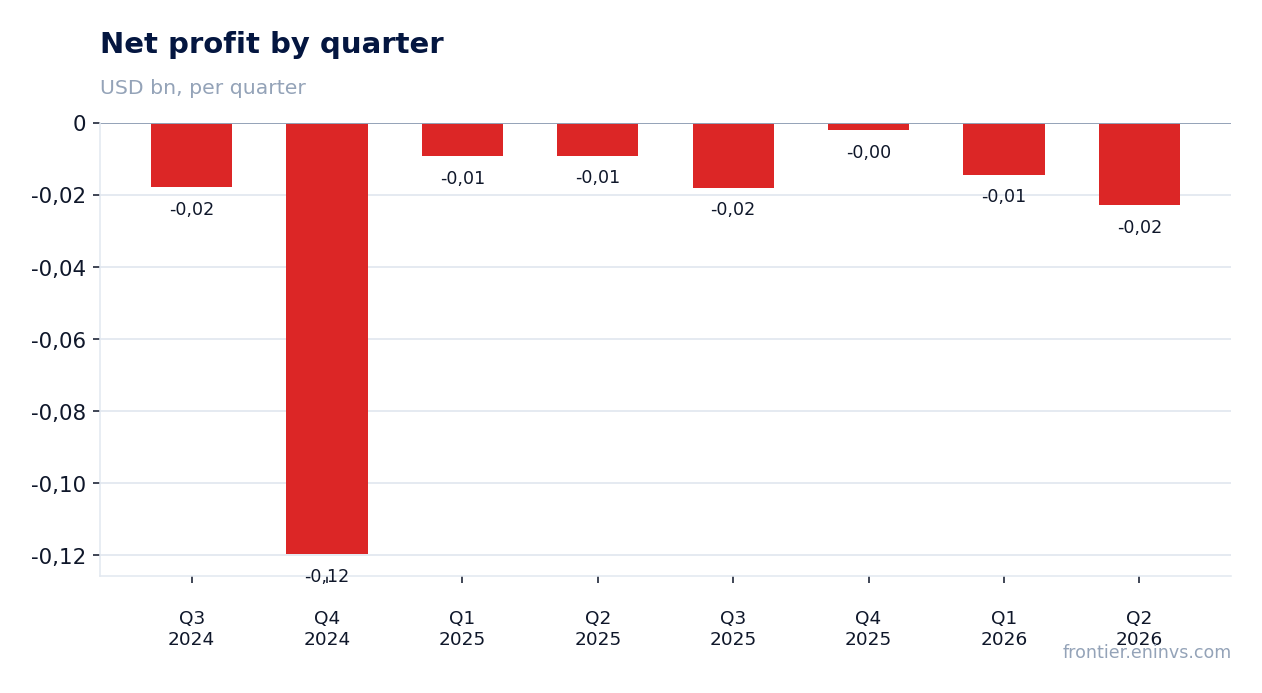
| Net profit | -0.01 | -0.02 | — |
| Operating cash flow | -0.07 | 0.01 | to profit |
| Capex | 0.03 | 0.29 | +1020.9% |
| EBITDA margin | -9.3% | -0.3% | +9.0 pp |
| Net margin | -8.8% | -11.9% | -3.1 pp |
Revenue grew 86.4% year-on-year to $191.9 million, but growth decelerated from 137.9% in Q2 2025
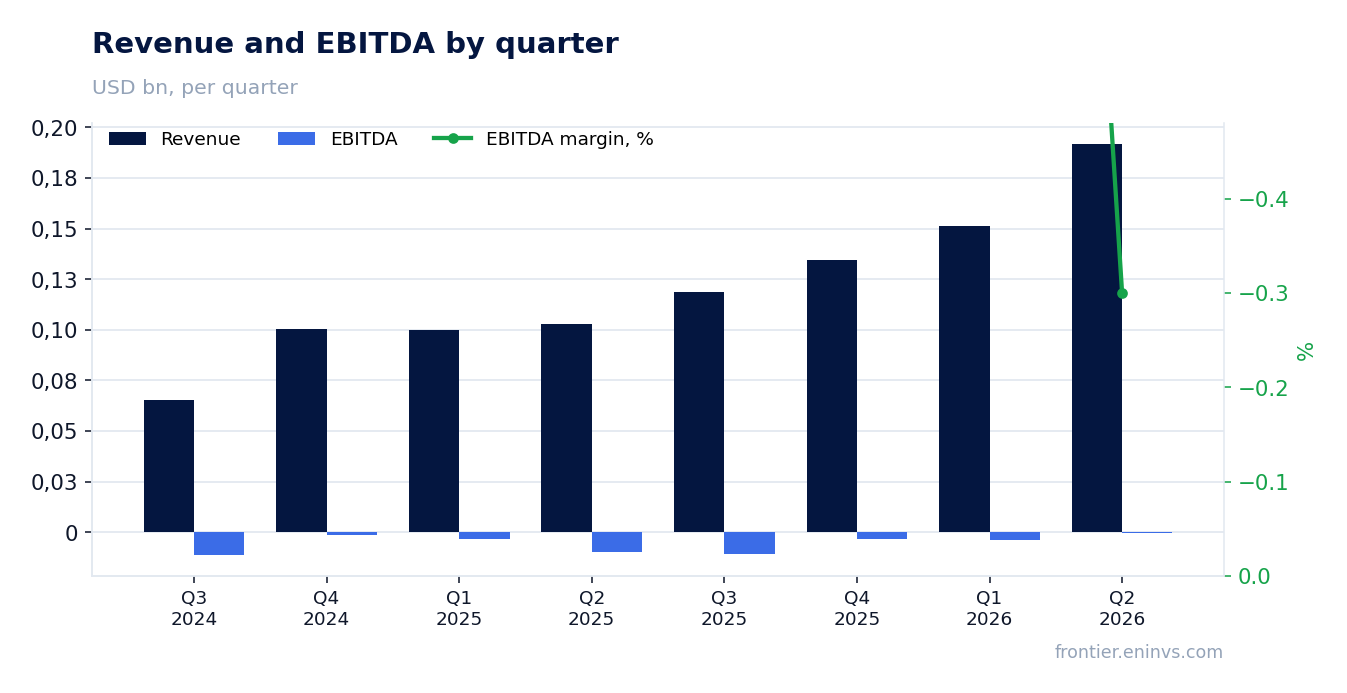
Second-quarter 2026 revenue reached $191.9 million, up 86.4% from Q2 2025. This is a record for the fifth consecutive quarter. However, growth decelerated: a year earlier revenue rose 137.9%, and in Q1 2026 it grew 51.4%.
The datacenter segment was the main driver, with revenue jumping to $107.7 million from $44.8 million a year earlier. Sales of 800G products more than doubled sequentially. The CATV segment also grew to $80.6 million from $56.0 million a year earlier on strong demand for 1.8 GHz products.
The company notes that demand continues to outpace production capacity and expects to be able to produce around 650,000 units of 800G and 1.6Tb products per month by year-end. This creates prerequisites for further revenue growth but requires significant investment.
Gross margin fell to 27.7% from 30.3% a year earlier due to rising production expansion costs
GAAP gross margin in Q2 2026 was 27.7%, down from 30.3% a year earlier and 29.1% in Q1 2026. Non-GAAP gross margin also declined to 29.8% from 30.4% a year earlier.
The margin decline is due to increased production expansion costs, including expenses for launching new lines and higher depreciation. Cost of goods sold rose to $138.7 million from $71.8 million a year earlier, growing faster than revenue.
The company expects non-GAAP gross margin in Q3 2026 to be 29–30.5%, implying some recovery but still below early 2025 levels.
Operating expenses jumped 65% to $77.9 million, resulting in an operating loss of $24.7 million
Operating expenses in Q2 2026 were $77.9 million, up 65% from $47.1 million a year earlier. The largest increases were in research and development – to $34.9 million from $20.6 million – and general and administrative expenses – to $31.6 million from $18.4 million.
As a result, the operating loss reached $24.7 million versus $16.0 million a year earlier. This occurred despite gross profit rising to $53.2 million from $31.2 million, as operating expenses grew faster.
The expense growth is linked to headcount expansion and investments in new product development, which are necessary to maintain technological leadership but weigh on current profitability.
Adjusted EBITDA improved to –$0.5 million but remains negative
Adjusted EBITDA in Q2 2026 was –$0.5 million, a significant improvement from –$9.6 million a year earlier and –$3.8 million in Q1 2026. The company came close to breakeven at this level for the first time in several quarters.
The improvement is due to higher revenue and gross profit, as well as a positive effect from foreign exchange differences. However, EBITDA remains negative, indicating persistent operational efficiency challenges.
To achieve sustainable profitability, the company needs not only to grow revenue but also to control operating expenses, which are growing faster.
Capital expenditures hit a record $285.6 million, while operating cash flow turned positive for the first time in a year at $11.6 million
Capital expenditures in Q2 2026 were $285.6 million, significantly higher than $25.5 million a year earlier and $58.2 million in Q1. This is a record level, associated with expanding production capacity for 800G and 1.6Tb products.
Operating cash flow turned positive for the first time since 2025, reaching $11.6 million versus an outflow of $65.5 million a year earlier. This was due to higher revenue and improved working capital management.
However, such high capital expenditures led to a significant overall cash outflow. The company is financing expansion through debt and equity issuance, which increases financial risks.
Net debt rose to $371.7 million, while cash on the balance sheet increased to $508.8 million
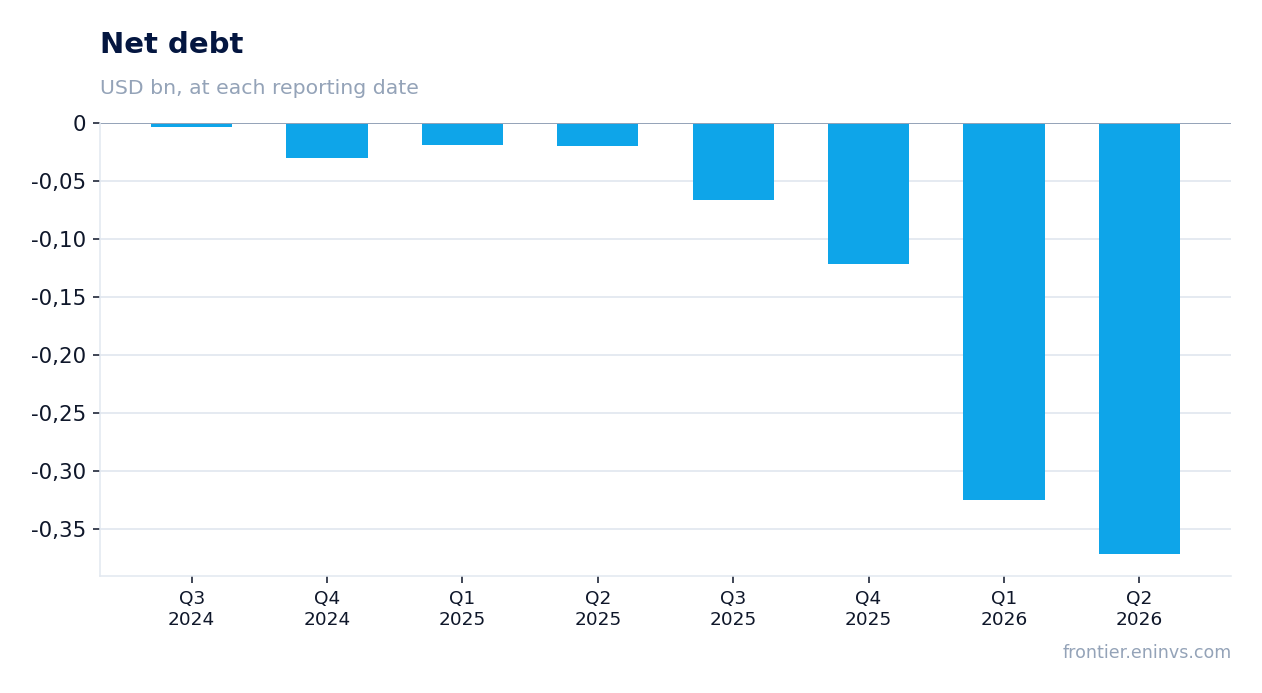
Net debt at the end of Q2 2026 was $371.7 million, up from $324.6 million at the end of Q1 and $121.3 million at the end of 2025. The increase is due to the need to finance capital expenditures.
At the same time, cash and equivalents rose to $508.8 million from $216.0 million at the end of 2025. The company raised significant capital, which provides liquidity but increases debt burden.
The debt burden remains moderate relative to revenue, but negative EBITDA and high capital expenditures may require additional financing.
The portal's model values the stock 56% below the current market price
According to the portal's model, the fair value of APPLIED OPTOELECTRONICS, INC. shares is 56% below the current market price. This means the market values the company significantly above its fundamental value calculated on the basis of EBITDA growth and a target multiple.
The company's market capitalisation is $9.1 billion, which at trailing twelve-month revenue of $596.0 million gives a high multiple. Operating cash flow over the last twelve months is negative at –$174.4 million, which does not support the current valuation.
The shares fell 3.4% on the day the report was published and are down 16% since the release, reflecting investor disappointment with the pace of financial improvement.
Valuation on the latest reported figures
| Metric | Value |
|---|---|
| Market cap | 9.11 bn USD |
| P/B | 12.41 |
| Operating cash flow (LTM) | -0.17 bn |
| ROE | -6.6% |
Bottom line
In Q2 2026, APPLIED OPTOELECTRONICS, INC. reported record revenue and came close to breakeven on adjusted EBITDA, but the net loss widened due to a sharp increase in operating expenses and capital expenditures. The company is actively investing in capacity expansion, which creates a foundation for future growth but requires significant financial resources and increases debt burden. The portal's model indicates the shares are 56% overvalued, and a market capitalisation of $9.1 billion against trailing twelve-month revenue of $596.0 million looks inflated. A change in verdict would require sustainable margin growth and positive free cash flow.
Open the company's financial profile AAOI →
See also: market overview · valuation map · stock screeners