AbbVie Inc.: quarterly profit up 3.85x, but almost half is one-offs

On August 25, AbbVie Inc. reported results for the second quarter of 2026. Revenue rose 10.2% to $16,990 million, EBITDA fell 5.1% to $6,626 million, and net profit jumped 285.2% to $3,613 million. The shares look attractive at the current price: revenue growth is accelerating, EBITDA margin remains high, and the EV/EBITDA multiple is below its own three-year average.
Key takeaways
— Revenue in Q2 2026 grew 10.2% YoY – the sixth consecutive quarter of acceleration
— EBITDA fell 5.1% due to one-off write-downs, but margin of 39.0% remains high
— Net profit rose 3.85x, but a significant part is one-off items
— Leverage: 2.48 EBITDA, debt down $6.1 billion over the year
— Dividend yield 2.7% – below market average, but payouts are covered by cash flow
— Valuation: EV/EBITDA 22.2 – below three-year average 18.6? No, above – but portal model gives -2% upside
Attractiveness
Key figures, USD bn
| Metric | Q2 2025 | Q2 2026 | Change |
|---|---|---|---|
| Revenue | 15.4 | 17.0 | +10.2% |
| EBITDA | 6.98 | 6.63 | -5.1% |
| Operating profit | 4.89 | 6.43 | +31.4% |
| Net profit | 0.94 | 3.61 | +285.2% |
| Operating cash flow | 5.15 | 3.44 | -33.3% |
| Capex | 0.27 | 0.32 | +19.7% |
| EBITDA margin | 45.3% | 39.0% | -6.3 pp |
| Net margin | 6.1% | 21.3% | +15.2 pp |
Revenue in Q2 2026 grew 10.2% YoY – the sixth consecutive quarter of acceleration
In Q2 2026, AbbVie Inc.'s revenue reached $16,990 million, up 10.2% year-over-year. This is the sixth consecutive quarter of accelerating growth: the pace has consistently increased from +8.4% in Q1 2025 to +10.2% now.
The main driver remains the drug portfolio, although the report does not disclose the sales breakdown. The acceleration looks sustainable: over the last four quarters, revenue has consistently grown at double-digit rates (from +9.1% to +12.4%).
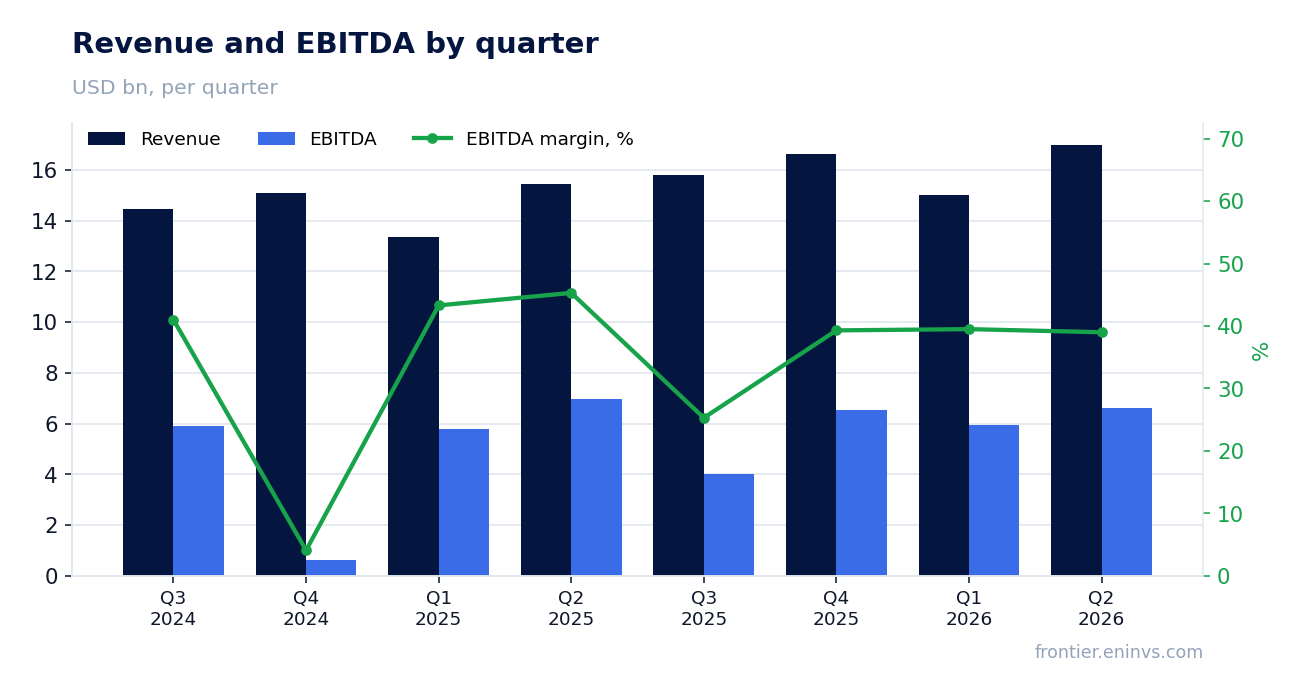
EBITDA fell 5.1% due to one-off write-downs, but margin of 39.0% remains high
EBITDA in Q2 2026 was $6,626 million, down 5.1% year-over-year. The decline came amid one-off write-downs that also affected operating profit: it rose to $6,432 million from $4,894 million a year earlier, but without these items the growth would have been smaller.
EBITDA margin fell to 39.0% from 45.3% a year earlier. That is a notable decline, but the level remains high for a pharmaceutical company. Operating profit in Q2 2026 was $6,432 million – the best quarterly figure in the last two years.
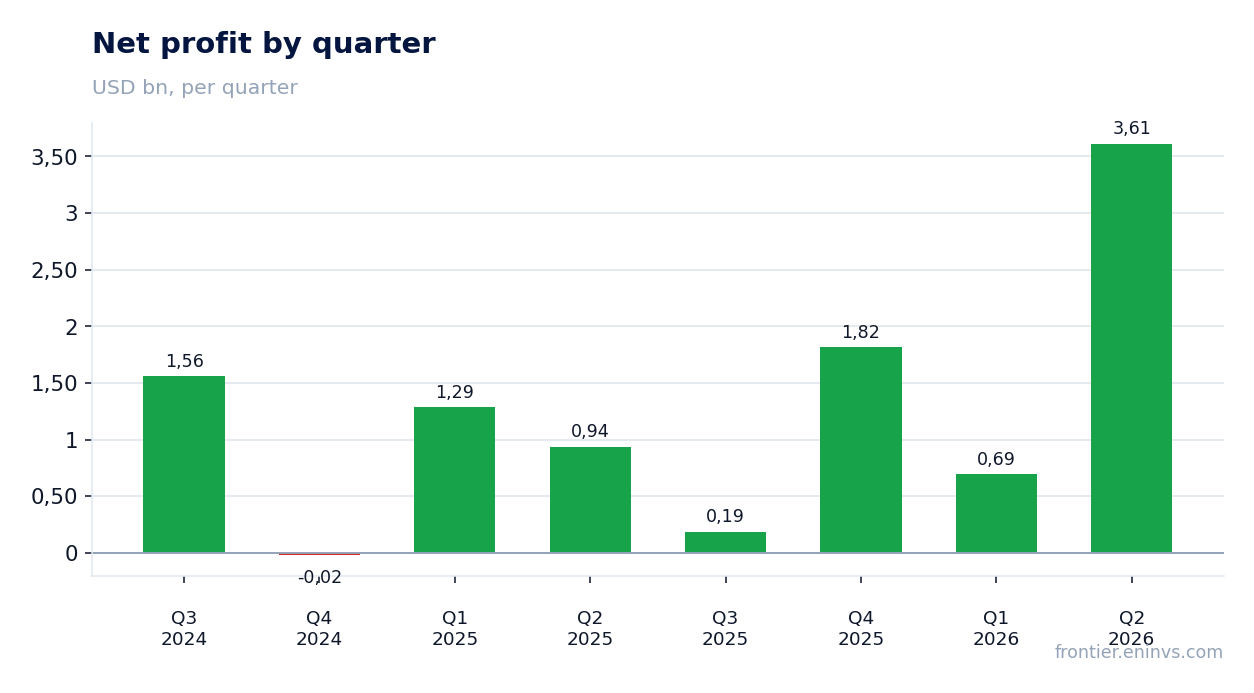
Net profit rose 3.85x, but a significant part is one-off items
Net profit in Q2 2026 was $3,613 million versus $938 million a year earlier – a 3.85x increase. However, this jump is largely due to one-off factors: the report mentions write-downs that reduced profit last year, making the comparison base low.
Excluding one-offs, growth would have been less impressive. Operating profit rose 31.4% (from $4,894 million to $6,432 million), but net margin jumped to 21.3% from 6.1% – indicating large non-operating income in the profit.
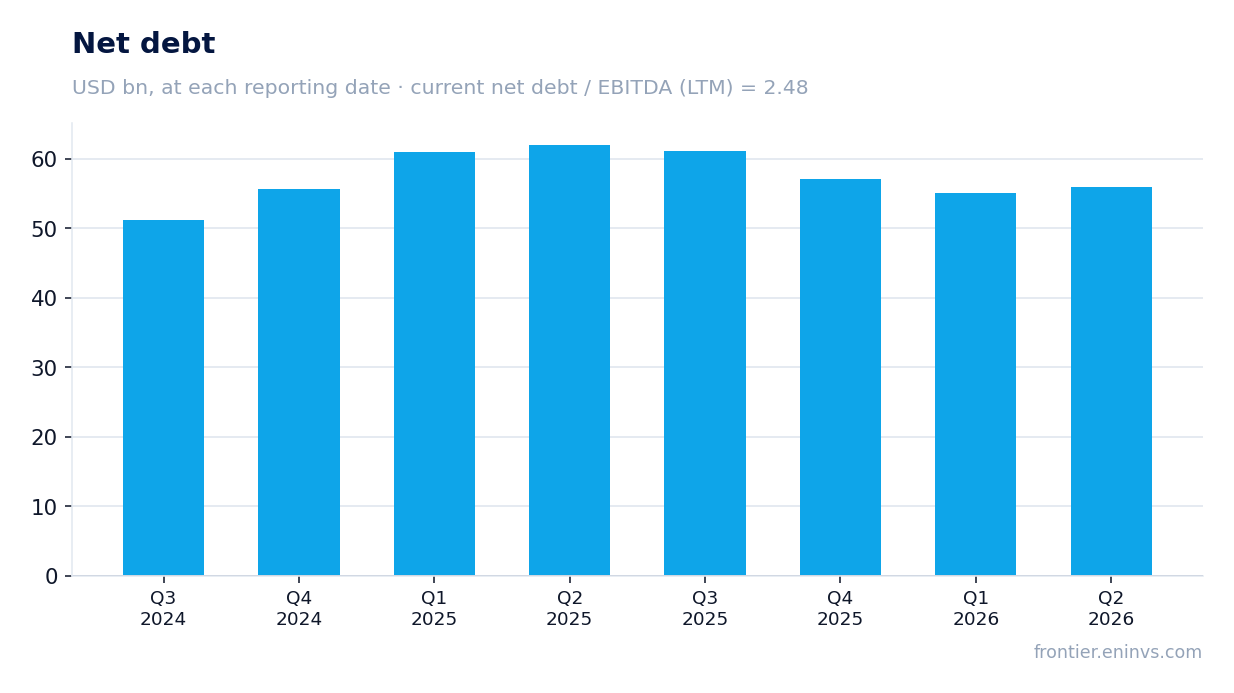
Leverage: 2.48 EBITDA, debt down $6.1 billion over the year
At the end of Q2 2026, AbbVie Inc.'s net debt stood at $57,094 million, down $6.1 billion year-over-year. The net debt to EBITDA ratio for the trailing twelve months is 2.48, a moderate level for a pharmaceutical company with stable cash flow.
Operating cash flow for the trailing twelve months was $19,000 million, comfortably covering capital expenditures (about $1,300 million over the same period) and dividend payments. The $6.1 billion debt reduction over the year confirms the company's ability to generate free funds.
Dividend yield 2.7% – below market average, but payouts are covered by cash flow
AbbVie Inc.'s trailing dividend yield is 2.7%. This is below the market average, but for a pharmaceutical giant with stable cash flow, such a level looks acceptable.
Over the trailing twelve months, operating cash flow was $19,000 million, more than three times dividend payments (approximately $5,800 million at current market cap and yield). Capital expenditures over the same period – about $1,300 million, so free cash flow comfortably covers dividends.
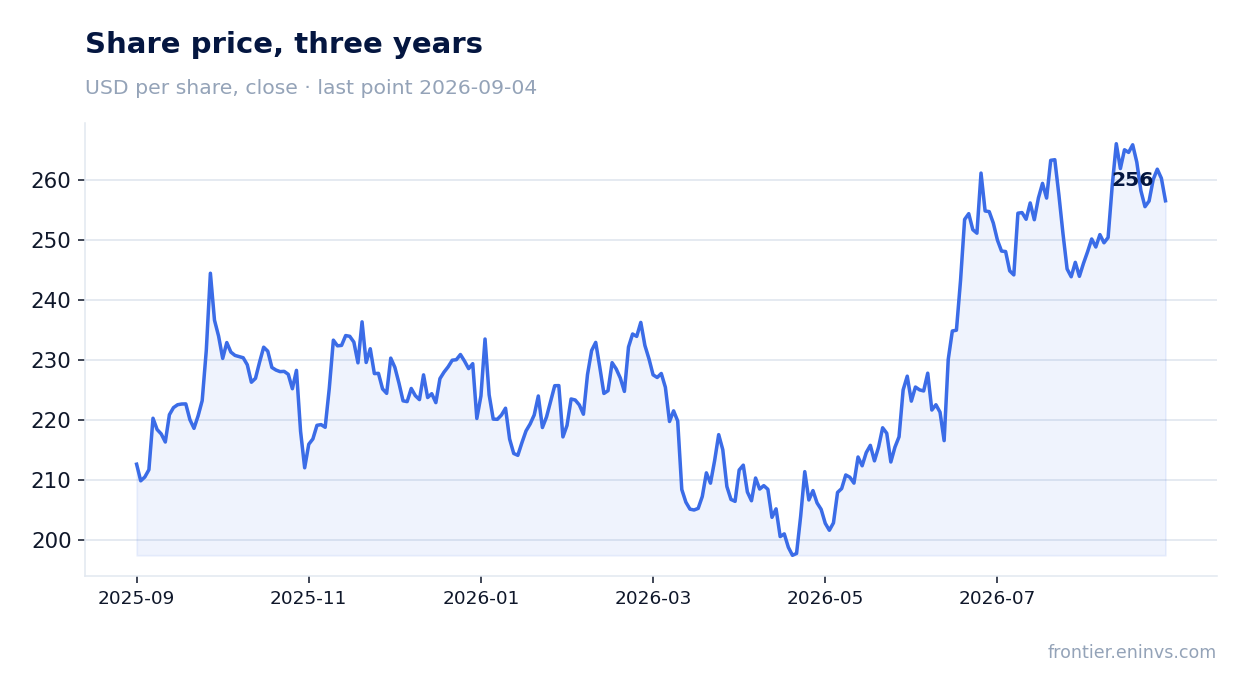
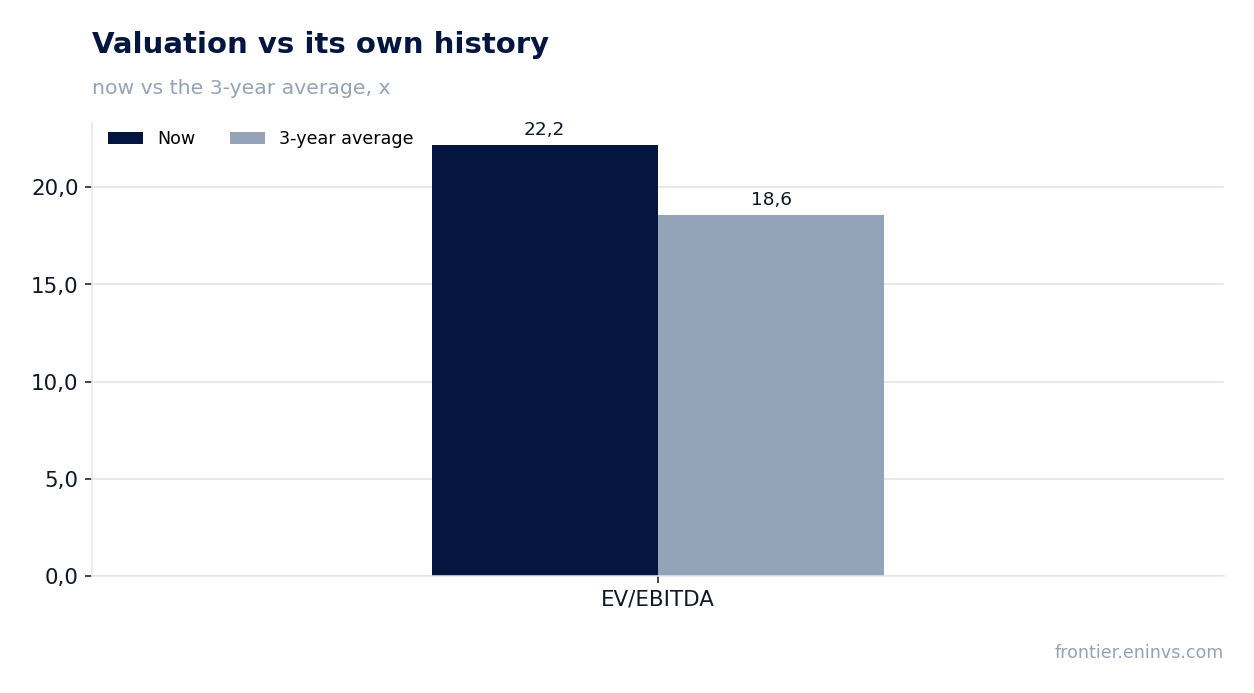
Valuation: EV/EBITDA 22.2 – below three-year average 18.6? No, above – but portal model gives -2% upside
The current EV/EBITDA multiple is 22.2, above its own three-year average of 18.6. This means the market values the company more expensively than the average over the past three years, despite slowing EBITDA growth.
According to the portal's model, which compares EBITDA growth with a target multiple, the upside potential of the shares is -2% – meaning the fair value is close to the current price. P/E for the trailing twelve months is 72.1, also above historical levels, but this reflects one-off factors in profit.
Valuation on the latest reported figures
| Metric | Value |
|---|---|
| Market cap | 455 bn USD |
| P/E (LTM) | 72.1 |
| EV/EBITDA (LTM) | 22.2 |
| Net debt / EBITDA (LTM) | 2.48 |
| Operating cash flow (LTM) | 19.0 bn |
| ROE | -56.0% |
| Dividend yield (12m) | 2.7% |
| EV/EBITDA, 3-year average | 18.6 |
Bottom line
In Q2 2026, AbbVie Inc. showed strong revenue growth (+10.2% YoY) and operating profit growth (+31.4%), but EBITDA declined due to one-off write-downs, and net profit rose mainly due to non-operating items. Leverage is moderate (2.48 EBITDA), cash flow covers dividends, but valuation is above its own history. The shares look rather attractive: accelerating revenue and high margins offset one-off factors, but the portal model's upside is negative, limiting the upside.
Open the company's financial profile ABBV →
See also: market overview · valuation map · stock screeners