ANALOG DEVICES INC: revenue accelerated to +39.6%, yet shares trade 19% below the portal's model fair value
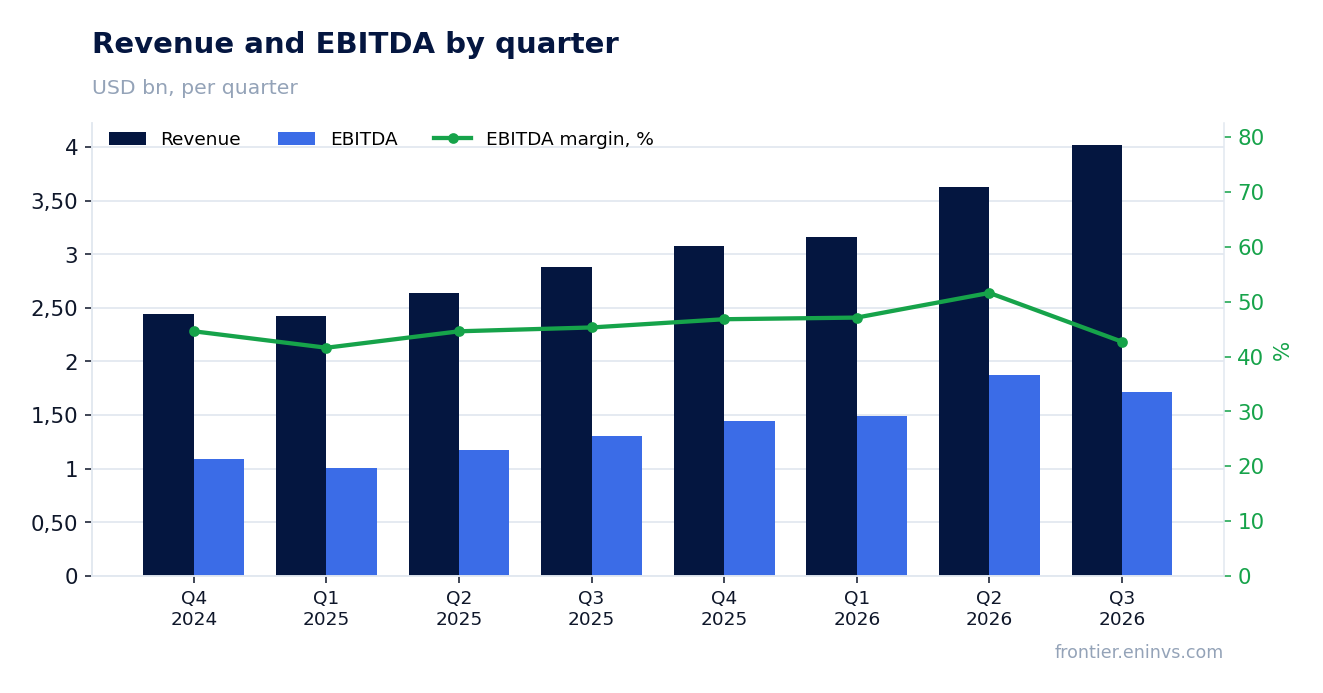
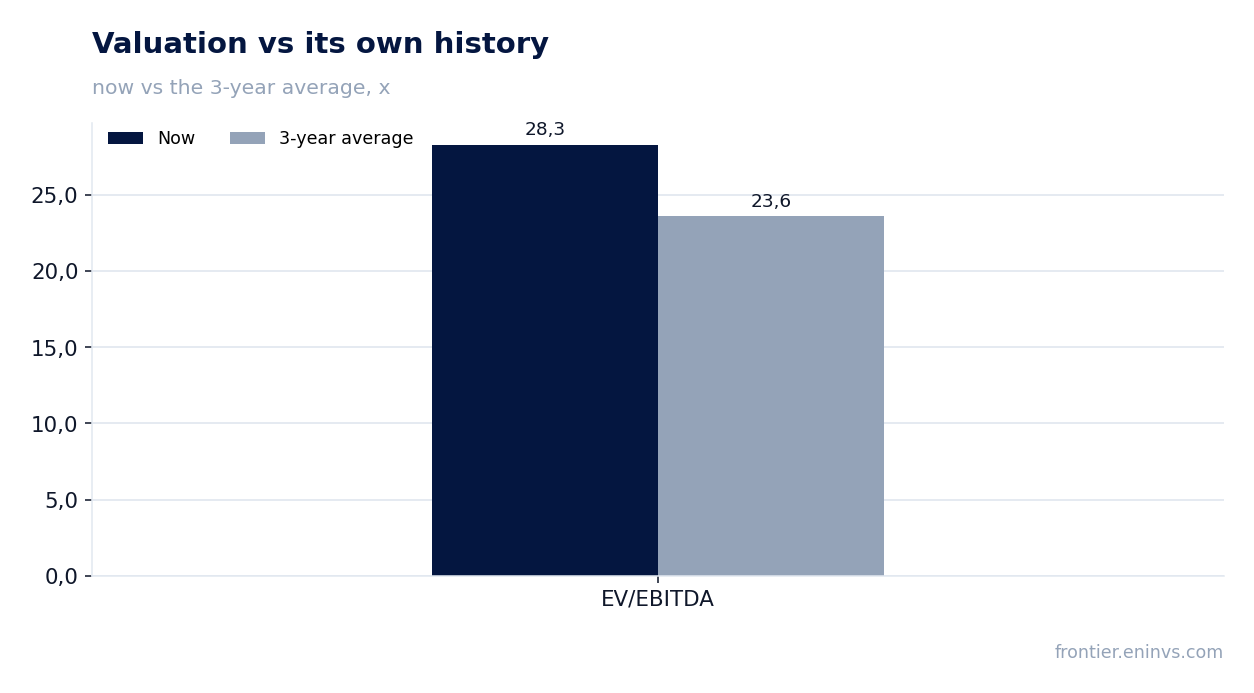
On August 19, 2026, ANALOG DEVICES INC reported fiscal third-quarter 2026 results: revenue grew 39.6% year over year to $4,021.9 million, net profit jumped 158.4% to $1,340.1 million, and adjusted EBITDA margin came in at 42.7%. At the current price, the shares look attractive: the EV/EBITDA multiple (28.3x) is above its own three-year average (23.6x), but the portal's model implies 19% upside.
Key takeaways
— Third-quarter fiscal 2026 revenue rose 39.6% year over year to $4,021.9 million, driven by industrial and data-center demand
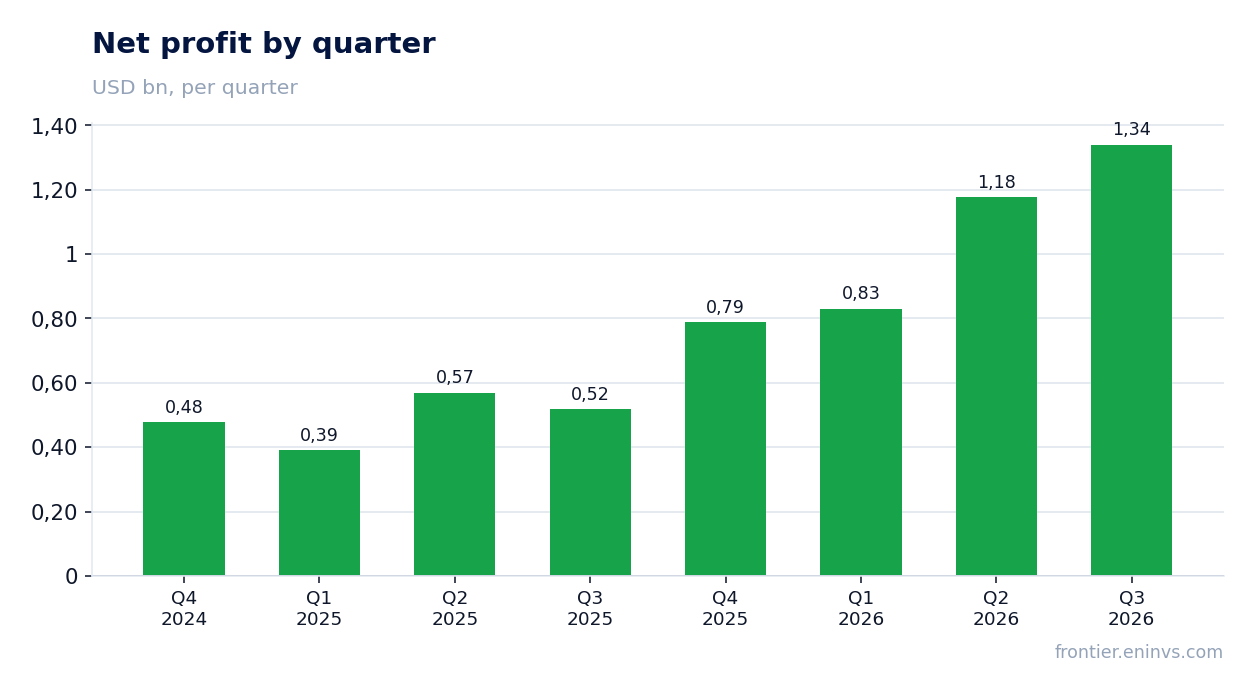
— Quarterly net profit jumped 158.4% to $1,340.1 million, while operating margin expanded by 1,170 bps
— Quarterly EBITDA margin came in at 42.7%, below 45.3% a year earlier, but operating efficiency improved
— Trailing-twelve-month operating cash flow reached $5,500 million, funding $1,692 million in dividends and buybacks during the quarter
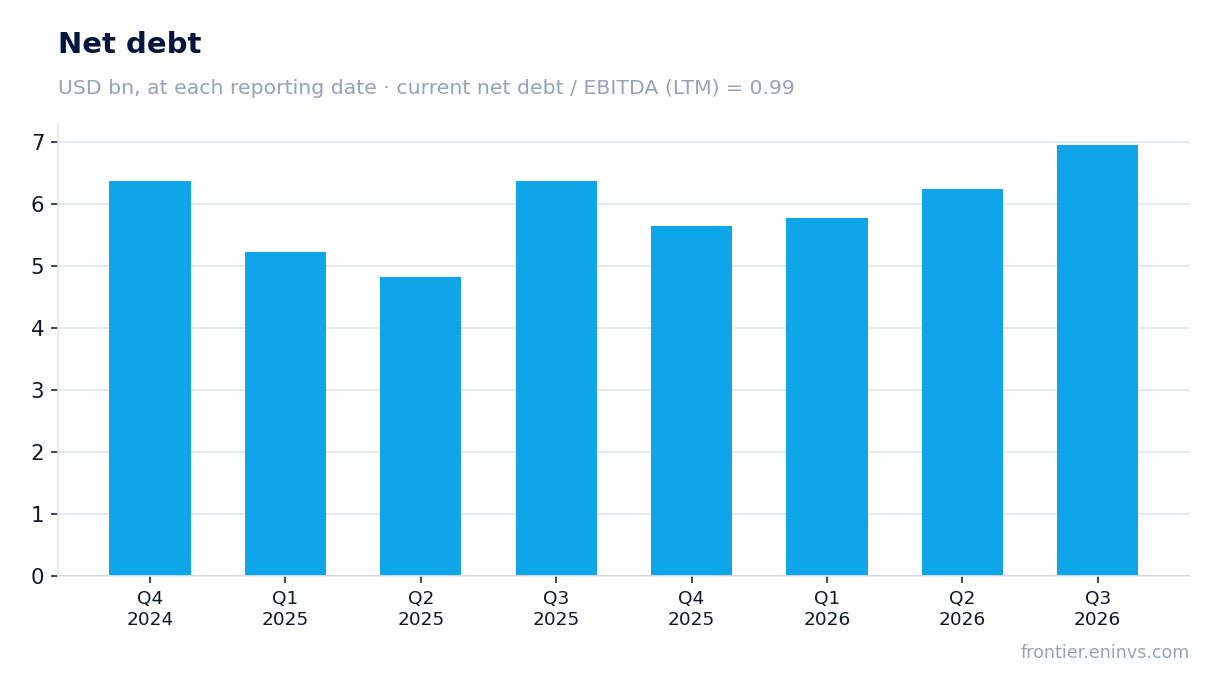
— Net debt rose to $6,955.7 million over the quarter, yet the net-debt-to-EBITDA ratio remains moderate at 0.99x
— Shares trade at 28.3x EV/EBITDA, above their own three-year average of 23.6x, but the portal's model implies 19% upside
Attractiveness
Key figures, USD bn
| Metric | Q3 2025 | Q3 2026 | Change |
|---|---|---|---|
| Revenue | 2.88 | 4.02 | +39.6% |
| EBITDA | 1.31 | 1.72 | +31.6% |
| Operating profit | 0.82 | 1.61 | +97.2% |
| Net profit | 0.52 | 1.34 | +158.4% |
| Operating cash flow | 1.17 | 1.60 | +37.7% |
| Capex | 0.08 | 0.15 | +84.1% |
| EBITDA margin | 45.3% | 42.7% | -2.6 pp |
| Net margin | 18.0% | 33.3% | +15.3 pp |
Third-quarter fiscal 2026 revenue rose 39.6% year over year to $4,021.9 million, driven by industrial and data-center demand
In the fiscal third quarter of 2026 (ended August 1, 2026), ANALOG DEVICES INC reported revenue of $4,021.9 million, up 39.6% from the same quarter a year earlier. The company attributes the growth to strong demand in the industrial segment and data centers, as well as to a broader product portfolio.
The industrial segment contributed $1,971.9 million (+53% year over year), automotive – $998.2 million (+16%), communications – $654.5 million (+84%), and consumer – $397.2 million (+6%). Thus, the main drivers were industrial and communications, together accounting for nearly two-thirds of revenue.
Quarterly net profit jumped 158.4% to $1,340.1 million, while operating margin expanded by 1,170 bps
Net profit for the fiscal third quarter of 2026 came in at $1,340.1 million versus $518.5 million a year earlier – an increase of 158.4%. Operating profit nearly doubled to $1,613.0 million, and operating margin expanded from 28.4% to 40.1%.
The main contributors were higher gross margin (from 62.1% to 67.3%) and operating leverage: R&D and selling, general and administrative expenses grew slower than revenue. The report also includes special items, including a gain of $24.2 million related to restructuring, which partly supported operating profit.
Quarterly EBITDA margin came in at 42.7%, below 45.3% a year earlier, but operating efficiency improved
EBITDA for the fiscal third quarter of 2026 reached $1,717.5 million, up 31.6% from a year earlier. However, EBITDA margin came in at 42.7% versus 45.3% in the same quarter of 2025 – a decline of 2.6 percentage points.
The decline in EBITDA margin alongside higher operating margin stems from different line items: EBITDA excludes depreciation and certain special items that positively affected operating profit this quarter. Nevertheless, the company maintains a high level of profitability, and adjusted operating margin (excluding amortization and one-off items) reached 50.0% versus 42.2% a year earlier.
Trailing-twelve-month operating cash flow reached $5,500 million, funding $1,692 million in dividends and buybacks during the quarter
Over the trailing twelve months (LTM), ANALOG DEVICES INC generated operating cash flow of $5,500 million, equivalent to 40% of revenue. Free cash flow for the same period was $4,937 million (36% of revenue) after capital expenditures of $608 million.
Thanks to strong cash generation, the company returned $1,692 million to shareholders via dividends and buybacks in the fiscal third quarter of 2026, including $535 million in dividends and $1,157 million in repurchases. The board declared a quarterly dividend of $1.10 per share, corresponding to a current dividend yield of about 1.2%.
Net debt rose to $6,955.7 million over the quarter, yet the net-debt-to-EBITDA ratio remains moderate at 0.99x
At the end of the fiscal third quarter of 2026, net debt stood at $6,955.7 million, up $0.7 billion from the previous reporting date and $0.6 billion over the trailing twelve months. The increase is related to funding share buybacks and acquisitions, including the purchase of Empower Semiconductor.
At the same time, the net-debt-to-EBITDA ratio for the trailing twelve months is 0.99x – a moderate level that does not create significant balance-sheet strain. Interest expense for the quarter was $88.7 million, well covered by operating profit.
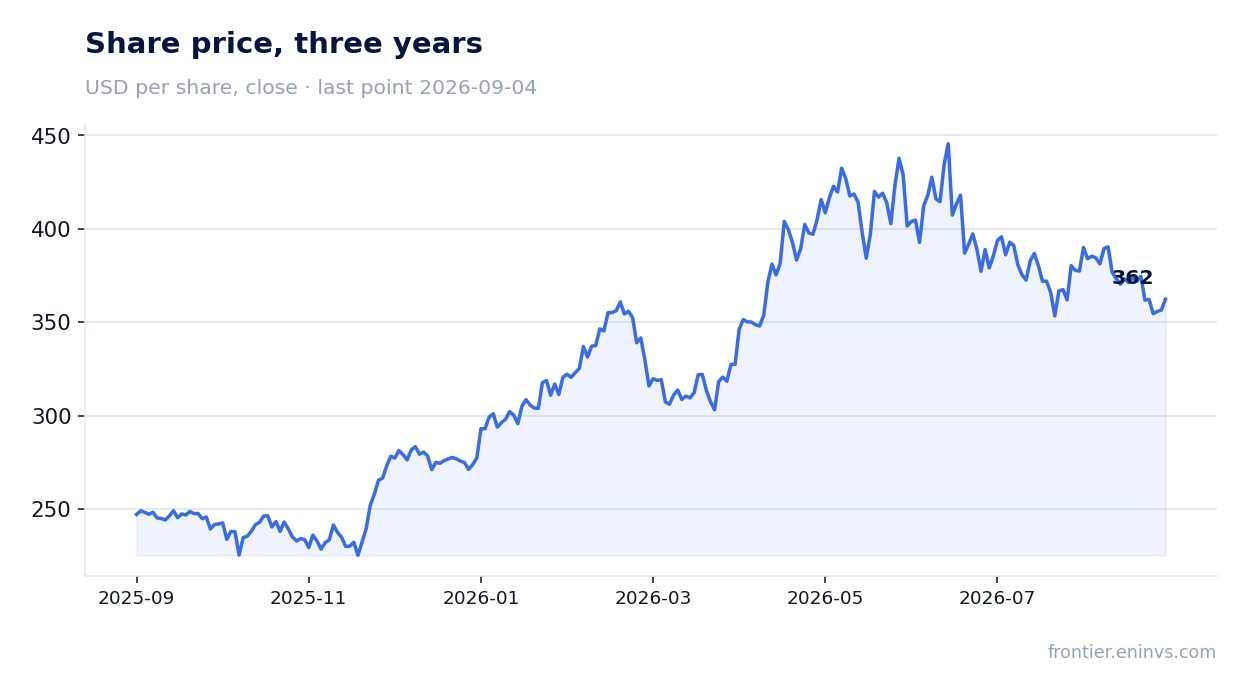
Shares trade at 28.3x EV/EBITDA, above their own three-year average of 23.6x, but the portal's model implies 19% upside
The current EV/EBITDA multiple stands at 28.3x based on trailing-twelve-month data, well above the three-year average of 23.6x. P/E LTM is 42.9x, also reflecting a rich market valuation.
Nevertheless, according to the portal's model, based on EBITDA growth and a target multiple, the upside potential for the shares is +19% from the current price. This suggests that, despite the premium to its own history, the market has not yet fully priced in the acceleration in revenue and profit growth the company has shown in recent quarters.
Valuation on the latest reported figures
| Metric | Value |
|---|---|
| Market cap | 177 bn USD |
| P/E (LTM) | 42.9 |
| EV/EBITDA (LTM) | 28.3 |
| P/B | 5.25 |
| Net debt / EBITDA (LTM) | 0.99 |
| Operating cash flow (LTM) | 5.50 bn |
| ROE | 5.3% |
| Dividend yield (12m) | 1.2% |
| EV/EBITDA, 3-year average | 23.6 |
Bottom line
The fiscal third-quarter 2026 report confirmed strong momentum: revenue accelerated to +39.6% year over year, operating margin expanded to 40.1%, and free cash flow over twelve months reached $4,937 million. Profit growth was partly supported by one-off items, but the main driver was organic demand in industrial and communications. Leverage remains moderate (0.99x EBITDA LTM), and dividends and buybacks are covered by cash flow. However, the shares trade at a premium to their own history, and the portal's model implies +19% upside, making the stock attractive for investors who believe in the continuation of the growth cycle.
Open the company's financial profile ADI →
See also: market overview · valuation map · stock screeners