Allegro MicroSystems: sixth straight quarter of sales growth, but profit barely reaches cash
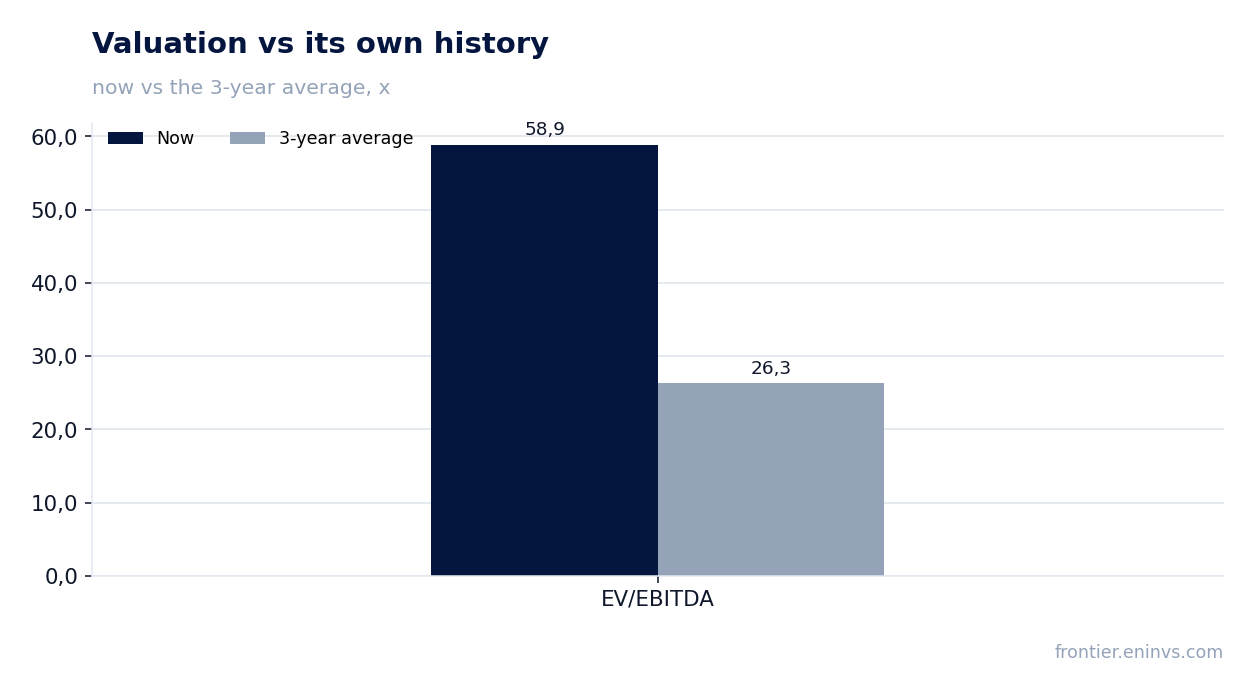
On July 30, Allegro MicroSystems reported results for the first quarter of fiscal 2027 (ended June 26, 2026). Revenue rose 21.0% year over year to $259.2 million, EBITDA jumped 69.2% to $42.3 million, and net income grew 2.4x to $15.9 million. Adjusted EBITDA reached $62.0 million, yet free cash flow was only $14.0 million. At the current price the stock looks unattractive: trailing-twelve-month EV/EBITDA is 58.9 versus its own three-year average of 26.3, and the portal model implies 14% downside to fair value.
Key takeaways
— Revenue grows for a sixth straight quarter, but it is driven by the industrial segment, not automotive
— Margin expansion came from lower operating expenses, not just volume
— Adjusted EBITDA of $62.0 million is nearly double GAAP profit due to one-off items
— Free cash flow of $14.0 million does not even cover dividends, which the company does not pay
— Leverage at 1.25x LTM EBITDA is moderate, but EV/EBITDA of 58.9 versus a three-year average of 26.3
— Guidance for the second quarter of fiscal 2027 implies 26% revenue growth and further margin expansion
Attractiveness
Key figures, USD bn
| Metric | Q2 2025 | Q2 2026 | Change |
|---|---|---|---|
| Revenue | 0.21 | 0.26 | +21.0% |
| EBITDA | 0.02 | 0.04 | +69.2% |
| Operating profit | 0.01 | 0.03 | +307.9% |
| Net profit | 0.01 | 0.02 | +143.5% |
| Operating cash flow | 0.02 | 0.02 | +8.0% |
| Capex | 0.01 | 0.01 | +24.4% |
| EBITDA margin | 10.7% | 14.9% | +4.2 pp |
| Net margin | 3.0% | 6.1% | +3.1 pp |
Revenue grows for a sixth straight quarter, but it is driven by the industrial segment, not automotive
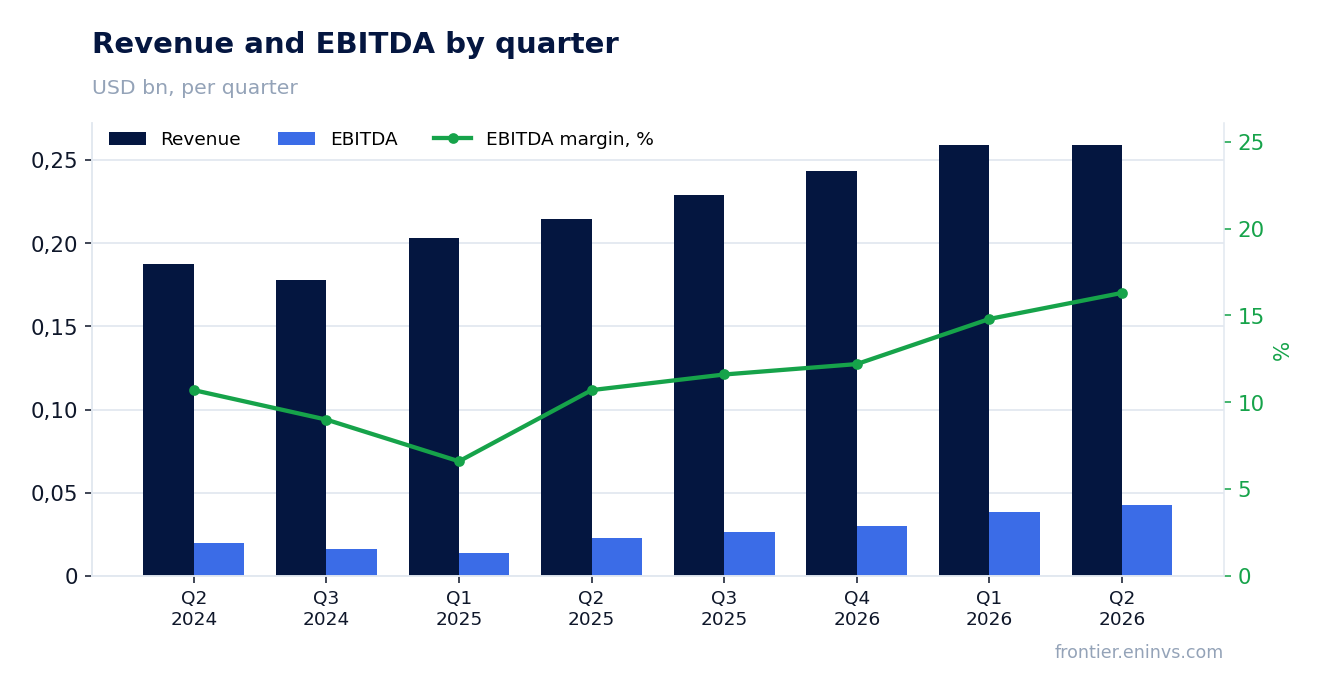
Revenue in the first quarter of fiscal 2027 was $259.2 million, up 21.0% year over year. This marks the sixth consecutive quarter of sales growth. The main contribution came from the industrial and other segment: its revenue jumped 59% to $93.9 million, while the automotive segment grew only 15% to $165.3 million.
The industrial segment's share of total revenue reached 36% versus 29% a year earlier. The company attributes this to record data center sales, which reached 17% of total revenue. The automotive segment grows more slowly but remains the largest, accounting for 64% of sales.
Management notes increasing bookings and an expanding backlog, which supports confidence in continued momentum. Guidance for the second quarter of fiscal 2027 implies revenue of $265–275 million, up 26% year over year at the midpoint.
Margin expansion came from lower operating expenses, not just volume
GAAP gross margin rose to 48.5% from 44.9% a year earlier, while non-GAAP gross margin reached 51.1% from 48.2%. GAAP operating margin was 9.8% versus a loss of 1.3% a year earlier. Non-GAAP operating margin reached 19.4% versus 11.1%.
Margin expansion was not solely due to operating leverage. GAAP operating expenses grew only 6.5% to $100.1 million, while revenue rose 21.0%. In particular, selling, general and administrative expenses declined 5.4% to $45.0 million. This indicates tight cost control.
EBITDA rose 69.2% to $42.3 million, with a margin of 14.9% versus 10.7% a year earlier. However, adjusted EBITDA, as calculated by the company, reached $62.0 million with a margin of 23.9%. The gap between these figures is explained by one-off items that the company excludes.
Adjusted EBITDA of $62.0 million is nearly double GAAP profit due to one-off items
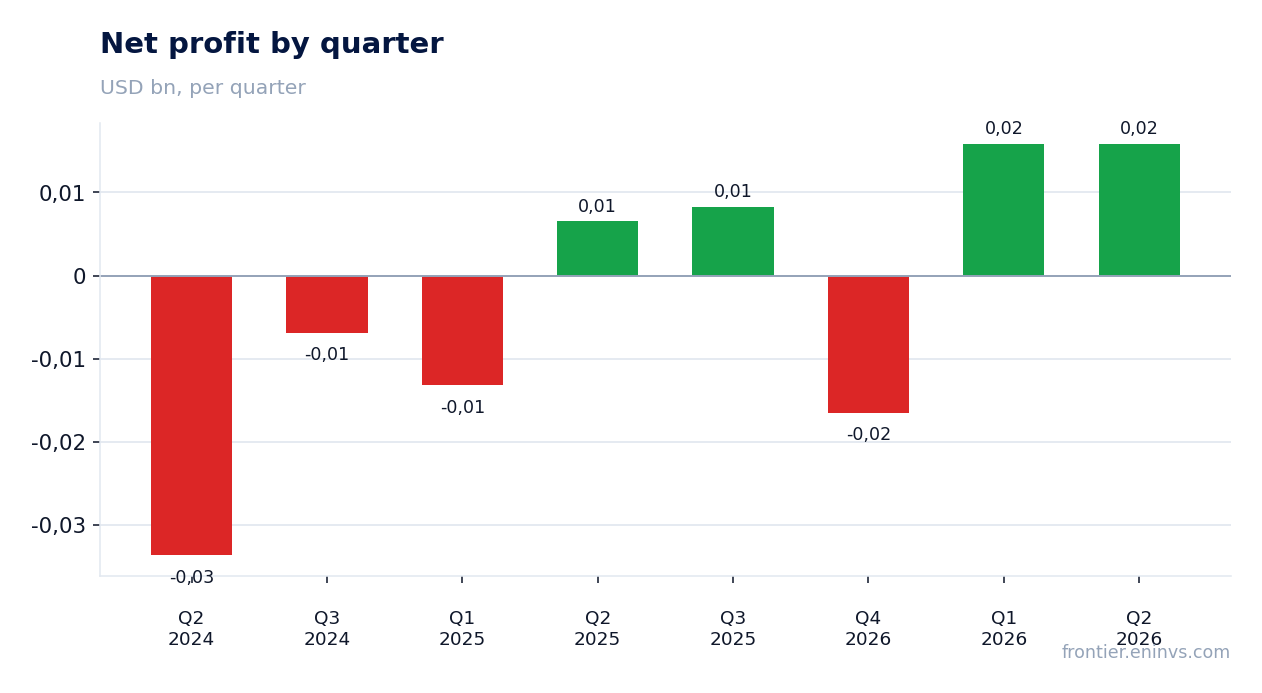
GAAP net income was $15.9 million versus a loss of $13.2 million a year earlier. However, non-GAAP net income reached $42.5 million, and adjusted EBITDA was $62.0 million. The $46.1 million gap between GAAP and adjusted EBITDA is due to items the company considers one-off.
Key adjustments: stock-based compensation of $17.2 million, amortization of acquired intangibles of $5.6 million, restructuring costs of $0.7 million, and other costs of $5.9 million. The company also excluded $9 thousand in transaction-related costs. These items are either non-cash or recurring, but the company excludes them.
Importantly, stock-based compensation is a real expense that dilutes shareholders. During the quarter, the company spent $17.8 million to repurchase shares from employees to cover taxes related to these compensations. This exceeds GAAP net income.
Free cash flow of $14.0 million does not even cover dividends, which the company does not pay
Operating cash flow for the quarter was $22.0 million versus $61.6 million a year earlier. Free cash flow was $14.0 million versus $51.0 million. The decline is due to a $7.9 million increase in inventories and a $5.4 million rise in receivables, as well as a $15.0 million payment to a related party.
Capital expenditures were $8.0 million, slightly below the prior-year figure of $10.6 million. The company does not pay dividends, so all free cash flow is retained in the business. However, its volume is small relative to the market capitalization of $6.6 billion.
Over the trailing twelve months, operating cash flow was $163.1 million and revenue was $945.9 million. This means conversion of revenue into cash flow remains low. To support growth, the company will likely need additional investment in working capital.
Leverage at 1.25x LTM EBITDA is moderate, but EV/EBITDA of 58.9 versus a three-year average of 26.3
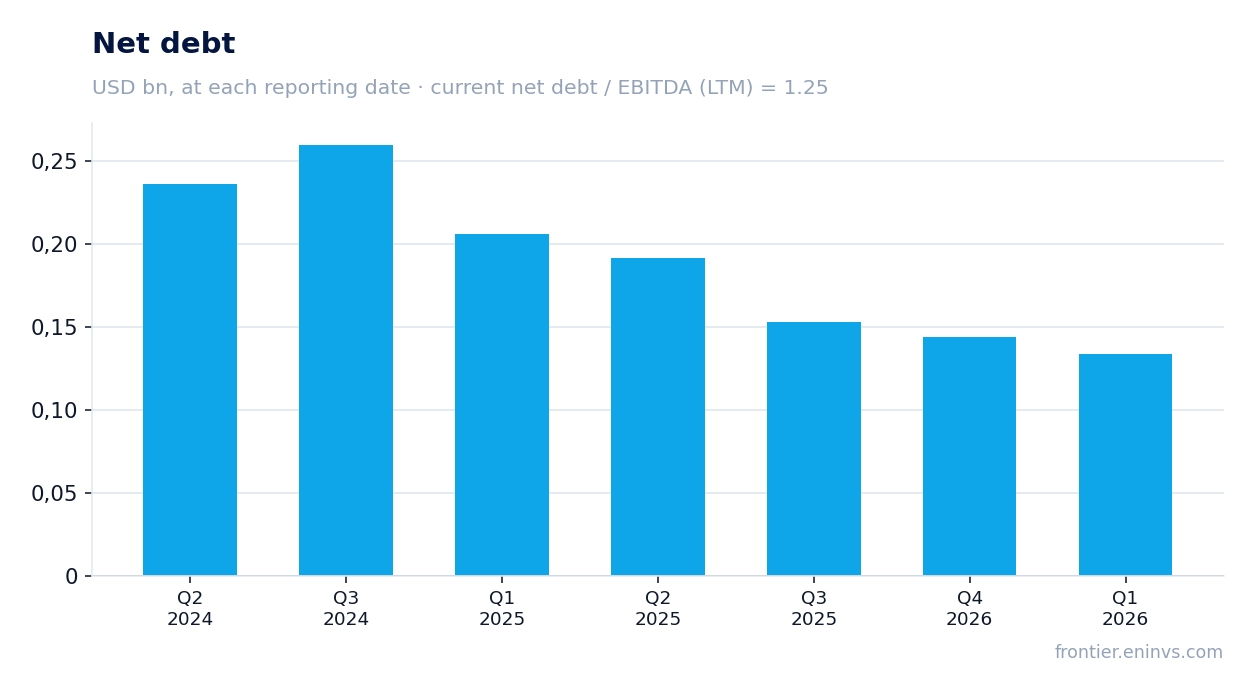
Net debt at the end of the quarter was $143.6 million, equivalent to 1.25x trailing twelve-month EBITDA. This is a moderate level for a company with a market capitalization of $6.6 billion. Leverage is not a problem, but it also does not provide room for significant borrowing.
The main issue is valuation. Trailing twelve-month EV/EBITDA is 58.9, more than double its own three-year average of 26.3. This means the market is pricing in very high growth expectations. The portal model estimates fair value 14% below the current price.
Return on equity (ROE) is 6.6%, which is low for a company trading at such a premium to its historical multiple. To justify the current valuation, the company needs to significantly increase profit and cash flow.
Guidance for the second quarter of fiscal 2027 implies 26% revenue growth and further margin expansion
The company provided guidance for the second quarter of fiscal 2027: revenue of $265–275 million, up 26% year over year at the midpoint. Non-GAAP gross margin is expected at 50.75–51.75%, and operating expenses at $84.5 million plus or minus $1 million.
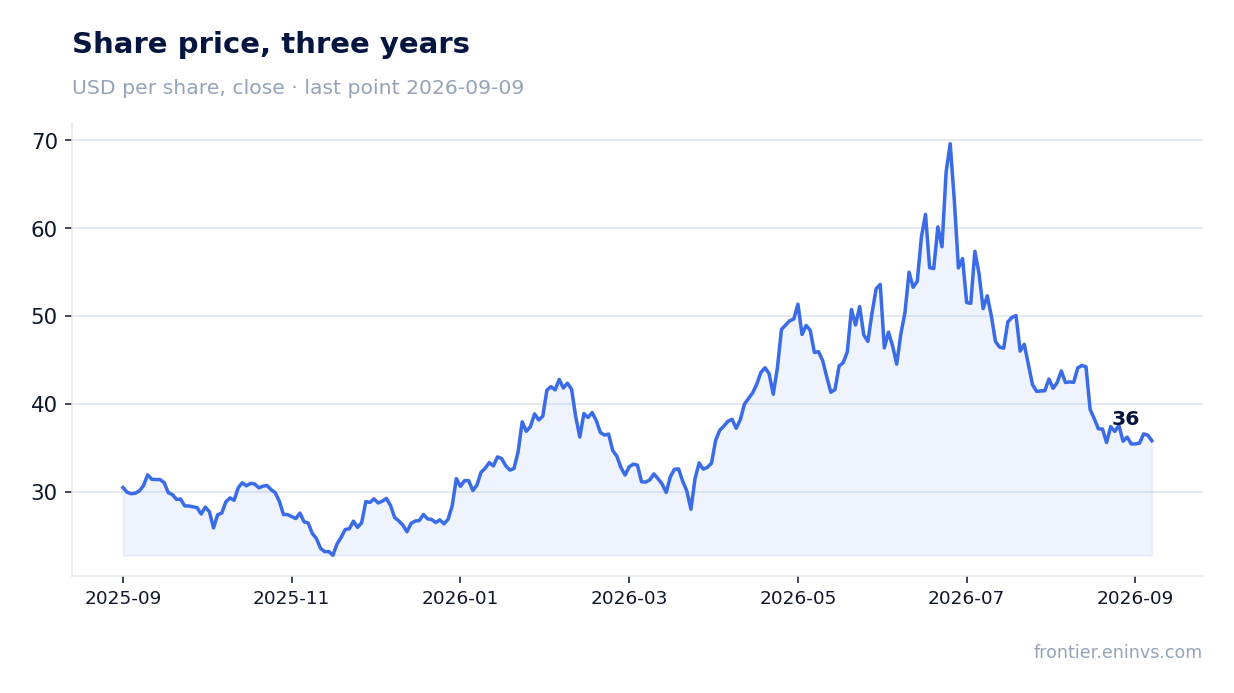
Non-GAAP earnings per share is projected at $0.23–0.26, implying 88% year-over-year growth at the midpoint. This is a positive signal, but it is already priced in. After the report, the stock fell 1.8%, and from the release to September 9 it declined 15.1%.
The market appears to have expected more. Despite strong operating results, valuation remains high. For the stock to rise further, the company needs not only to meet guidance but also to show acceleration in cash flow.
Valuation on the latest reported figures
| Metric | Value |
|---|---|
| Market cap | 6.63 bn USD |
| EV/EBITDA (LTM) | 58.9 |
| P/B | 6.95 |
| Net debt / EBITDA (LTM) | 1.25 |
| Operating cash flow (LTM) | 0.16 bn |
| ROE | 6.6% |
| EV/EBITDA, 3-year average | 26.3 |
Bottom line
Bottom line: Allegro MicroSystems delivered strong revenue and margin growth, but the quality of earnings is questionable. Adjusted EBITDA is nearly double GAAP profit, and free cash flow does not even cover stock-based compensation. Valuation remains extremely high: EV/EBITDA of 58.9 versus a historical average of 26.3. At the current price the stock looks unattractive, and a change in verdict would require either a substantial increase in cash flow or a price decline to levels consistent with its historical multiple.
Open the company's financial profile ALGM →
See also: market overview · valuation map · stock screeners