APPLIED MATERIALS INC /DE: record revenue and margin, but shares fell 17% – market has already priced in growth
13 августа 2026 года APPLIED MATERIALS INC /DE раскрыла результаты за третий квартал 2026 финансового года. Выручка выросла на 24,8% год к году до рекордных 9 115 млн долл., EBITDA – на 37,5%, а чистая прибыль – на 42,7%. Несмотря на сильные цифры, акции после релиза упали на 17% – при текущей цене и мультипликаторах, значительно превышающих собственную историю, бумага выглядит скорее непривлекательной.
Key takeaways
— Revenue grew 24.8% to a record $9.1 billion – the highest quarterly growth in company history
— EBITDA margin expanded to 35.4% from 32.1% a year earlier – 13th consecutive quarter of gross margin expansion
— Net profit rose 42.7% to $2.5 billion, but includes one-off items
— Operating cash flow reached a record $3.0 billion, but the company spent $707 million on capex
— Net debt is negative: minus $2.7 billion – the company finances growth without borrowing
— Shares fell 17% after the report despite better-than-expected results – market fears slowdown in 2027
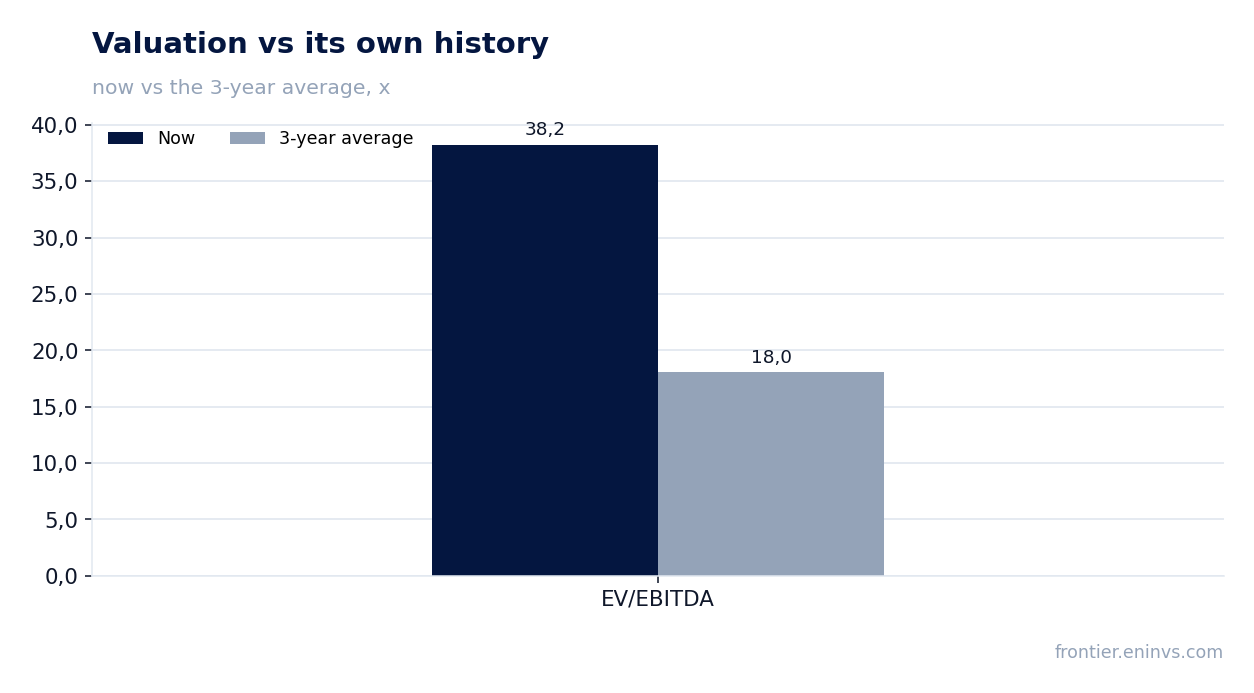
— Multiples are significantly above its own history: EV/EBITDA 38.2 vs. 3-year average of 18.0
Attractiveness
Key figures, USD bn
| Metric | Q3 2025 | Q3 2026 | Change |
|---|---|---|---|
| Revenue | 7.30 | 9.12 | +24.8% |
| EBITDA | 2.35 | 3.23 | +37.5% |
| Operating profit | 2.23 | 3.08 | +37.7% |
| Net profit | 1.78 | 2.54 | +42.7% |
| Operating cash flow | 2.63 | 3.04 | +15.3% |
| Capex | 0.58 | 0.71 | +21.1% |
| EBITDA margin | 32.1% | 35.4% | +3.3 pp |
| Net margin | 24.4% | 27.8% | +3.4 pp |
Revenue grew 24.8% to a record $9.1 billion – the highest quarterly growth in company history
In the third quarter of fiscal 2026, APPLIED MATERIALS INC /DE reported revenue of $9,115 million, up 24.8% year-over-year. This is the highest quarterly growth in the company's history, as CEO Gary Dickerson noted. The main driver was the Semiconductor Systems segment, whose revenue rose to $7,040 million from $5,564 million a year earlier.
In the Semiconductor Systems segment, demand for DRAM was particularly strong: the share of this direction in segment revenue increased from 22% to 26%. The company also notes strong demand for leading-edge logic and packaging. Applied Materials is raising its Semiconductor Systems revenue expectations for calendar 2026 and expects another strong year in 2027.
Revenue growth accelerated compared to previous quarters: in Q2 2026 it was 11.4%, and in Q3 – already 24.8%. The company attributes this to the rapid adoption of AI, which is driving demand for its materials engineering solutions.
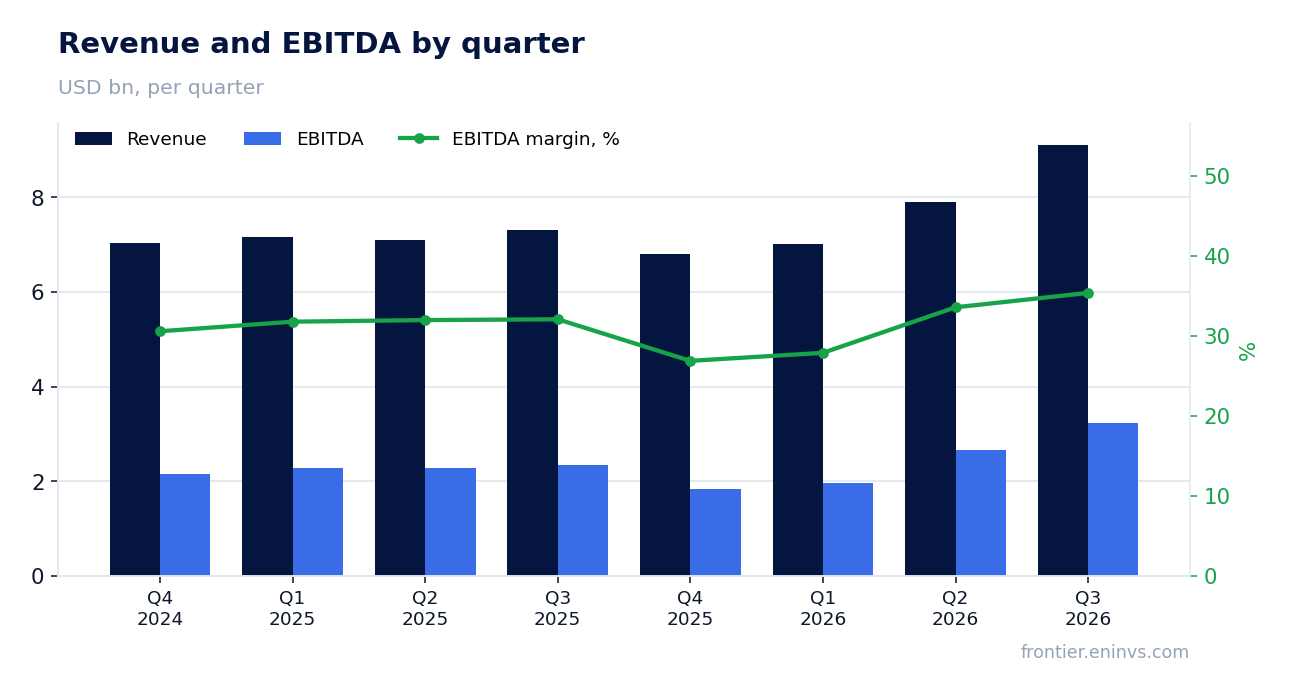
EBITDA margin expanded to 35.4% from 32.1% a year earlier – 13th consecutive quarter of gross margin expansion
EBITDA in Q3 2026 grew 37.5% year-over-year to $3,226 million, and EBITDA margin reached 35.4% versus 32.1% a year earlier. The company notes that gross margin has expanded for 13 consecutive quarters – a result of the increasing value Applied Materials creates for customers.
Operating margin also increased: GAAP operating margin was 33.7% versus 30.6% a year earlier. In the Semiconductor Systems segment, operating margin rose from 33.0% to 37.7%. The margin expansion reflects not only higher volumes but also an improved product mix – especially in DRAM and advanced packaging.
Net margin increased to 27.8% from 24.4% a year earlier. This was driven by profit growing faster than revenue, as well as a lower effective tax rate – the report shows that Q3 2025 included one-off tax effects that did not repeat.
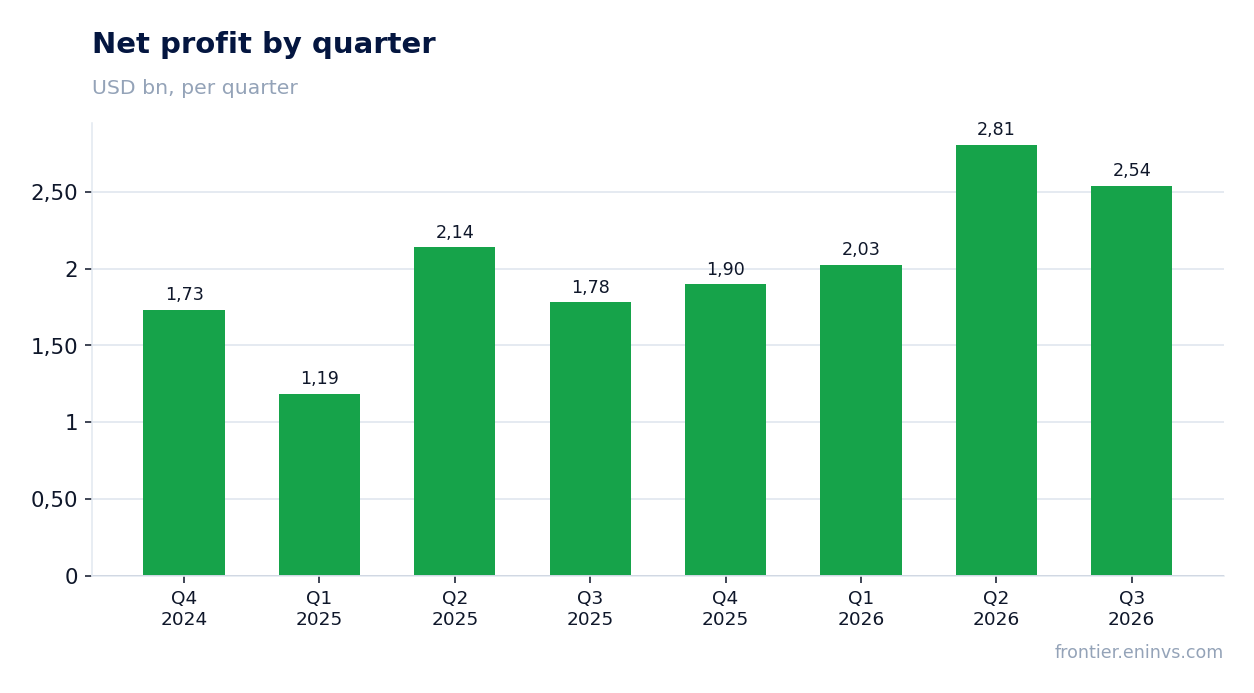
Net profit rose 42.7% to $2.5 billion, but includes one-off items
Net profit for Q3 2026 was $2,538 million, up 42.7% year-over-year. However, there are notable one-off items in the profit: the report shows a loss on strategic investments of $220 million (unrealized), as well as tax effects related to intra-entity transfers of intangible assets.
Excluding these items, non-GAAP net profit would have been $2,795 million, and non-GAAP EPS – $3.50 versus $2.48 a year earlier. GAAP EPS was $3.17. The difference between GAAP and non-GAAP is mainly explained by the investment loss.
For an investor, it is important to understand that the 42.7% net profit growth is not only an operating result but also an effect of a low base: a year earlier, Q3 included one-off tax expenses, including a valuation allowance against deferred tax assets.
Operating cash flow reached a record $3.0 billion, but the company spent $707 million on capex
Operating cash flow in Q3 2026 was $3,037 million – a record for the company. Capital expenditures were $707 million, up 21% year-over-year. Non-GAAP free cash flow reached $2,330 million versus $2,050 million a year earlier.
The increase in capex reflects investments in expanding manufacturing capacity, including a new campus in Singapore worth $500 million, which more than doubles the company's cleanroom capacity in the region. The company is also investing in capacity expansion to support demand through the end of the decade.
For the first nine months of fiscal 2026, operating cash flow was $5,568 million, and capex was $1,988 million. This means the company generates enough cash to fund investments and dividend payments without taking on debt.
Net debt is negative: minus $2.7 billion – the company finances growth without borrowing
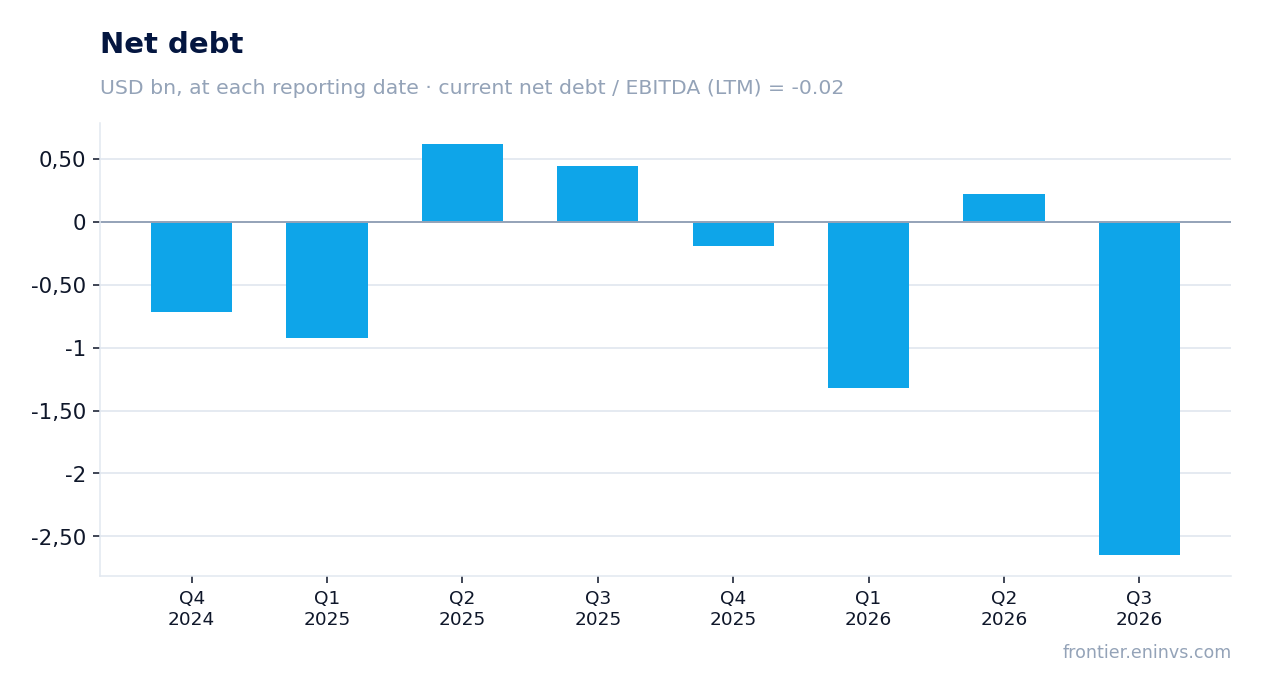
At the end of Q3 2026, APPLIED MATERIALS INC /DE's net debt was minus $2,651 million, meaning cash and short-term investments exceeded debt. A year earlier, net debt was positive at $448 million. The company reduced debt by $3.1 billion over the last 12 months.
The net debt / EBITDA ratio for the trailing twelve months is minus 0.02 – the company has virtually no debt burden. This provides financial flexibility for growth investments and returning capital to shareholders.
In Q3, the company distributed $860 million to shareholders: $440 million in share repurchases and $420 million in dividends. The dividend yield over the trailing twelve months is 0.42% – a modest figure, but the company prefers to reinvest in growth.
Shares fell 17% after the report despite better-than-expected results – market fears slowdown in 2027
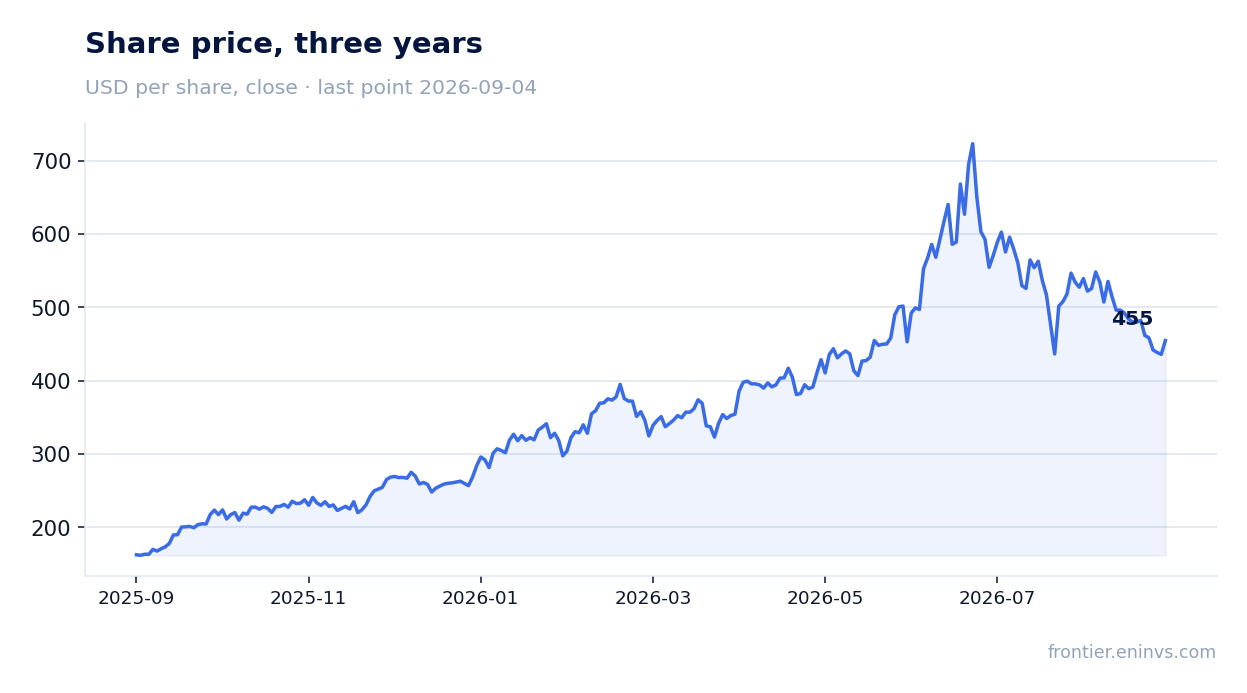
The share price of APPLIED MATERIALS INC /DE before the report was $548.15. On the release day, shares fell 2.5%, and by September 4, 2026 – already 17% from the pre-release level. This market reaction looks paradoxical given the record results.
A possible explanation is that the market fears current growth rates are unsustainable. The company expects Q4 fiscal 2026 revenue in the range of $10,250 million plus or minus $500 million, implying continued growth, but investors may doubt its long-term sustainability.
Moreover, after strong share price appreciation in previous periods, multiples have reached levels that leave little room for error. Even after the 17% decline, shares trade at P/E of 40.2 and EV/EBITDA of 38.2 – significantly above the three-year averages.
Multiples are significantly above its own history: EV/EBITDA 38.2 vs. 3-year average of 18.0
The current EV/EBITDA multiple is 38.2 – more than double the three-year average of 18.0. P/E is also high at 40.2. Such valuation implies that the market expects continued high profit growth rates for a long time.
According to the portal's model, the upside of the share to its fair value is +16%. However, the portal's model uses its own assumptions about EBITDA growth and a target multiple – it is not a market consensus or a target price.
Comparison with its own history shows that the current valuation is at an extremely high level. Even if the company continues to grow at high rates, the current price already largely reflects this growth. Justifying such a valuation would require not only maintaining current growth rates but also accelerating them.
Valuation on the latest reported figures
| Metric | Value |
|---|---|
| Market cap | 372 bn USD |
| P/E (LTM) | 40.2 |
| EV/EBITDA (LTM) | 38.2 |
| P/B | 18.23 |
| Net debt / EBITDA (LTM) | -0.02 |
| Operating cash flow (LTM) | 8.00 bn |
| ROE | 13.7% |
| Dividend yield (12m) | 0.4% |
| EV/EBITDA, 3-year average | 18.0 |
Bottom line
APPLIED MATERIALS INC /DE delivered a strong quarter: record revenue, margin expansion, record operating cash flow, and negative net debt. The 24.8% growth in Q3 is the highest in history, and the company is raising expectations for 2026. However, shares fell 17% after the report, and at current multiples (EV/EBITDA 38.2 vs. 3-year average of 18.0), the valuation looks stretched. Our verdict is rather unattractive: even with strong results and potential growth in 2027, the current price leaves little room for error. A change in the verdict would require either a decline in multiples to more historically normal levels or confirmation of accelerating growth in the coming quarters.
Open the company's financial profile AMAT →
See also: market overview · valuation map · stock screeners