ADVANCED MICRO DEVICES INC: revenue accelerates to +50%, but valuation already at 86x EV/EBITDA
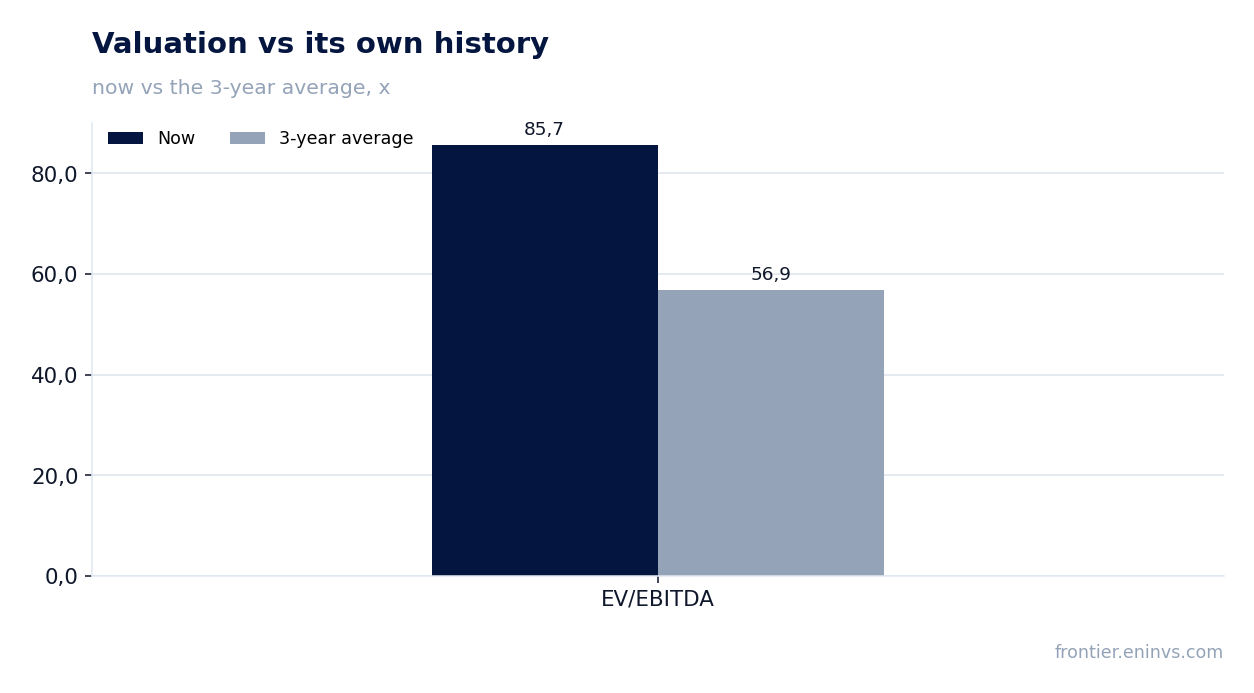
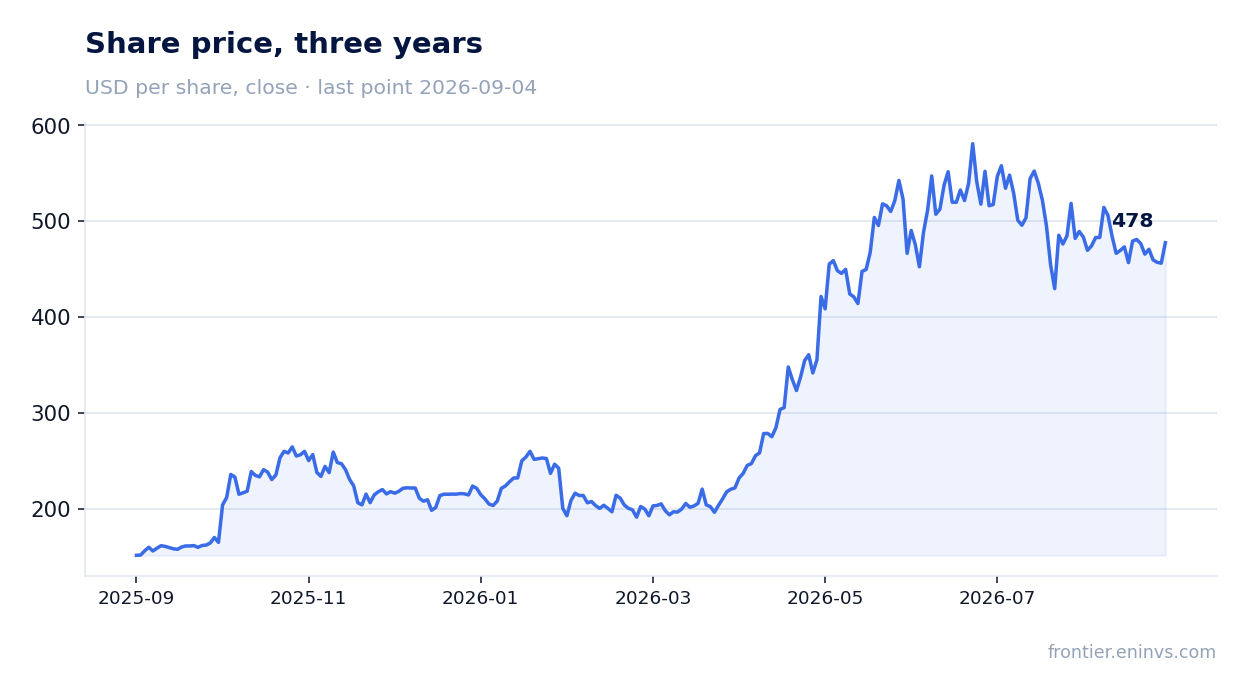
4 августа 2026 года ADVANCED MICRO DEVICES INC раскрыла результаты за второй квартал 2026 года: выручка выросла на 50,1% год к году до 11 536 млн долл., чистая прибыль – на 163,4% до 2 297 млн долл., а EBITDA – на 672,6% до 2 755 млн долл., при этом маржа EBITDA достигла 29,1% против 5,6% годом ранее. Акции на релизе прибавили 7,0%, но с тех пор скорректировались на 1,5%. При текущей капитализации в 822 302,68 млн долл. и EV/EBITDA в 85,7 против среднего за три года 56,9 бумага выглядит скорее привлекательной только при сохранении двузначных темпов роста и дальнейшего расширения маржи.
Key takeaways
— Revenue in Q2 2026 grew 50.1% YoY to $11,536 million, driven by the data center segment
— EBITDA in Q2 jumped 672.6% YoY, but the base was distorted by a one-off $800 million charge a year earlier
— Net profit in Q2 grew 163.4% to $2,297 million, supported by higher operating income and other income
— Data center segment more than doubled revenue to $6,718 million, representing 58% of total revenue
— Operating cash flow over the last twelve months was $7,700 million, while capex in Q2 rose to $808 million
— Net debt is negative: minus $8,835 million at the end of Q2, with net debt/EBITDA LTM at minus 0.07
— EV/EBITDA multiple of 85.7x is roughly double its own three-year average of 56.9x
Attractiveness
Key figures, USD bn
| Metric | Q2 2025 | Q2 2026 | Change |
|---|---|---|---|
| Revenue | 7.68 | 11.5 | +50.1% |
| EBITDA | 0.43 | 3.35 | +672.6% |
| Operating profit | -0.13 | 1.99 | to profit |
| Net profit | 0.87 | 2.30 | +163.4% |
| Operating cash flow | 2.01 | 2.37 | +17.7% |
| Capex | 0.28 | 0.81 | +186.5% |
| EBITDA margin | 5.6% | 29.1% | +23.5 pp |
| Net margin | 11.3% | 19.9% | +8.6 pp |
1. Revenue in Q2 2026 grew 50.1% YoY to $11,536 million, driven by the data center segment
In Q2 2026, ADVANCED MICRO DEVICES INC revenue reached $11,536 million, up 50.1% YoY. This is a notable acceleration from prior quarters: Q1 2026 grew 37.8% and Q4 2025 grew 34.1%. The company attributes the performance to strong demand for EPYC processors and Instinct accelerators, as well as the initial ramp of Helios solutions.
The key driver was the data center segment, whose revenue reached $6,718 million in Q2, up 107% YoY. The segment contributed 58% of total revenue. Client and Gaming segment grew only 6% to $3,841 million, with Gaming down 31% to $779 million due to lower semi-custom revenue. Embedded segment rose 19% to $977 million.
2. EBITDA in Q2 jumped 672.6% YoY, but the base was distorted by a one-off $800 million charge a year earlier
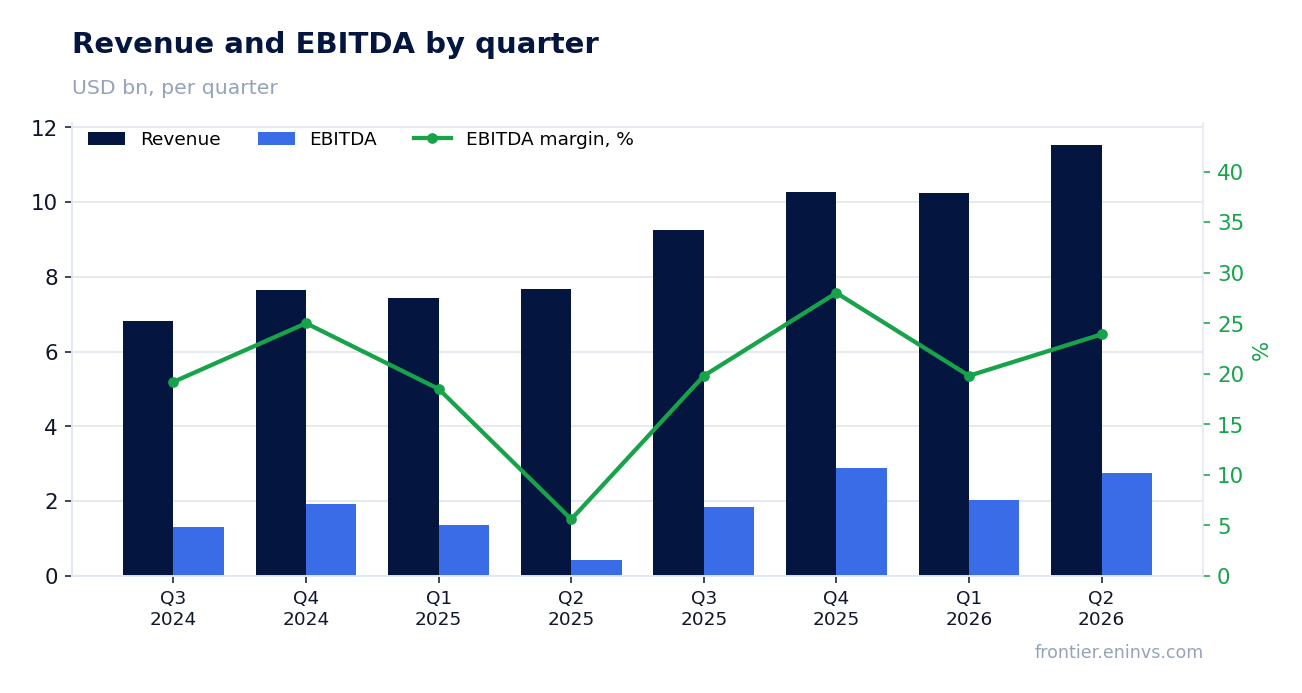
EBITDA in Q2 2026 was $2,755 million versus $434 million a year earlier – up 672.6%. However, the prior-year result was depressed by a one-off inventory charge of $800 million related to US export controls on Instinct MI308 GPUs. Without that effect, the base would have been materially higher, making the growth look less dramatic.
EBITDA margin in Q2 2026 reached 29.1% versus 5.6% a year earlier. The margin expansion reflects operating leverage but also the low base effect. In Q1 2026, EBITDA margin was 19.8% (calculated: 2,027 / 10,253), indicating sequential improvement.
3. Net profit in Q2 grew 163.4% to $2,297 million, supported by higher operating income and other income
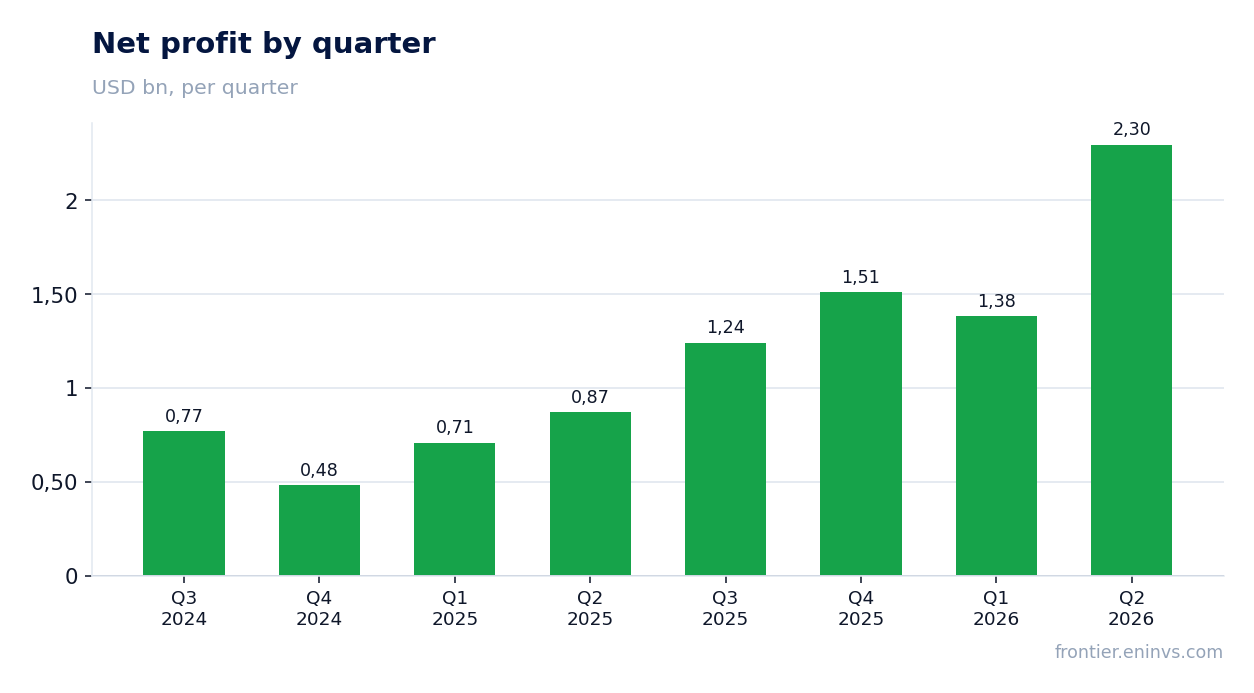
Net profit in Q2 2026 was $2,297 million, up 163.4% YoY. Operating income swung from a loss of $134 million to $1,990 million, helped by higher revenue and normalized cost of sales after the one-off charge.
Additional support came from other income of $598 million, including gains on long-term investments. Excluding those items, net profit would have been lower but still well above the prior-year level. Net margin in Q2 reached 19.9% versus 11.3% a year earlier.
4. Data center segment more than doubled revenue to $6,718 million, representing 58% of total revenue
The data center segment generated $6,718 million in Q2 2026, up 107% YoY. The company cites strong demand for EPYC processors and Instinct accelerators, as well as the initial ramp of new solutions, including the Helios platform and Instinct MI400 series GPUs.
Segment operating income was $2,103 million versus a loss of $155 million a year earlier. The segment's growth is the main driver of overall acceleration: without it, company growth would have been far more modest. In H2, the company expects further acceleration in data center sales.
5. Operating cash flow over the last twelve months was $7,700 million, while capex in Q2 rose to $808 million
Over the last twelve months (LTM), operating cash flow of ADVANCED MICRO DEVICES INC was $7,700 million. In Q2 2026, OCF was $2,366 million, lower than Q1 ($2,955 million) but well above the prior-year level ($2,011 million).
Capital expenditures in Q2 rose to $808 million – nearly double Q1 ($389 million) and triple the year-ago figure ($282 million). The increase reflects investments in capacity expansion and new products. Free cash flow for the quarter was $1,558 million (calculated: 2,366 – 808).
6. Net debt is negative: minus $8,835 million at the end of Q2, with net debt/EBITDA LTM at minus 0.07
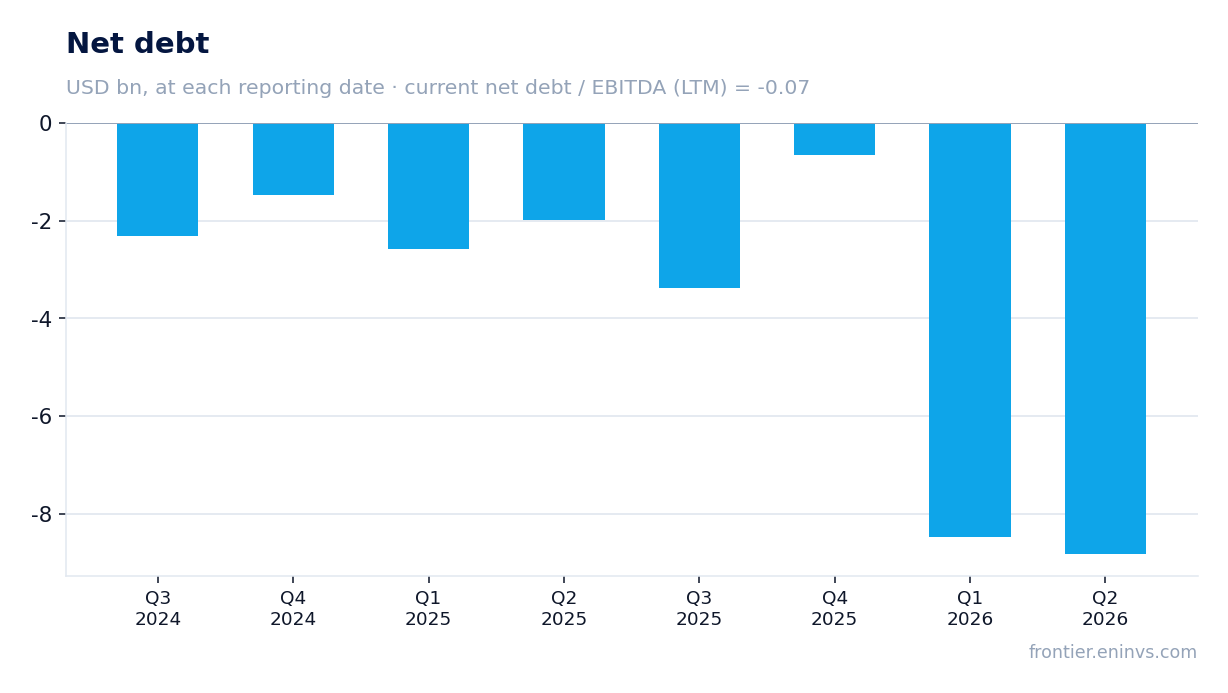
At the end of Q2 2026, the company had a net cash position of $8,835 million (negative net debt). Sequentially, net cash improved by $0.4 billion, and over the last twelve months by $6.9 billion, reflecting strong cash generation.
Net debt/EBITDA LTM stands at minus 0.07 – the company is net cash, providing financial flexibility for investments and potential acquisitions. Total debt on the balance sheet is $3,226 million, while cash and short-term investments are $13,111 million.
7. EV/EBITDA multiple of 85.7x is roughly double its own three-year average of 56.9x
With a market cap of $822,302.68 million and LTM EBITDA of $9,585.4 million, EV/EBITDA stands at 85.7. This is well above the three-year average of 56.9. Even with accelerating revenue and margin expansion, the valuation implies the market expects current growth rates to persist for an extended period.
P/E LTM is 127.8 – at this price, investors are paying for future growth rather than current results. The stock trades at a premium to its own history, making it sensitive to any slowdown in growth or margin contraction.
Valuation on the latest reported figures
| Metric | Value |
|---|---|
| Market cap | 822 bn USD |
| P/E (LTM) | 127.8 |
| EV/EBITDA (LTM) | 85.7 |
| P/B | 13.05 |
| Net debt / EBITDA (LTM) | -0.07 |
| Operating cash flow (LTM) | 7.70 bn |
| ROE | 14.0% |
| EV/EBITDA, 3-year average | 56.9 |
Bottom line
Отчёт за второй квартал 2026 года показал впечатляющее ускорение: выручка выросла на 50,1% до 11 536 млн долл., EBITDA – на 672,6% до 2 755 млн долл., а чистая прибыль – на 163,4% до 2 297 млн долл. Ключевым драйвером стал дата-центровый сегмент, удвоивший выручку до 6 718 млн долл. и обеспечивший 58% оборота. Рост маржинальности частично объясняется эффектом низкой базы из-за разового списания годом ранее, но операционная динамика остаётся сильной. Компания имеет нетто-кэш в 8 835 млн долл. и генерирует значительный операционный денежный поток, что даёт ресурсы для инвестиций. Однако оценка уже учитывает многое: EV/EBITDA в 85,7 раза против средней за три года в 56,9 раза, а P/E LTM – 127,8. При таком уровне цен бумага выглядит скорее привлекательной только для инвесторов, готовых платить за продолжение сверхбыстрого роста; любое замедление может привести к переоценке.
Open the company's financial profile AMD →
See also: market overview · valuation map · stock screeners