AMGEN INC: quarterly profit up 66%, but R&D spending and regulatory risks remain key drivers

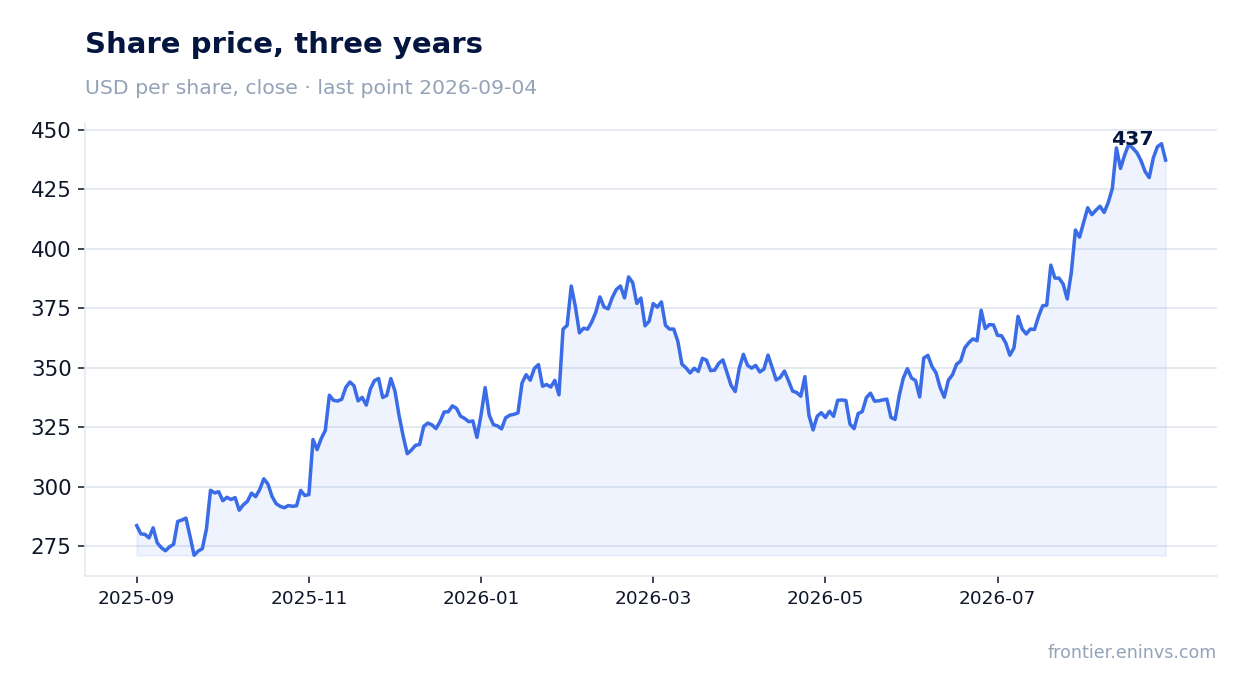
4 августа 2026 года AMGEN INC раскрыла результаты за второй квартал 2026 года: выручка выросла на 9,5% до 10 054 млн долл., EBITDA – на 15,7% до 4 626 млн долл., чистая прибыль – на 65,9% до 2 375 млн долл.. Акции после релиза прибавили 2,9%, а с момента публикации до 4 сентября – 15,4%. При текущей цене бумага выглядит скорее привлекательно: рост выручки и маржинальности подкреплён сильным портфелем, но оценка в 17,3 EV/EBITDA близка к трёхлетнему среднему, и ключевой вопрос – сможет ли компания поддерживать темпы роста на фоне регуляторных рисков.
Key takeaways
— Revenue in Q2 grew 9.5% to $10,054 million, with six key growth drivers up 26%
— EBITDA margin expanded 2.5 pp to 46.0% on lower cost of sales, down 4.8 pp as a percentage of product sales
— Net profit jumped 65.9% to $2,375 million on higher revenue and operating margin
— Operating cash flow for the quarter was $4,000 million, free cash flow $3,500 million, double the year-ago level
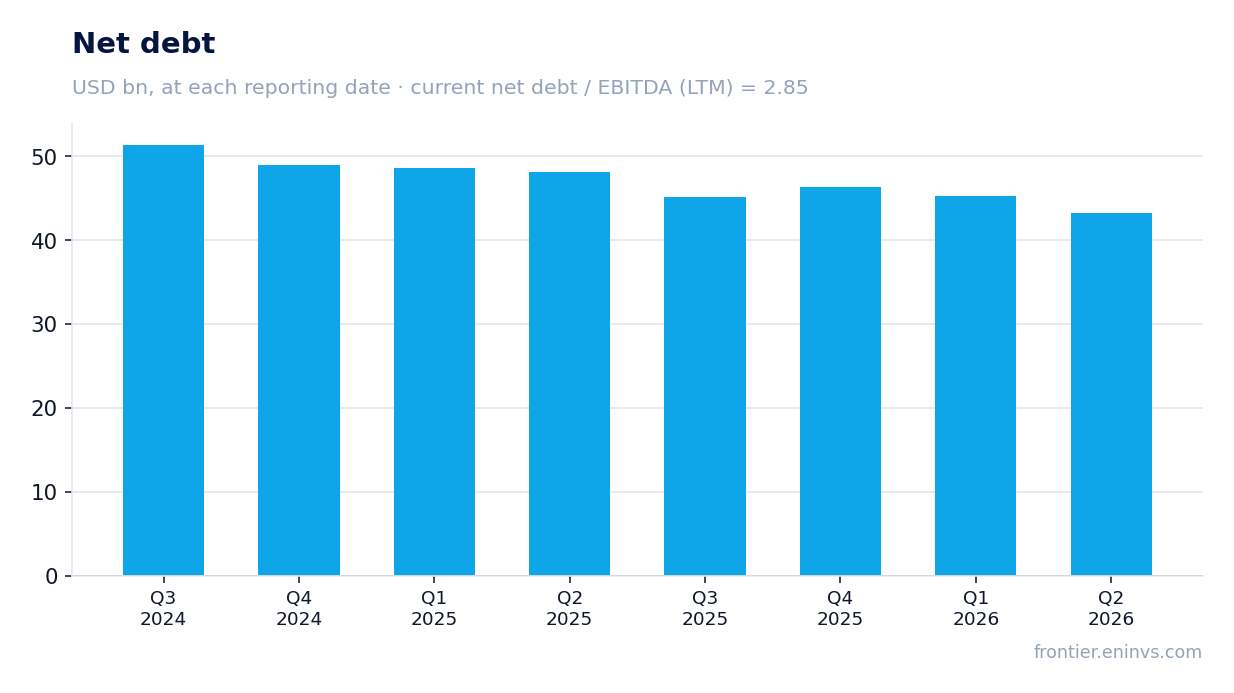
— Net debt declined by $2.0 billion from the prior reporting date to $46,306 million
— The company reaffirmed its 2026 guidance: revenue $38.2–39.4 billion, capex approximately $2.6 billion
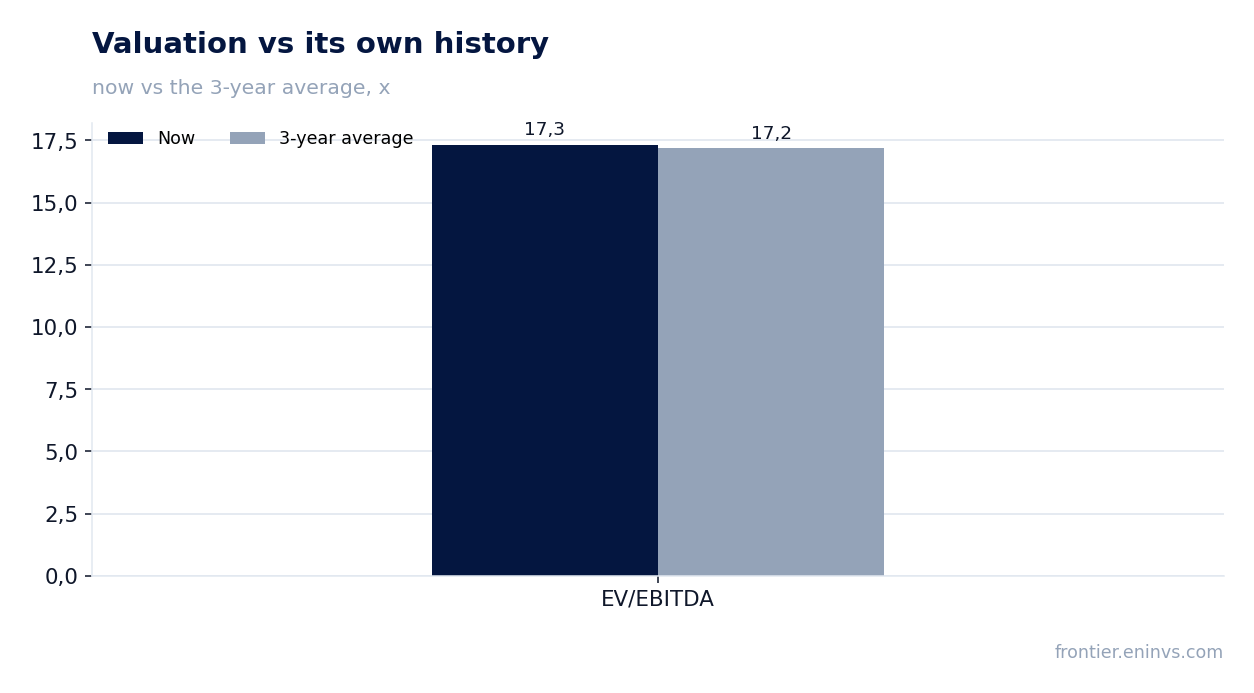
— Shares rose 15.4% since the release, but the 17.3 EV/EBITDA multiple is only slightly above its three-year average
Attractiveness
Key figures, USD bn
| Metric | Q2 2025 | Q2 2026 | Change |
|---|---|---|---|
| Revenue | 9.18 | 10.1 | +9.5% |
| EBITDA | 4.00 | 4.63 | +15.7% |
| Operating profit | 2.66 | 3.51 | +32.3% |
| Net profit | 1.43 | 2.38 | +65.9% |
| Operating cash flow | 2.28 | 4.00 | +75.4% |
| Capex | 0.37 | 0.51 | +39.0% |
| EBITDA margin | 43.5% | 46.0% | +2.5 pp |
| Net margin | 15.6% | 23.6% | +8.0 pp |
Revenue in Q2 grew 9.5% to $10,054 million, with six key growth drivers up 26%
In Q2 2026, AMGEN INC's total revenue reached $10,054 million, up 9.5% year over year. Growth was driven by product sales, which rose 9% on volume. The six key growth drivers – Repatha, EVENITY, TEPEZZA, UPLIZNA, TEZSPIRE, and BLINCYTO – grew 26% year over year and generated nearly 70% of product sales in the quarter.
Among individual products, UPLIZNA (+90% to $335 million), PAVBLU (+121% to $287 million), and IMDELLTRA (+115% to $288 million) showed particularly strong growth. Meanwhile, Prolia and XGEVA declined 32% and 34%, respectively, due to biosimilar competition, partially offsetting the overall positive momentum.
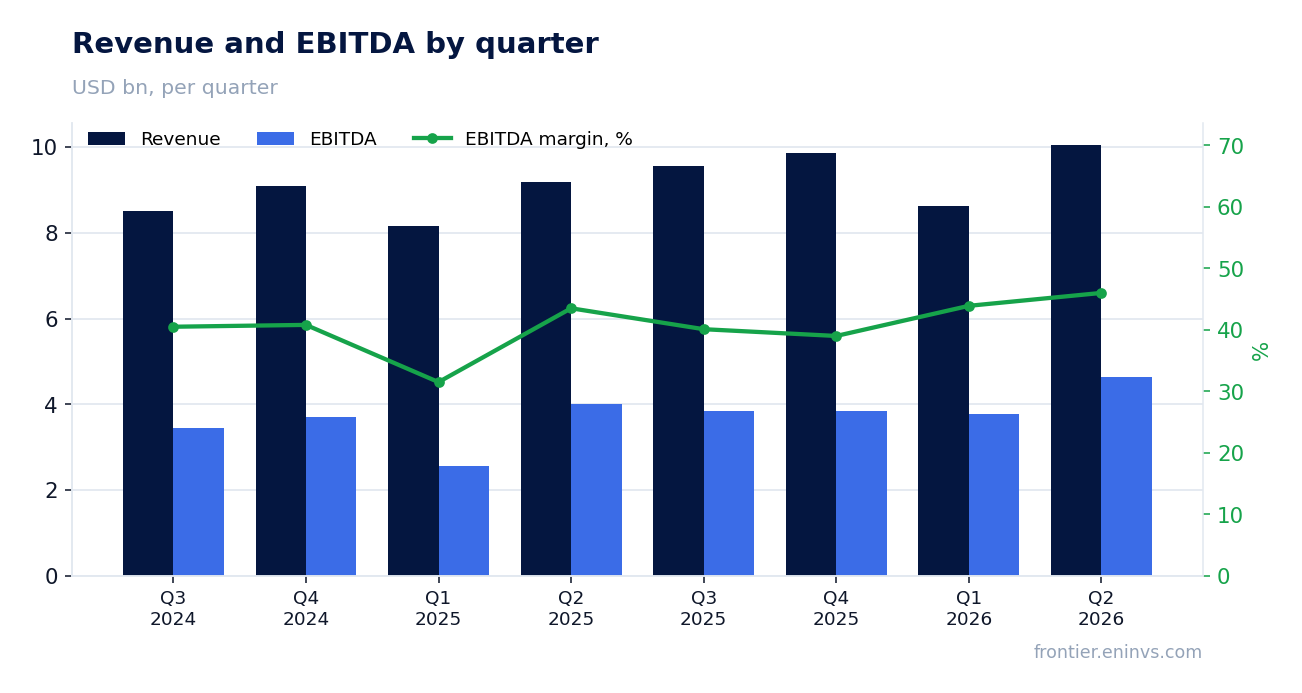
EBITDA margin expanded 2.5 pp to 46.0% on lower cost of sales, down 4.8 pp as a percentage of product sales
EBITDA in Q2 rose 15.7% to $4,626 million, and the EBITDA margin expanded from 43.5% to 46.0%. The main contributor was lower cost of sales: on a GAAP basis, it fell 4.8 percentage points as a percentage of product sales to 29.5%, driven by lower amortization of acquisition-related assets.
GAAP operating income increased from $2,656 million to $3,514 million, and the operating margin rose 6.5 pp to 36.8%. On a non-GAAP basis, operating margin declined 0.5 pp to 48.4%, reflecting higher R&D and SG&A expenses.
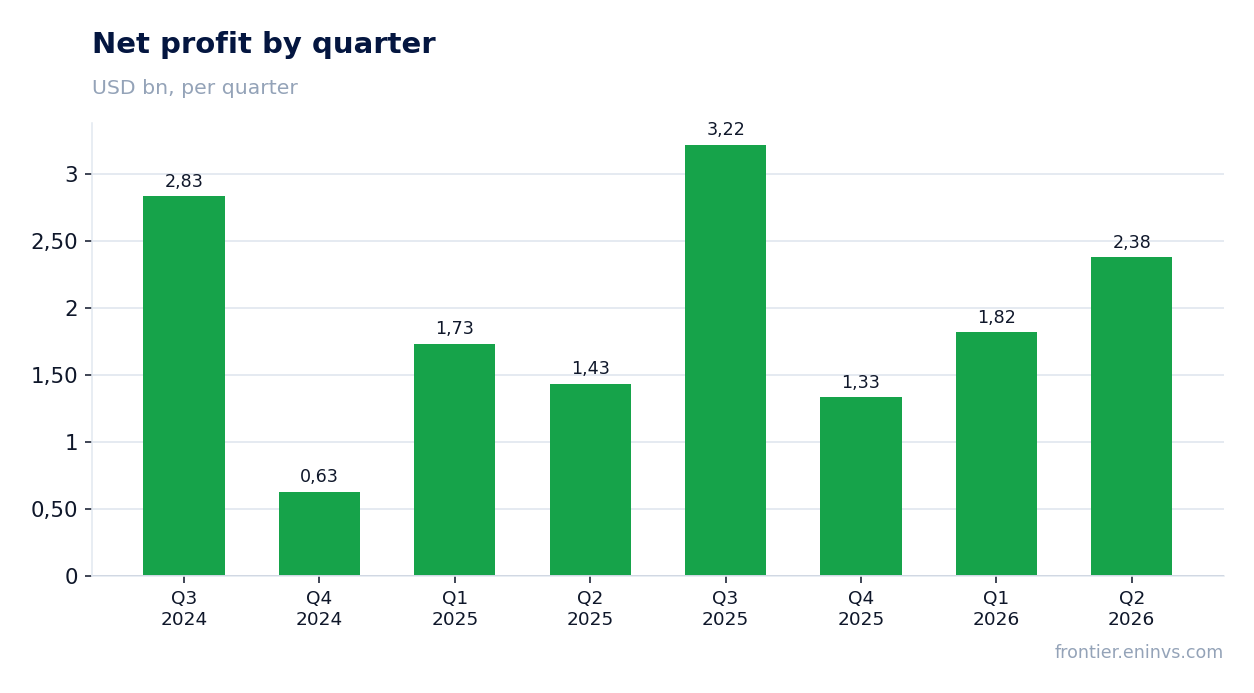
Net profit jumped 65.9% to $2,375 million on higher revenue and operating margin
Net profit in Q2 was $2,375 million versus $1,432 million a year earlier. The 65.9% increase is primarily explained by higher revenue and operating income, as well as a lower effective tax rate – it rose 5.5 pp to 14.2% but remains low.
Net margin for the quarter reached 23.6% versus 15.6% in Q2 2025. One-off items, such as litigation expenses included in other operating expenses, had a limited impact.
Operating cash flow for the quarter was $4,000 million, free cash flow $3,500 million, double the year-ago level
In Q2 2026, operating cash flow reached $4,000 million, and free cash flow was $3,500 million, more than double the year-ago level of $1,900 million. The improvement reflects the final repatriation tax payment in Q2 2025 and current business performance, partially offset by working capital timing.
Capital expenditures for the quarter were $513 million, up from $369 million a year earlier, but broadly in line with the full-year guidance of approximately $2.6 billion. Dividends paid in the quarter were $1.4 billion, exceeding free cash flow, but the company holds a significant cash balance ($14.0 billion) and has access to debt markets.
Net debt declined by $2.0 billion from the prior reporting date to $46,306 million
As of June 30, 2026, AMGEN INC's net debt stood at $46,306 million, down $2.0 billion from the prior reporting date (end of Q1 2026). Over the trailing twelve months, net debt decreased by $4.9 billion. The ratio of net debt to EBITDA for the last twelve months is 2.85.
Cash and cash equivalents rose to $14.0 billion from $9.1 billion at the end of 2025, while total debt increased to $57.3 billion from $54.6 billion. The company continues to generate sufficient cash flow to service debt and pay dividends.
The company reaffirmed its 2026 guidance: revenue $38.2–39.4 billion, capex approximately $2.6 billion
AMGEN INC reaffirmed its full-year 2026 guidance: total revenue expected in the range of $38.2–39.4 billion, capital expenditures of approximately $2.6 billion, and share repurchases not to exceed $3.0 billion. On a GAAP basis, EPS is projected at $15.80–17.08; on a non-GAAP basis, $22.30–23.50.
Management expressed confidence in the company's ability to deliver growth 'well into the next decade' through label expansions of existing medicines and advancing pipeline molecules through Phase 3. Key programs include MariTide for obesity, olpasiran for lipoprotein(a) reduction, and several oncology assets.
Shares rose 15.4% since the release, but the 17.3 EV/EBITDA multiple is only slightly above its three-year average
AMGEN INC's share price before the release was $378.87; on the release day, shares rose 2.9%, and by September 4, 2026, they had gained another 15.4%. Market capitalization reached $235,579.5 million.
The EV/EBITDA multiple for the last twelve months is 17.33, only slightly above the three-year average of 17.18. P/E LTM is 26.94. According to the portal's model, the upside to fair value is +16%.
Valuation on the latest reported figures
| Metric | Value |
|---|---|
| Market cap | 236 bn USD |
| P/E (LTM) | 26.9 |
| EV/EBITDA (LTM) | 17.3 |
| P/B | 27.21 |
| Net debt / EBITDA (LTM) | 2.85 |
| Operating cash flow (LTM) | 10.0 bn |
| ROE | 91.0% |
| Dividend yield (12m) | 2.5% |
| EV/EBITDA, 3-year average | 17.2 |
Bottom line
The Q2 2026 report was strong: revenue and EBITDA grew at double-digit rates, margins expanded, and free cash flow doubled. The 65.9% profit growth is largely due to a low base from the prior year, when one-off tax payments weighed on results. The company reaffirmed its full-year guidance, indicating trend sustainability. The shares look rather attractive: the valuation is close to its historical average, and the portal's model shows +16% upside. The key question is whether AMGEN INC can offset biosimilar losses with new products and sustain growth momentum into next year.
Open the company's financial profile AMGN →
See also: market overview · valuation map · stock screeners