AMAZON COM INC: AWS accelerated to 37%, but 85% of quarterly profit is a paper gain from Anthropic
30 июля 2026 года AMAZON COM INC раскрыла результаты за второй квартал 2026 года. Выручка выросла на 19,6% год к году до 200,6 млрд долларов, операционная прибыль – на 43% до 27,5 млрд, а чистая прибыль – в 3,4 раза до 62,6 млрд, но почти всю её обеспечила бумажная переоценка инвестиций в Anthropic на 53,4 млрд долларов. На текущей цене акция выглядит скорее привлекательно: AWS растёт рекордными темпами, маржа расширяется, а мультипликатор EV/EBITDA ниже собственного трёхлетнего среднего.
Key takeaways
— AWS accelerated to 37% – its fastest growth in 18 quarters – and contributed 60% of operating income
— Net profit tripled, but $53.4 billion of the $62.6 billion is a paper gain from Anthropic
— Operating margin hit 13.7% – a record in recent years – driven by AWS and retail scale
— Free cash flow turned negative at $7.6 billion over twelve months due to AI investments
— Leverage remains low: net debt / EBITDA at 0.49
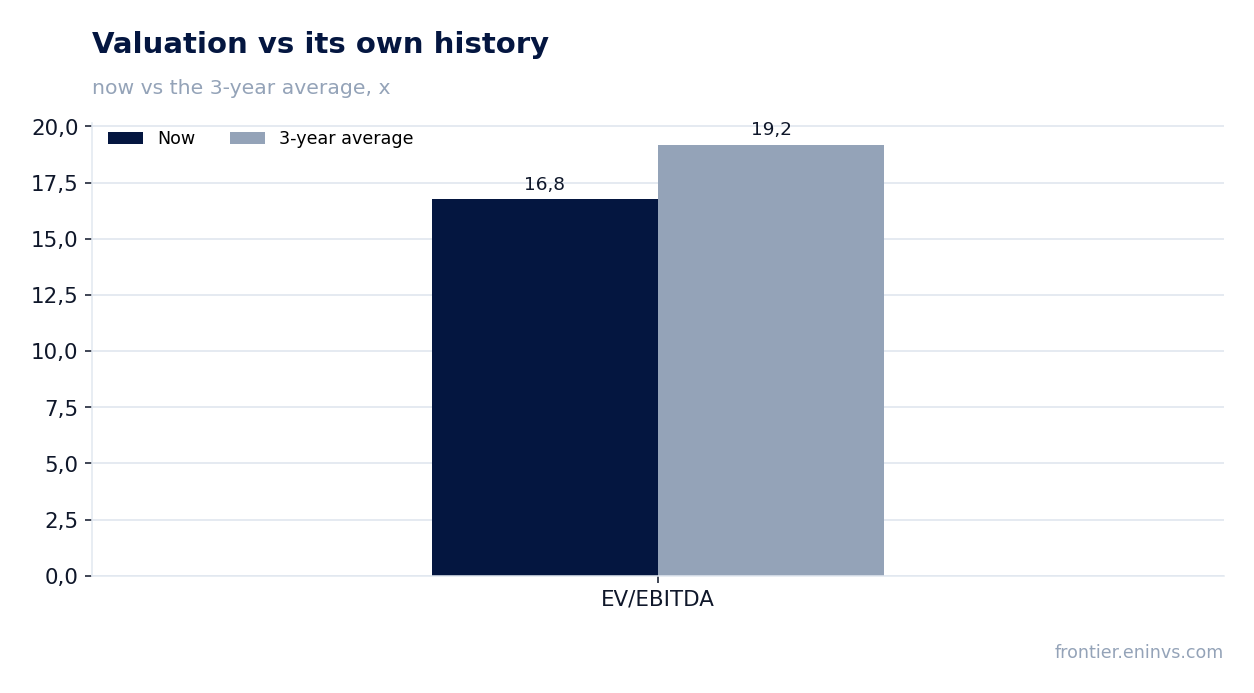
— The stock trades at 16.8 EV/EBITDA versus its three-year average of 19.2 – cheaper than its own history
— The portal's model implies 22% upside for the share
Attractiveness
Key figures, USD bn
| Metric | Q2 2025 | Q2 2026 | Change |
|---|---|---|---|
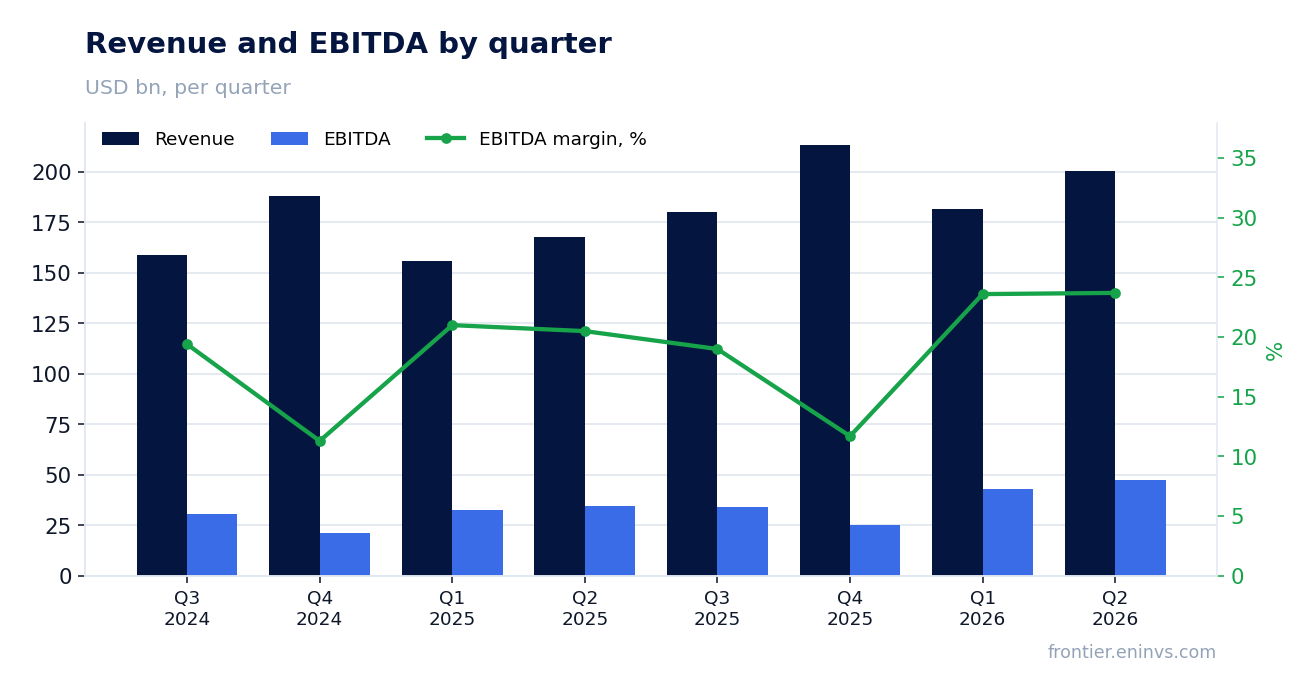
| Revenue | 168 | 201 | +19.6% |
| EBITDA | 34.4 | 47.4 | +37.9% |
| Operating profit | 19.2 | 27.5 | +43.2% |
| Net profit | 18.2 | 62.6 | +244.9% |
| Operating cash flow | 32.5 | 45.4 | +39.6% |
| Capex | 32.2 | 54.2 | +68.4% |
| EBITDA margin | 20.5% | 23.7% | +3.2 pp |
| Net margin | 10.8% | 31.2% | +20.4 pp |
AWS accelerated to 37% – its fastest growth in 18 quarters – and contributed 60% of operating income
In Q2 2026, AWS revenue grew 37% year-over-year to $42.2 billion – its fastest pace in 18 quarters. The segment reached an annualized run rate of $169 billion. Growth is fueled by artificial intelligence: the AWS AI business and the chips business each surpassed a $25 billion annual run rate, growing triple-digit percentages.
AWS operating income jumped 64% to $16.6 billion, and the segment margin returned to 39.4% – the highest in the last four quarters. AWS now contributes 60% of total operating income, despite being only 21% of revenue. The cloud is driving both growth and profitability for the entire group.
Net profit tripled, but $53.4 billion of the $62.6 billion is a paper gain from Anthropic
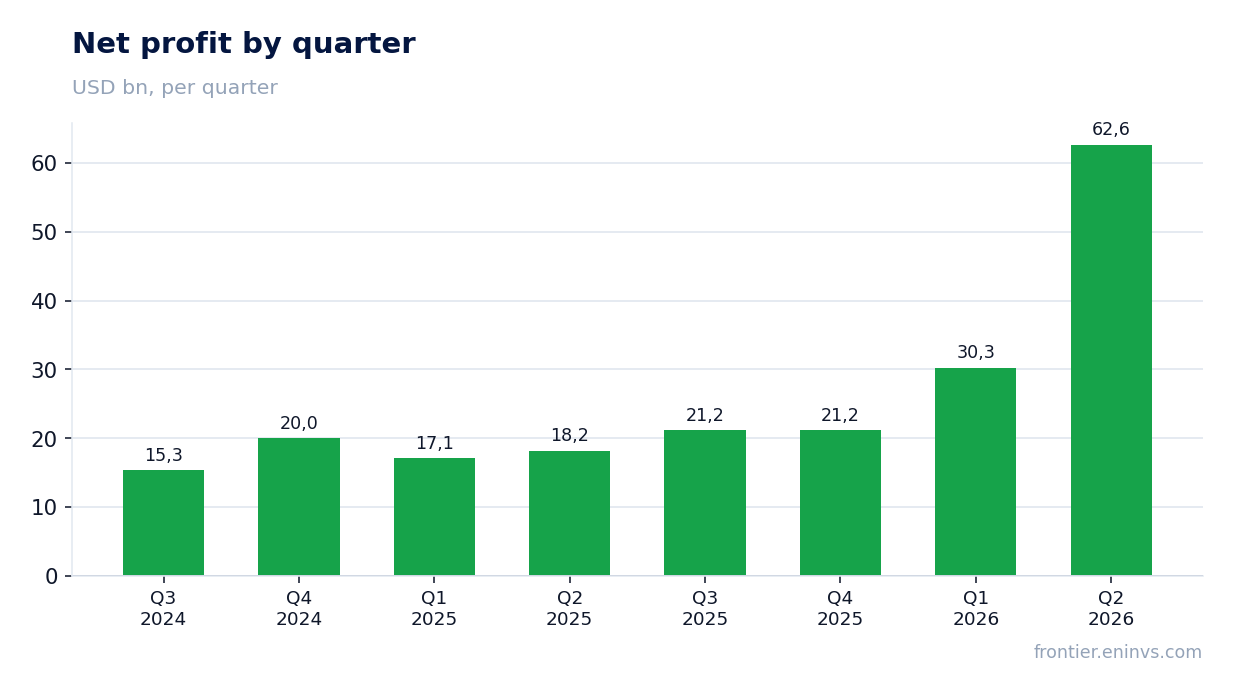
Net income for Q2 2026 was $62.6 billion versus $18.2 billion a year earlier. However, the report explicitly states that $53.4 billion is non-operating income from revaluation of investments in Anthropic. Without this paper effect, profit would have been around $9.2 billion – below last year's level.
Nevertheless, operating performance is strong: operating income grew 43% to $27.5 billion. Investors should focus on operating metrics rather than net income distorted by one-off items.
Operating margin hit 13.7% – a record in recent years – driven by AWS and retail scale
Operating margin in Q2 2026 was 13.7% versus 11.4% a year earlier. This is the best figure in recent years. Growth was driven by AWS with a 39.4% margin and improvement in North America, where operating margin reached 7.9%.
The International segment also reached a margin of 4.1% – double the year-ago level. Scale effects in logistics and advertising growth (26% year-over-year) support profitability even amid heavy investments.
Free cash flow turned negative at $7.6 billion over twelve months due to AI investments
For the trailing twelve months through June 2026, free cash flow was negative $7.6 billion versus positive $18.2 billion a year earlier. The reason is a $66.1 billion increase in capital expenditures, mostly for AI infrastructure. Operating cash flow, meanwhile, grew 33% to $161.4 billion.
Capex in the quarter reached $54.2 billion – nearly double the year-ago level. The company is deliberately sacrificing free cash flow for AI leadership, and so far the market accepts it: AWS is growing at record rates.
Leverage remains low: net debt / EBITDA at 0.49
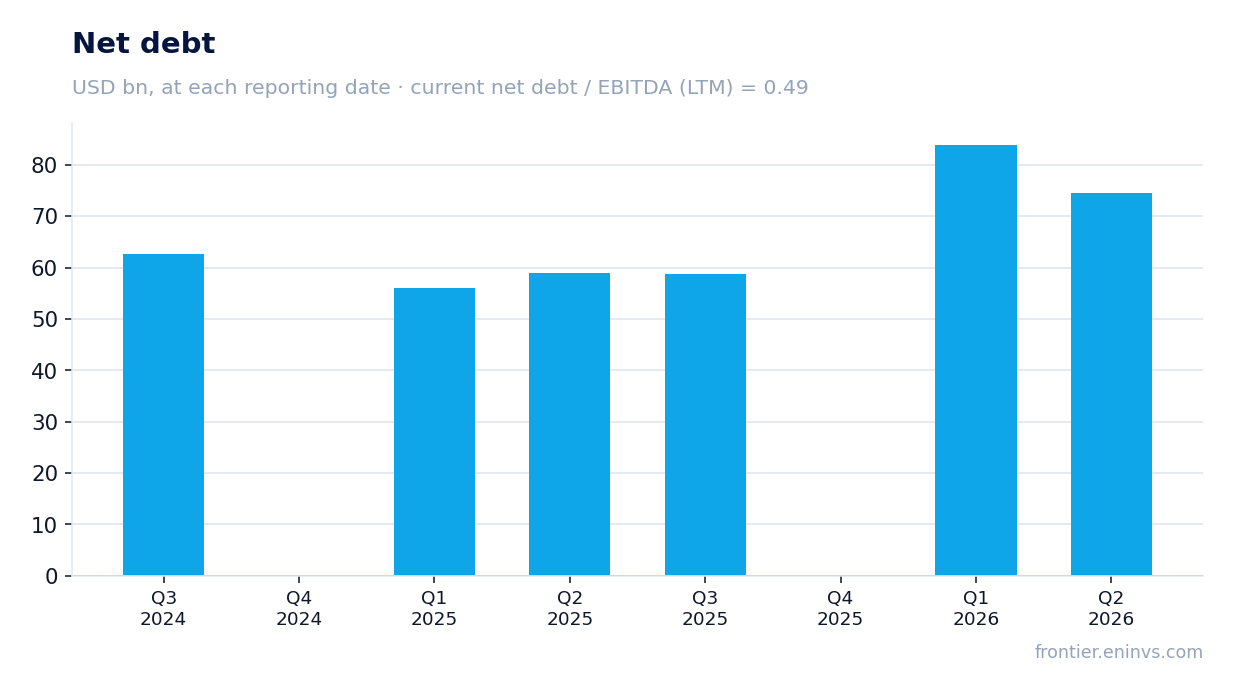
Net debt at the end of Q2 2026 was $83.6 billion, and the ratio of net debt to EBITDA for the trailing twelve months was 0.49. This is a comfortable level for a company with such cash flow.
During the quarter, net debt decreased by $9.4 billion, although over twelve months it increased by $15.6 billion – the company actively raised long-term funds to finance capex. Nevertheless, leverage remains moderate.
The stock trades at 16.8 EV/EBITDA versus its three-year average of 19.2 – cheaper than its own history
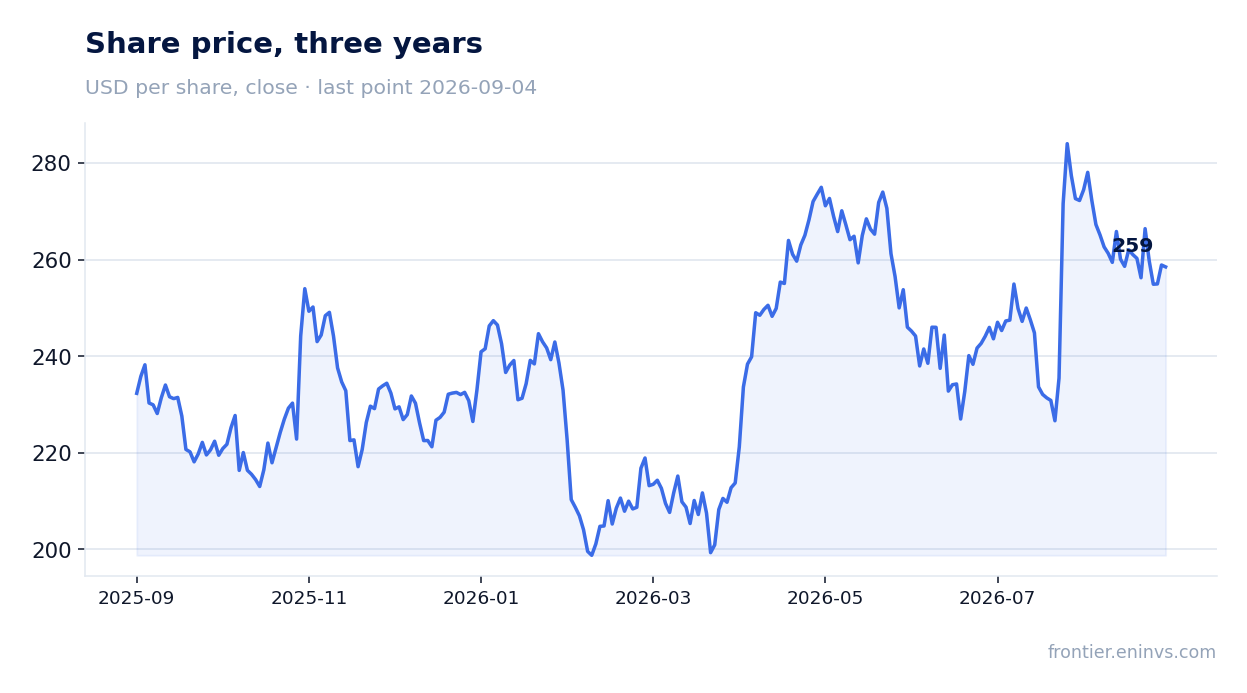
After the report, the stock rose 3.9% on the release day and another 14.1% by September 4, 2026. The current EV/EBITDA multiple is 16.8 – below the three-year average of 19.2. P/E LTM is 20.4.
Given AWS growth acceleration and margin expansion, the discount to its own history seems unwarranted. The portal's model implies 22% upside to fair value.
The portal's model implies 22% upside for the share
According to the portal's model, which multiplies EBITDA growth by a target multiple and compares with market cap, the upside for the share is 22%. This is the portal's own estimate, not a market consensus.
The share is held in the 'US GARP' and 'US Acceleration' strategies on the portal. This is a fact of membership, not an argument for the verdict.
Valuation on the latest reported figures
| Metric | Value |
|---|---|
| Market cap | 2 757 bn USD |
| P/E (LTM) | 20.4 |
| EV/EBITDA (LTM) | 16.8 |
| P/B | 6.71 |
| Net debt / EBITDA (LTM) | 0.49 |
| Operating cash flow (LTM) | 140 bn |
| ROE | 50.4% |
| EV/EBITDA, 3-year average | 19.2 |
Bottom line
The report is strong: AWS accelerated to 37%, operating margin hit a record 13.7%, and leverage remains low. However, net profit is 85% a paper gain from Anthropic, and free cash flow turned negative due to aggressive AI investments. The stock trades below its own three-year multiple, and the portal's model implies 22% upside. The question for holders is whether capex will pay off in AWS – and so far the answer looks affirmative. Verdict: rather attractive.
Open the company's financial profile AMZN →
See also: market overview · valuation map · stock screeners