Arista Networks, Inc.: first $3+ billion quarter, but shares trade at 54x EBITDA

On August 4, Arista Networks, Inc. reported Q2 2026 results: revenue grew 37.7% to $3,035.7 million, EBITDA by 40.3%, net profit by 36.5%. The company crossed the $3 billion quarterly revenue mark for the first time, but at the current market cap of $254,030 million, the shares look expensive: EV/EBITDA is 54.3x versus the three-year average of 39.8x. Verdict – 'neutral': strong growth and margins do not justify the premium to its own history.
Key takeaways
— Revenue exceeded $3 billion for the first time in a quarter, growth accelerated to 37.7%
— EBITDA margin expanded to 46.2% thanks to operating leverage
— Net profit grew 36.5%, but margin slightly declined due to taxes
— Operating cash flow increased, but capex almost doubled
— The company maintains a net cash position, leverage is minimal
— Shares trade at a 36% premium to their own three-year valuation
Attractiveness
Key figures, USD bn
| Metric | Q2 2025 | Q2 2026 | Change |
|---|---|---|---|
| Revenue | 2.20 | 3.04 | +37.7% |
| EBITDA | 1.00 | 1.40 | +40.3% |
| Operating profit | 0.99 | 1.38 | +39.7% |
| Net profit | 0.89 | 1.21 | +36.5% |
| Operating cash flow | 1.20 | 1.08 | -9.8% |
| Capex | 0.02 | 0.03 | +23.8% |
| EBITDA margin | 45.3% | 46.2% | +0.9 pp |
| Net margin | 40.3% | 40.0% | -0.3 pp |
Revenue exceeded $3 billion for the first time in a quarter, growth accelerated to 37.7%
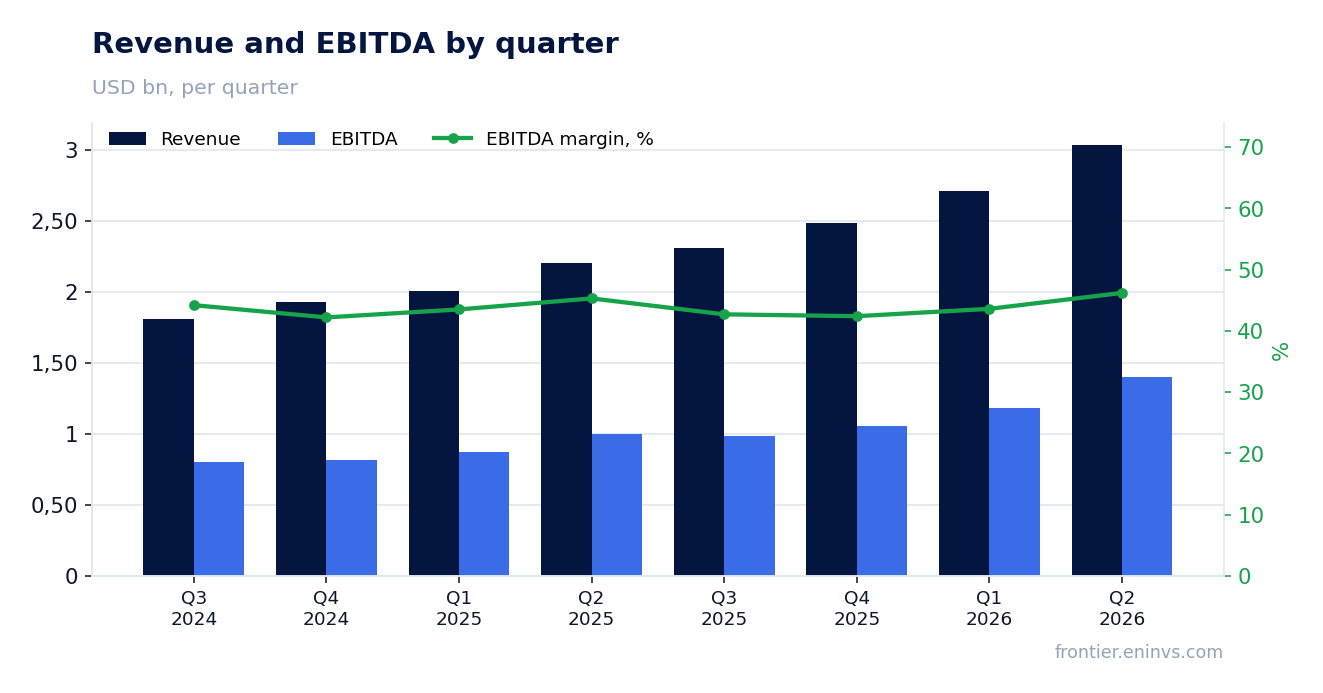
In Q2 2026, Arista Networks, Inc. reported revenue of $3,035.7 million, up 37.7% year-over-year. This is the company's first quarter with revenue above $3 billion. Growth accelerated compared to previous quarters: Q1 2026 was 35.1%, Q4 2025 – 28.9%.
Product revenue contributed the most – $2,605.2 million (up approximately 38.8% year-over-year), while service revenue reached $430.5 million (+31.3%). The company attributes the dynamics to the success of its Arista 2.0 platform strategy and growing demand for networking infrastructure for AI data centers.
EBITDA margin expanded to 46.2% thanks to operating leverage
EBITDA in Q2 2026 grew by 40.3% to $1,401.4 million, and the EBITDA margin reached 46.2% versus 45.3% a year earlier. Operating profit increased to $1,378.0 million (+39.7% YoY), with GAAP operating margin at 45.4% versus 44.7% in Q2 2025.
The margin expansion was driven by revenue growing faster than operating expenses: sales, general and administrative expenses grew less than revenue. The company also noted non-GAAP operating margin rising to 49.9% from 48.8% a year earlier.
Net profit grew 36.5%, but margin slightly declined due to taxes
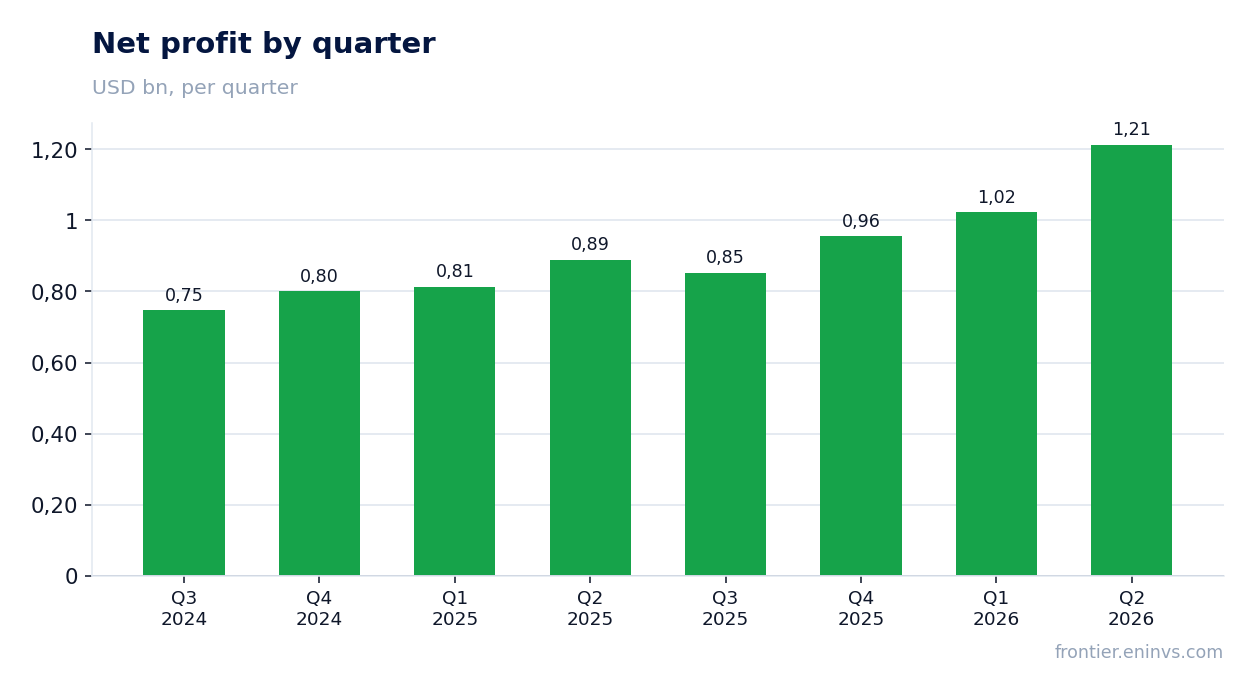
Net profit for Q2 2026 was $1,212.9 million, up 36.5% year-over-year. Net margin declined to 40.0% from 40.3% in Q2 2025. The reason is a higher effective tax rate: income tax expense rose to $291.4 million from $191.4 million a year earlier, implying an effective rate of about 19.4% versus 17.7%.
Expenses include non-cash items: stock-based compensation of $120.4 million and intangible asset amortization of $15.3 million. Excluding these, non-GAAP net profit would have been $1,301.7 million, and non-GAAP diluted EPS – $1.02 versus $0.73 a year earlier (+39.7%).
Operating cash flow increased, but capex almost doubled
Operating cash flow in Q2 2026 was $1,083.0 million versus $1,200.1 million a year earlier – a decrease of 9.7%. For H1 2026, OCF rose to $2,776.5 million from $1,841.8 million in the same period of 2025 (+50.8%).
Capital expenditures in Q2 were $29.7 million versus $24.0 million a year earlier (+23.8%). For the half-year, capex increased to $84.2 million from $52.4 million (+60.7%). The company is increasing investments in equipment, but they remain insignificant relative to the scale of the business.
The company maintains a net cash position, leverage is minimal
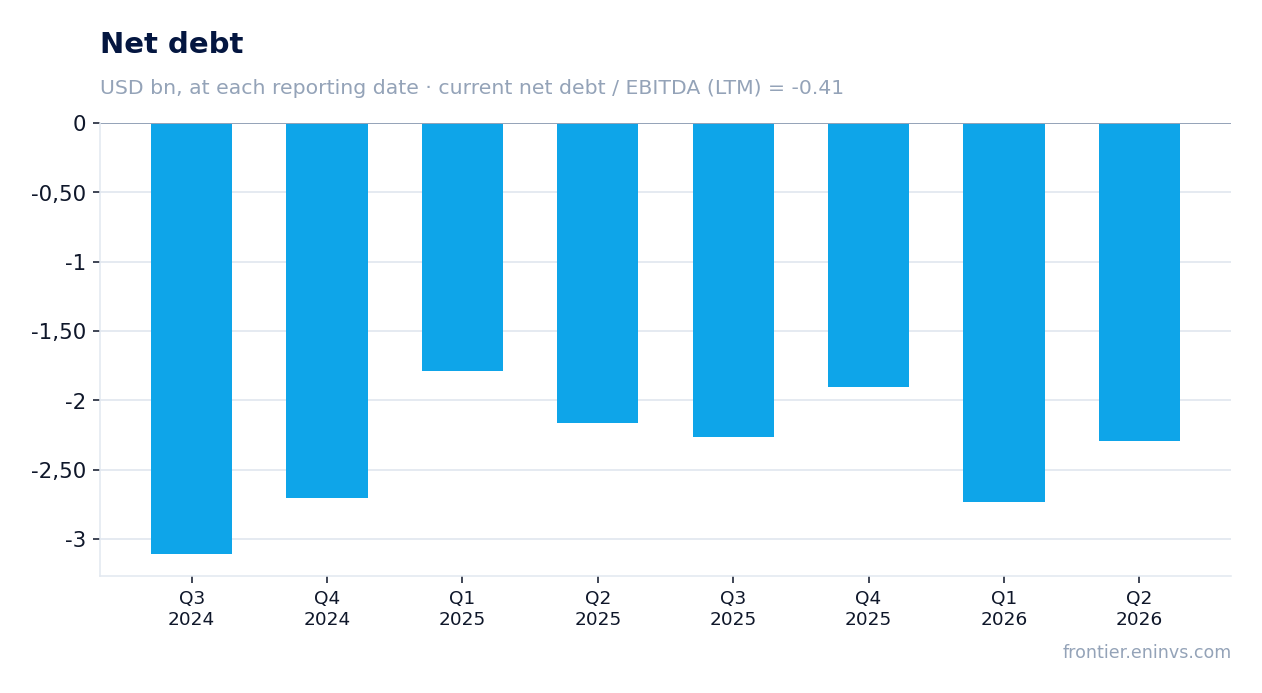
At the end of Q2 2026, Arista Networks, Inc. had a net cash position of $2,290.2 million (cash and equivalents) plus $11,053.1 million in marketable securities. Net debt is negative: -$2,290.2 million (excluding marketable securities). Net debt to EBITDA for the trailing twelve months is -0.41.
During the quarter, the net cash position decreased by $0.4 billion, and over the year by $0.1 billion. The company does not take on debt and continues to generate significant free cash flow, which it invests in marketable securities.
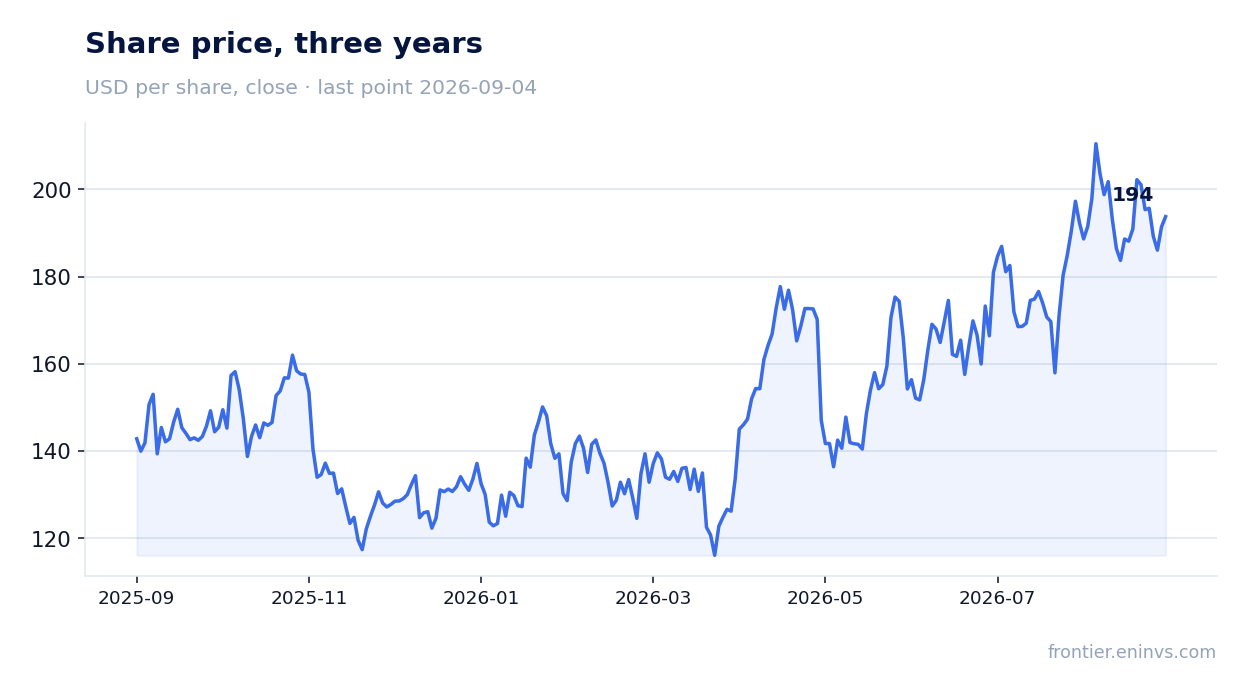
Shares trade at a 36% premium to their own three-year valuation
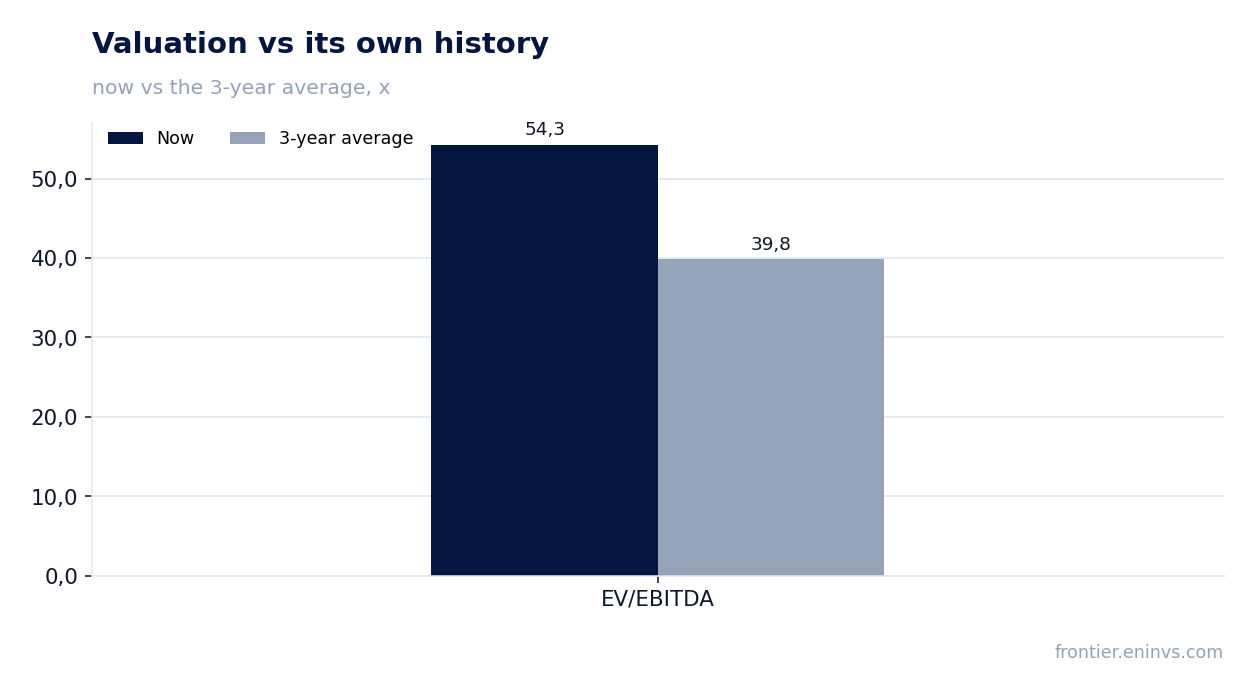
The current EV/EBITDA multiple is 54.3x versus the three-year average of 39.8x. This means the market values the company 36% higher than its average over the past three years. P/E for the trailing twelve months is 62.8x.
According to the portal's model, the upside to fair value is +11%. However, even with this potential, the valuation remains high: to justify the current multiple, the company would need to sustain EBITDA growth of around 40% for an extended period.
Valuation on the latest reported figures
| Metric | Value |
|---|---|
| Market cap | 254 bn USD |
| P/E (LTM) | 62.8 |
| EV/EBITDA (LTM) | 54.3 |
| P/B | 20.54 |
| Net debt / EBITDA (LTM) | -0.41 |
| Operating cash flow (LTM) | 4.40 bn |
| ROE | 34.3% |
| EV/EBITDA, 3-year average | 39.8 |
Bottom line
Arista Networks, Inc. delivered a strong quarter: revenue exceeded $3 billion for the first time, growth accelerated to 37.7%, and EBITDA margin expanded to 46.2%. The company maintains a net cash position and generates robust operating cash flow. However, shares trade at a 36% premium to their own three-year valuation, and even the portal's model implies only +11% upside. At this level, the valuation already reflects continued high growth, and any sign of slowdown could trigger a correction. Verdict – 'neutral': a strong business, but the price already embeds many expectations.
Open the company's financial profile ANET →
See also: market overview · valuation map · stock screeners