ASML: revenue up 21.3%, but quarterly cash flow turned negative — sustainability in question
25 августа ASML раскрыла результаты за второй квартал 2026 года: выручка выросла на 21,3% год к году до 9 326,5 млн евро, чистая прибыль — на 27,4% до 2 917,6 млн. При этом операционный денежный поток за квартал оказался отрицательным, а долговая нагрузка остаётся низкой. На текущей цене акция выглядит скорее привлекательно: мультипликаторы высоки, но модель портала даёт потенциал +8%.
Key takeaways
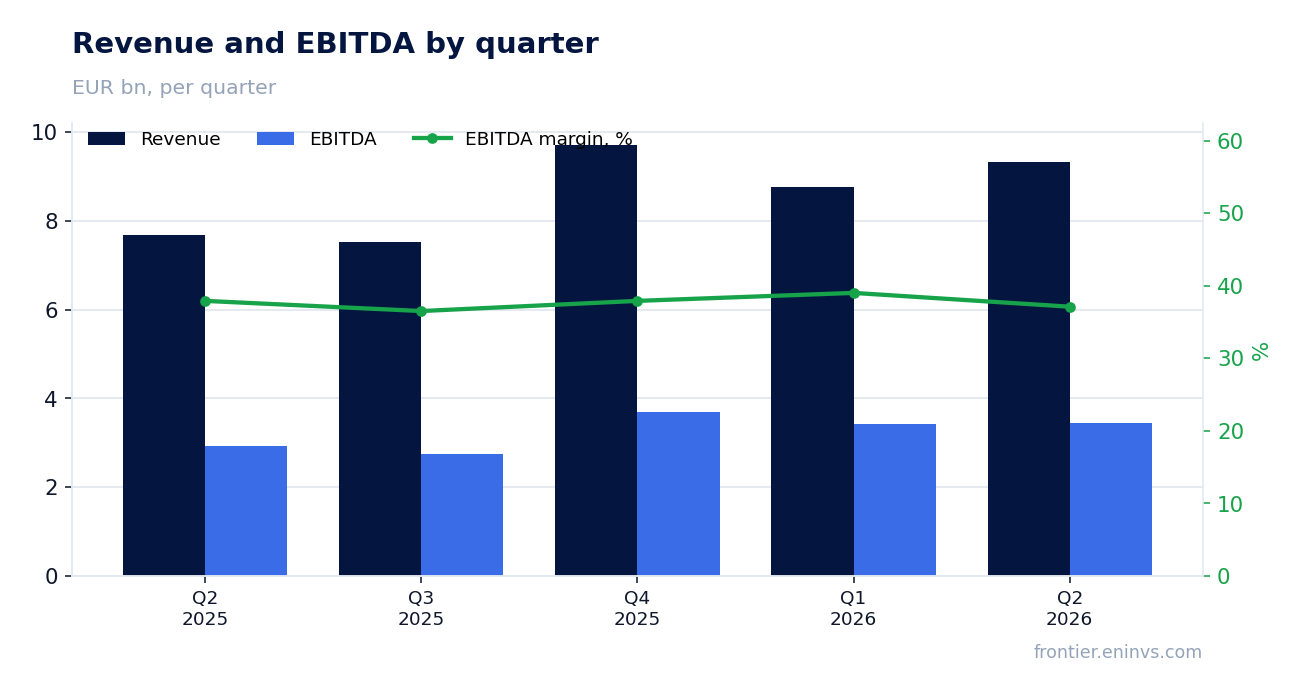
— Выручка Q2 2026 выросла на 21,3% год к году, до 9 326,5 млн евро
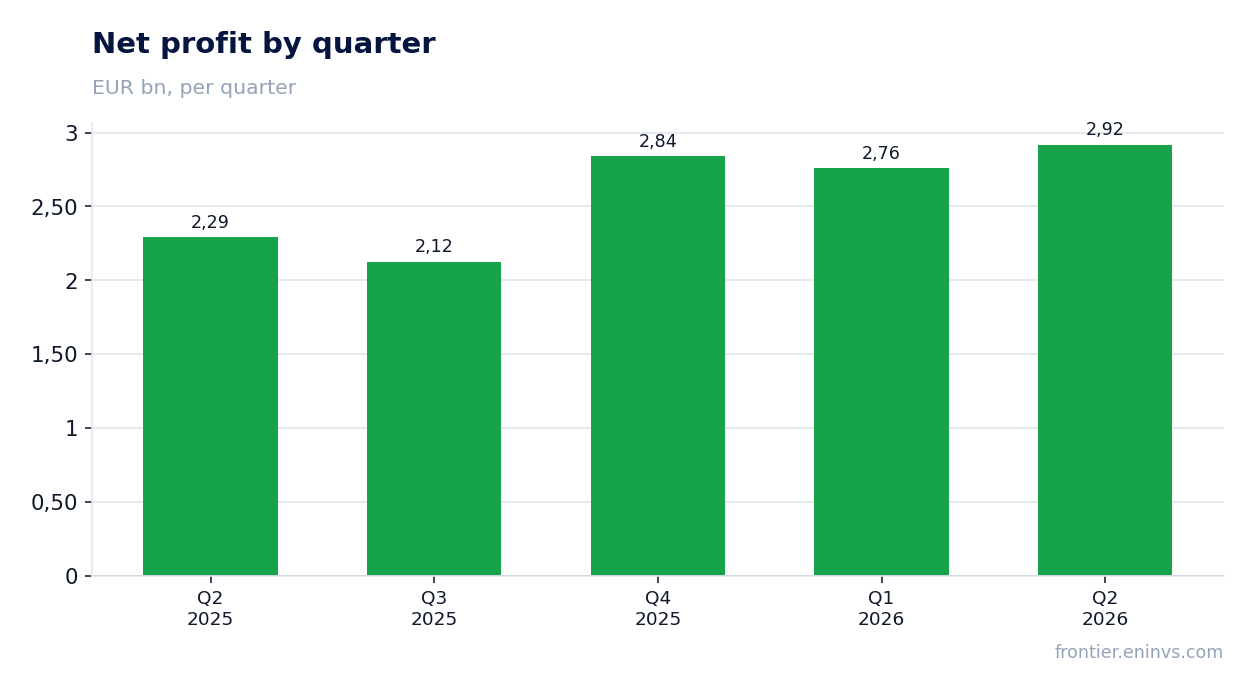
— Чистая прибыль Q2 2026 увеличилась на 27,4% до 2 917,6 млн евро, опережая выручку
— EBITDA-маржа снизилась с 37,9% до 37,1% за квартал
— Операционный денежный поток за квартал ушёл в минус, несмотря на прибыль
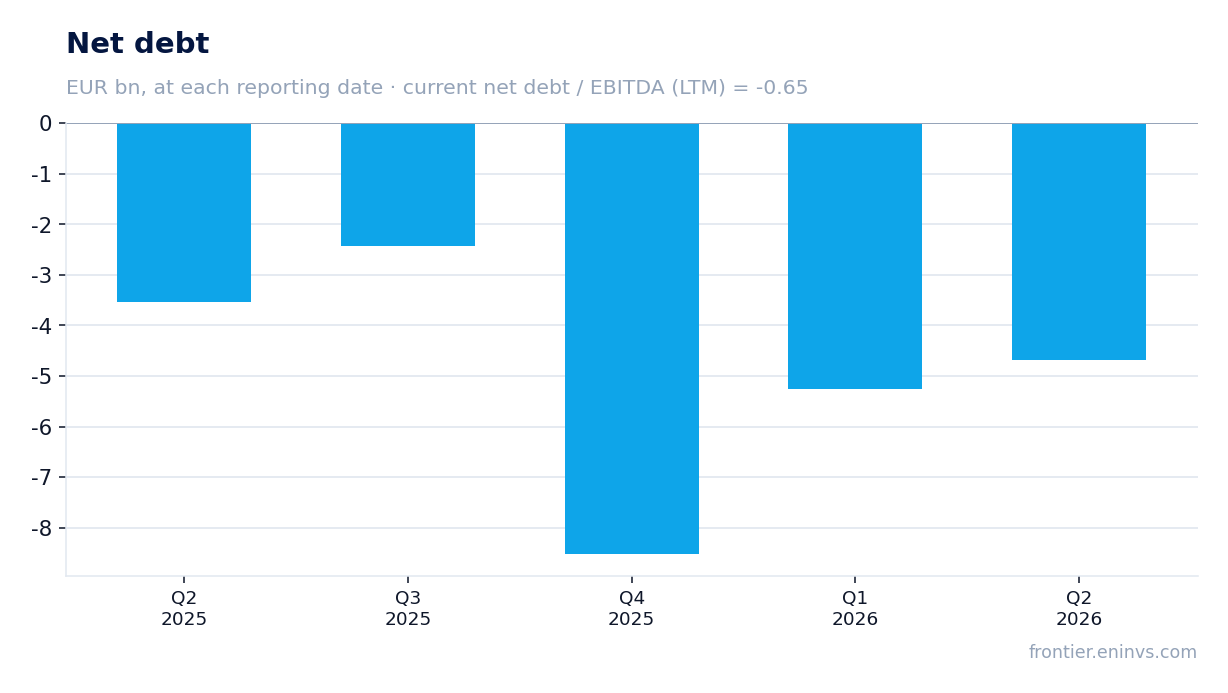
— Чистый долг отрицательный: компания держит больше денег, чем долга
— Оценка: P/E LTM 54,8, EV/EBITDA LTM 43,5 — выше собственной истории
Attractiveness
Key figures, EUR bn
| Metric | Q2 2025 | Q2 2026 | Change |
|---|---|---|---|
| Revenue | 7.69 | 9.33 | +21.3% |
| EBITDA | 2.92 | 3.46 | +18.4% |
| Operating profit | 2.66 | 3.46 | +29.7% |
| Net profit | 2.29 | 2.92 | +27.4% |
| Operating cash flow | 0.75 | — | — |
| Capex | -0.43 | — | — |
| EBITDA margin | 37.9% | 37.1% | -0.8 pp |
| Net margin | 29.8% | 31.3% | +1.5 pp |
Q2 2026 revenue up 21.3% YoY to EUR 9,326.5 million
In Q2 2026, ASML reported revenue of EUR 9,326.5 million, up 21.3% from the same quarter a year earlier. Growth accelerated compared to previous quarters: Q1 2026 revenue was EUR 8,766.9 million, Q4 2025 – EUR 9,718.1 million. The company continues to increase sales of lithography equipment despite cyclical fluctuations in the semiconductor industry.
Over the trailing twelve months, revenue reached EUR 35,300.0 million, confirming a steady upward trend. The main driver remains demand for advanced EUV systems, although the report does not break down sales by equipment type. Nevertheless, growth rates are above the average of recent years, indicating a strong market position.
Q2 2026 net profit up 27.4% to EUR 2,917.6 million, outpacing revenue
Net profit for Q2 2026 amounted to EUR 2,917.6 million, up 27.4% from a year earlier. Profit growth outpaced revenue growth, indicating improved operational efficiency or one-off income. Operating profit for the quarter reached EUR 3,456.1 million, matching EBITDA, as depreciation was negligible in this quarter.
Over the trailing twelve months, net profit reached EUR 10,638.4 million and EBITDA – EUR 13,214.3 million. Net margin for the quarter rose from 29.8% to 31.3%, showing the company's ability to convert revenue into profit faster than costs grow. However, it is important to check whether this growth is due to one-off factors such as tax benefits or asset sales.
EBITDA margin declined from 37.9% to 37.1% in the quarter
EBITDA for Q2 2026 amounted to EUR 3,456.1 million, up 18.4% from a year earlier. However, EBITDA margin declined from 37.9% to 37.1% in the quarter. This means costs are growing slightly faster than revenue, possibly due to increased R&D or personnel expenses.
The margin decline is modest, but it indicates some pressure on profitability. Over the trailing twelve months, EBITDA reached EUR 13,214.3 million, providing a safety cushion for investments. Nevertheless, if the trend continues, it could limit profit growth in the future.
Operating cash flow turned negative in the quarter despite profit
Unlike profit, operating cash flow for Q2 2026 turned negative, although the exact figure was not disclosed. In the previous quarter, OCF was minus EUR 2,185.6 million, and in Q4 2025 – plus EUR 11,410.3 million. Such volatility is typical for companies with large contracts and advance payments.
Over the trailing twelve months, operating cash flow reached EUR 12,700.0 million, exceeding net profit. This indicates that on average the company generates sufficient cash, but quarterly fluctuations can be significant. Capital expenditures for the quarter were not disclosed, but over the last four quarters they totaled about EUR 1,637 million, below operating cash flow.
Net debt is negative: the company holds more cash than debt
At the end of Q2 2026, ASML's net debt stood at minus EUR 4,687.5 million, meaning cash exceeds debt. Compared to the previous quarter (minus EUR 5,264.8 million), the debt position slightly worsened, but improved over the year: a year ago net debt was minus EUR 3,544.6 million. The company retains financial flexibility.
The net debt to EBITDA ratio over the trailing twelve months is -0.65, indicating a net cash position. This allows the company to finance investments and dividends without resorting to debt. However, the report does not disclose the dynamics of this metric, so we cannot speak of improvement or deterioration.
Valuation: P/E LTM 54.8, EV/EBITDA LTM 43.5 — above its own history
Based on the trailing twelve months, ASML's market capitalization is EUR 583,063.8 million, giving P/E LTM of 54.8 and EV/EBITDA LTM of 43.5. These multiples are significantly above the three-year average, although the facts do not provide exact comparison values. The stock trades at a premium to its own history, reflecting expectations of further growth.
Dividend yield over the trailing twelve months is only 0.51%, below the market average, but acceptable for a growing company. According to the portal's model, the stock's upside potential is +8% to fair value. This is a moderate upside that does not justify the current premium but does not indicate overvaluation either.
Valuation on the latest reported figures
| Metric | Value |
|---|---|
| Market cap | 583 bn EUR |
| P/E (LTM) | 54.8 |
| EV/EBITDA (LTM) | 43.5 |
| P/B | 29.73 |
| Net debt / EBITDA (LTM) | -0.65 |
| Operating cash flow (LTM) | 12.7 bn |
| ROE | 54.7% |
| Dividend yield (12m) | 0.5% |
Bottom line
ASML delivered a strong quarter: revenue grew 21.3%, net profit 27.4%, and net margin improved. However, EBITDA margin slightly declined, and operating cash flow turned negative in the quarter, which requires attention. The company maintains a net cash position, providing financial flexibility. At the current price, the share looks rather attractive: the portal's model gives +8% upside, but multiples are high. To confirm the verdict, we need to see cash flow recovery and margin stabilization.
Open the company's financial profile ASML →
See also: market overview · valuation map · stock screeners