Bank of America: revenue accelerates to +19.3%, but net debt up 26.4bn over the year
On July 14, 2026, Bank of America reported Q2 2026 results. Revenue grew 19.3% YoY to $31,558 million, EBITDA rose 47.4% to $12,177 million, and net income increased 27.5% to $9,074 million. At the current price, the share looks rather attractive: growth is accelerating, margins are expanding, but debt is rising, which needs monitoring.
Key takeaways
— Q2 revenue grew 19.3% — the highest in the last five quarters
— EBITDA margin expanded from 31.2% to 38.6% — the best in the period under review
— Net income rose 27.5%, but lagged EBITDA growth due to higher provision expenses
— Net debt increased by 26.4bn over the year, reaching 110.1bn
— Operating cash flow in Q2 was 29.0bn — positive for the third consecutive quarter
— ROE of 12.1% is below the average of the last four quarters
— The stock is in the 'US Financials (banks)' strategy on the portal — a fact, not a recommendation
Attractiveness
Key figures, USD bn
| Metric | Q2 2025 | Q2 2026 | Change |
|---|---|---|---|
| Revenue | 26.5 | 31.6 | +19.3% |
| EBITDA | 8.26 | 12.2 | +47.4% |
| Net profit | 7.12 | 9.07 | +27.5% |
| Operating cash flow | -9.13 | 29.0 | to profit |
| EBITDA margin | 31.2% | 38.6% | +7.4 pp |
| Net margin | 26.9% | 28.8% | +1.9 pp |
Q2 revenue grew 19.3% — the highest in the last five quarters
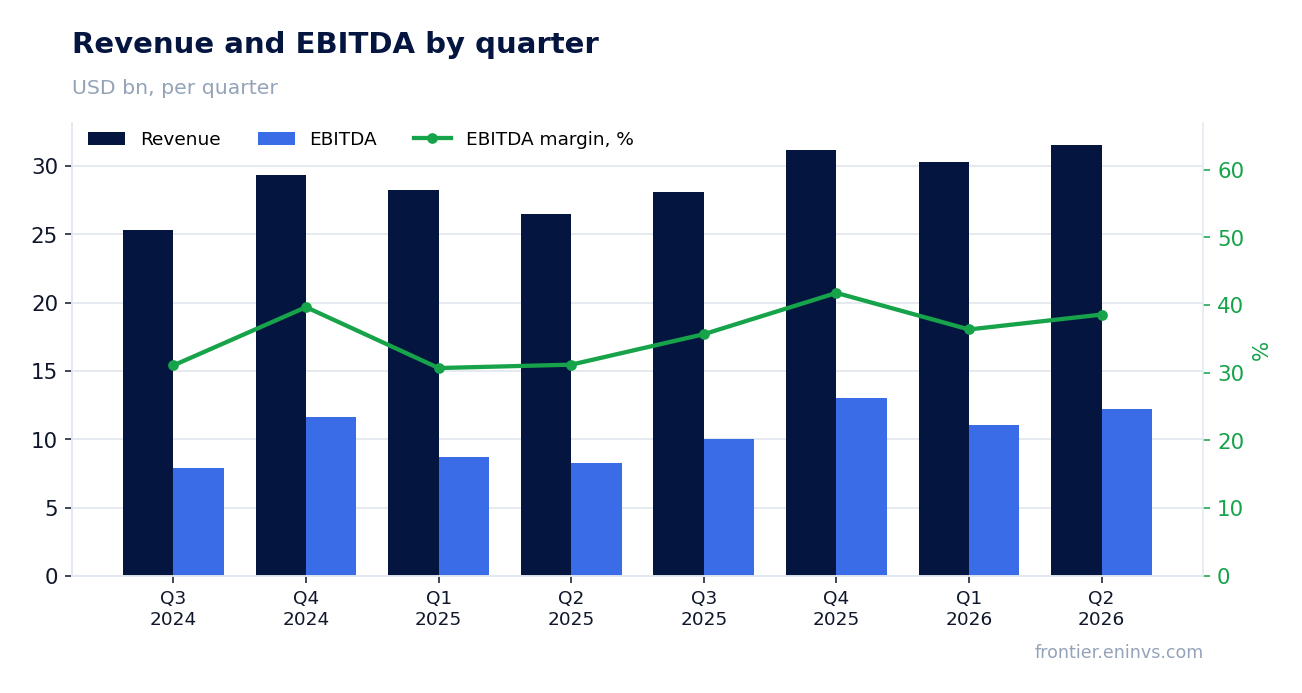
In Q2 2026, Bank of America's revenue reached $31,558 million, up 19.3% from a year earlier. This is the strongest annual pace since Q1 2025, when growth was 9.4%. Over the previous four quarters, growth ranged from 4.3% to 10.8%, so the acceleration is clear.
The main driver was net interest income, which rose from $14,670 million in Q2 2025 to $15,997 million in Q2 2026. Noninterest income grew even faster, from $12,773 million to $15,561 million, helped by asset management fees and investment banking fees: their six-month total rose from $2,951 million to $3,979 million.
EBITDA margin expanded from 31.2% to 38.6% — the best in the period under review
EBITDA in Q2 2026 rose 47.4% YoY to $12,177 million, and the EBITDA margin increased from 31.2% to 38.6%. This is the highest margin level among all quarters presented in the report: in the previous four quarters, the margin ranged from 29.2% (Q2 2025) to 41.8% (Q4 2025).
The margin expansion is due to noninterest expenses growing slower than revenue: in the first half, they increased 6.3% (from $34,953 million to $37,158 million), while revenue grew 11.0%. The efficiency ratio improved from 62.8% to 60.1% over the six months.
Net income rose 27.5%, but lagged EBITDA growth due to higher provision expenses
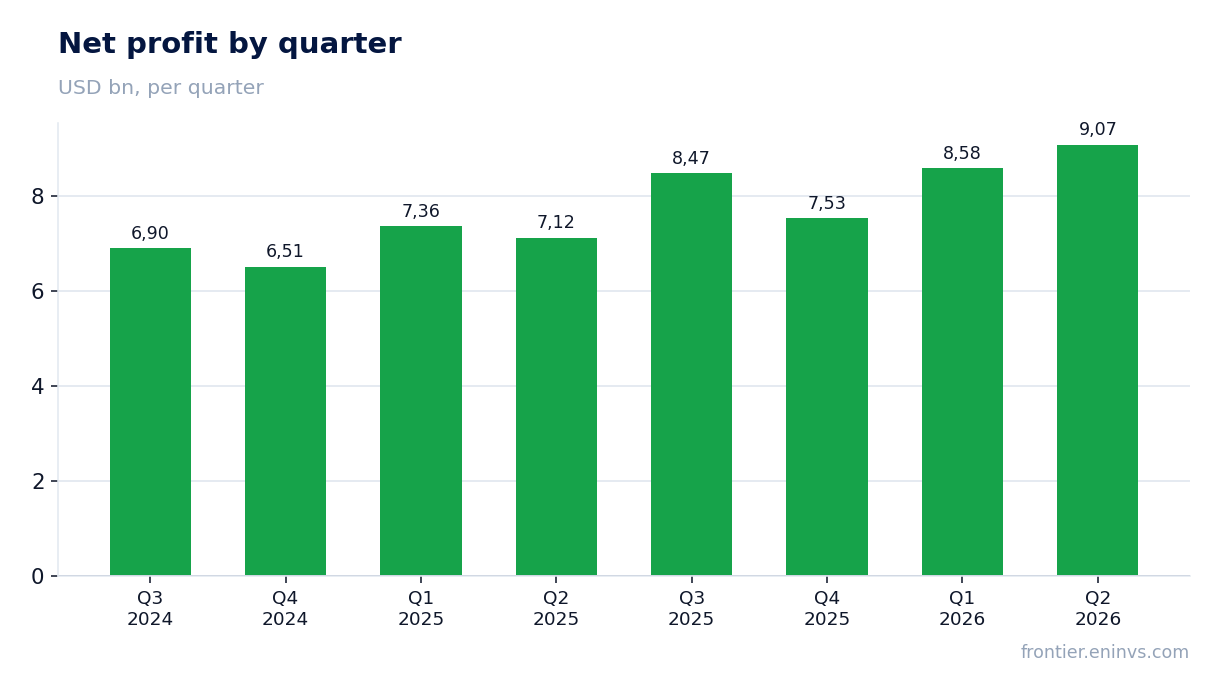
Net income in Q2 2026 was $9,074 million, up 27.5% from a year earlier. Profit growth lags EBITDA growth because of higher taxes: in the first half, income tax expense rose from $3,135 million to $4,311 million. Provisions for credit losses actually declined in H1 2026 to $2,703 million from $3,072 million a year earlier, which supported profit.
Net margin in Q2 2026 was 28.8% versus 26.9% a year earlier. Return on equity (ROE) for the trailing twelve months is 12.1%, below the average of the previous four quarters (around 12.5%), but still above the cost of capital for a large bank.
Net debt increased by 26.4bn over the year, reaching 110.1bn
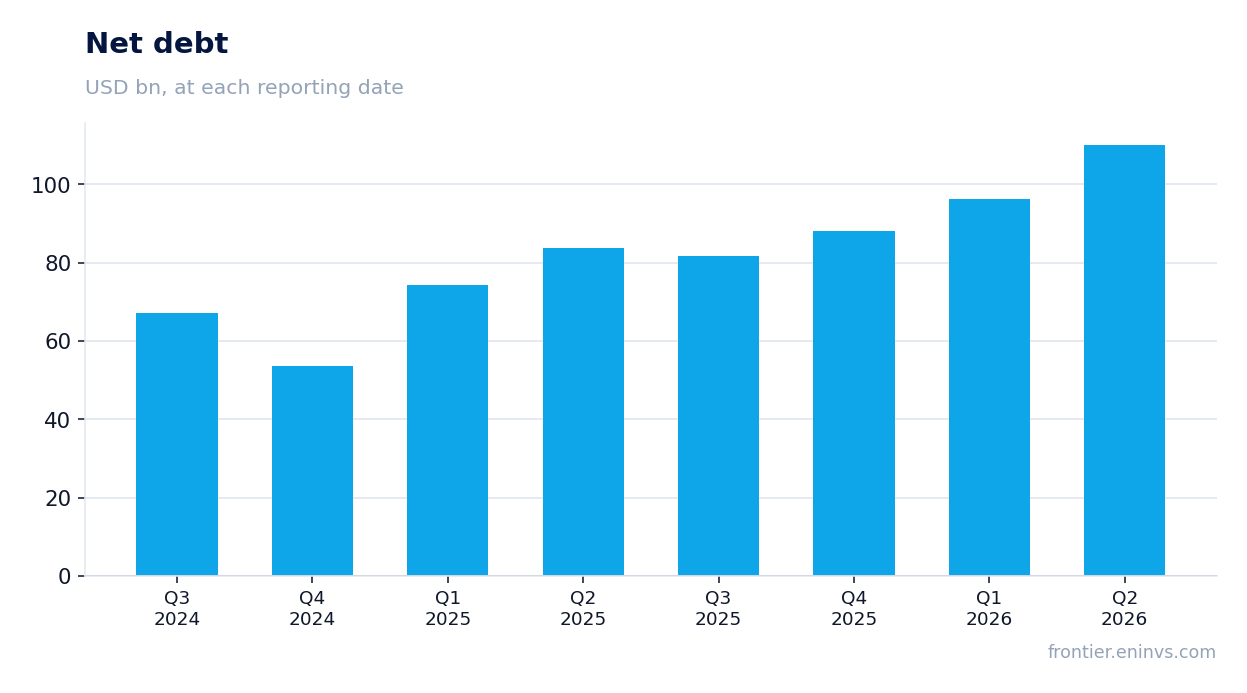
At the end of Q2 2026, Bank of America's net debt stood at $110,118 million. It increased by $13.9bn in the quarter and by $26.4bn over the last twelve months. The debt growth accompanies an expanding loan portfolio: loans and leases rose from $1,147bn to $1,218bn over the year.
The debt burden remains moderate for a bank of this size: the net debt to LTM EBITDA ratio is approximately 2.4 (calculated as 110,118 / 46,455). Nevertheless, the trend warrants attention: if debt continues to grow at the same pace, it could limit the capacity for dividend increases and share buybacks.
Operating cash flow in Q2 was 29.0bn — positive for the third consecutive quarter
Operating cash flow in Q2 2026 was $29,043 million. This is the third positive quarter in the last four: it was $46,874 million in Q3 2025, -$22,945 million in Q4 2025, $41,770 million in Q1 2026, and now $29,043 million in Q2 2026.
For a bank, operating cash flow largely reflects changes in client balances and counterparty positions, so its volatility is not a sign of trouble. Nevertheless, positive flow in three of the last four quarters indicates healthy liquidity.
ROE of 12.1% is below the average of the last four quarters
Return on equity for the trailing twelve months was 12.1%. For comparison, the quarterly return on average common shareholders' equity reported for Q2 2026 is 12.7% (annualized), and for H1 2026 it is 12.3%. The average over the last four quarters (Q3 2025 to Q2 2026) is approximately 12.5%.
An ROE of 12% is higher than many large banks, but lower than sector leaders that achieve 15–20%. For an investor, this means the bank generates returns above its cost of capital, but not exceptionally.
The stock is in the 'US Financials (banks)' strategy on the portal — a fact, not a recommendation
In our live model strategies on the portal, Bank of America's stock is included in the 'US Financials (banks)' strategy. This means the stock passes that strategy's screen according to its own criteria. Membership in the strategy is not an argument for buying or selling — it is a statement of fact.
Investors should rely on the fundamental metrics presented in this review and on their own investment decision.
Valuation on the latest reported figures
| Metric | Value |
|---|---|
| Operating cash flow (LTM) | 12.6 bn |
| ROE | 12.1% |
Bottom line
The strengths of the report are the acceleration of revenue growth to 19.3% – the highest in five quarters – and the expansion of the EBITDA margin to 38.6%. Net income rose 27.5%, helped by lower provisions. However, the increase in net debt of $26.4bn over the year and an ROE of 12.1% warrant a cautious stance. At the current price, the share looks rather attractive, but investors should monitor debt dynamics and credit quality.
Open the company's financial profile BAC →
See also: market overview · valuation map · stock screeners