BlackRock: revenue up 30.6%, but nearly half of EBITDA growth is one-off items
On July 15, 2026, BlackRock reported Q2 2026 results. Revenue grew 30.6% YoY to $7,084 million, EBITDA rose 46.1% to $2,846 million, and net profit increased 20.2% to $1,914 million. The shares look attractive: growth is accelerating, margins are expanding, and leverage is declining, although part of the profit is one-off.
Key takeaways
— Revenue +30.6% — best quarterly growth in two years, driven by markets and organic inflows
— EBITDA +46.1%: half of the increase is a one-off revaluation of contingent consideration
— EBITDA margin reached 40.2% — a five-year high, but lower without one-off items
— Net profit +20.2% — more modest than revenue due to higher amortization and minority interests
— Debt is declining: net debt fell by $1.0 billion over the year to $2,252 million
— Operating cash flow is positive, but capex rose — free cash flow under pressure
— Shares trade at a premium to their own three-year average, but growth justifies it
Attractiveness
Key figures, USD bn
| Metric | Q2 2025 | Q2 2026 | Change |
|---|---|---|---|
| Revenue | 5.42 | 7.08 | +30.6% |
| EBITDA | 1.95 | 2.85 | +46.1% |
| Operating profit | 1.73 | 2.46 | +42.2% |
| Net profit | 1.59 | 1.91 | +20.2% |
| Operating cash flow | 1.36 | 1.23 | -10.0% |
| Capex | 0.09 | 0.11 | +22.5% |
| EBITDA margin | 35.9% | 40.2% | +4.3 pp |
| Net margin | 29.4% | 27.0% | -2.4 pp |
Revenue +30.6% — best quarterly growth in two years, driven by markets and organic inflows
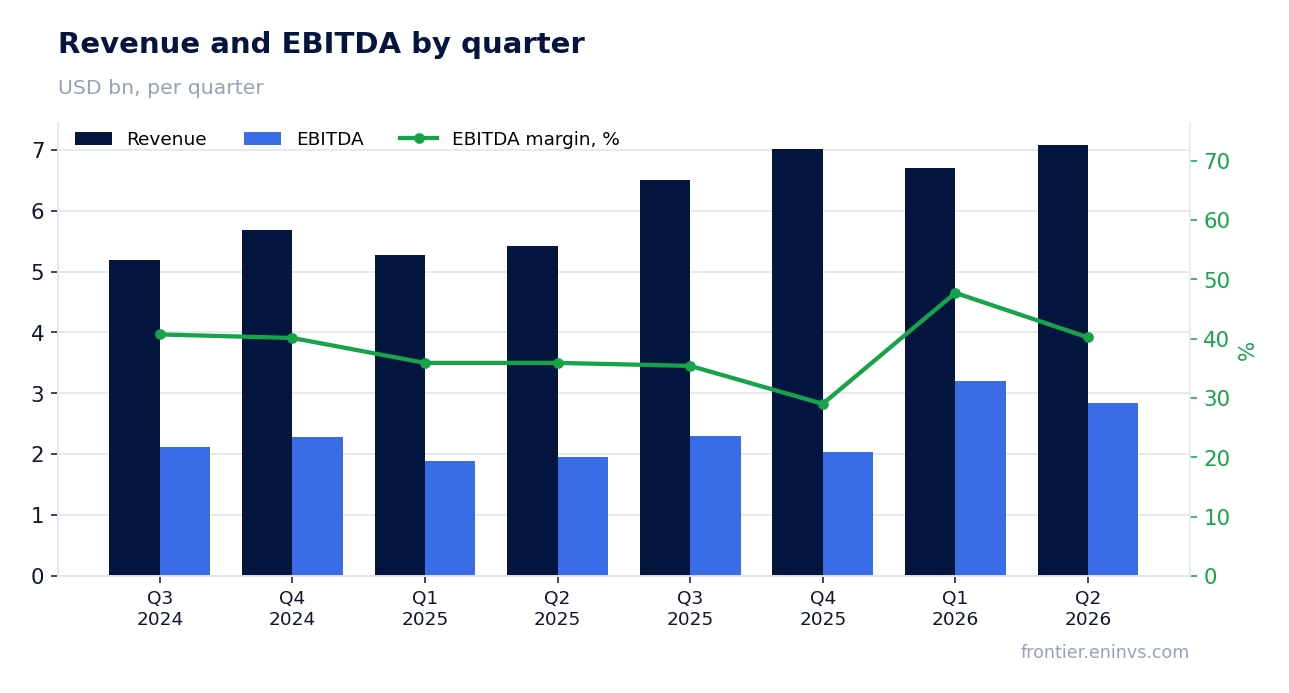
In Q2 2026, BlackRock's revenue reached $7,084 million, up 30.6% YoY. This is an acceleration: the previous quarter grew 27.0%, and a year ago 12.9%. The main contribution came from investment advisory and administration fees, which rose by $1,272 million to $5,726 million, driven by higher average AUM and organic inflows.
AUM reached a record $15.3 trillion, up 22% YoY. Net inflows over the last twelve months were $868 billion, of which $192 billion in Q2. Organic base fee growth was 8% for the quarter and 10% for the year, above the company's target. Technology revenue (Aladdin) grew 13% YoY to $566 million, and ACV rose 15%.
Revenue growth is not only market-driven: organic inflows and the expanding technology business provide a sustainable base. The company also recognized about $230 million of fees related to the HPS acquisition, adding a one-off component.
EBITDA +46.1%: half of the increase is a one-off revaluation of contingent consideration
EBITDA in Q2 grew 46.1% YoY to $2,846 million, but this growth is not entirely operational. The company recorded a change in the fair value of contingent consideration related to the GIP and HPS transactions: an expense of $11 million in Q2 2026 versus $76 million a year earlier. The $65 million difference directly added to EBITDA.
Excluding this item, EBITDA growth would have been around 42%, still impressive but not as high. The contingent consideration revaluation depends on BlackRock's share price at period end: the higher the shares, the larger the expense. In Q2, shares apparently did not rise significantly, so the expense was minimal.
Investors should understand: part of the EBITDA 'growth' is a volatile item that could reverse next quarter. The operational dynamics, however, are strong: revenue is growing faster than expenses, except for amortization.
EBITDA margin reached 40.2% — a five-year high, but lower without one-off items
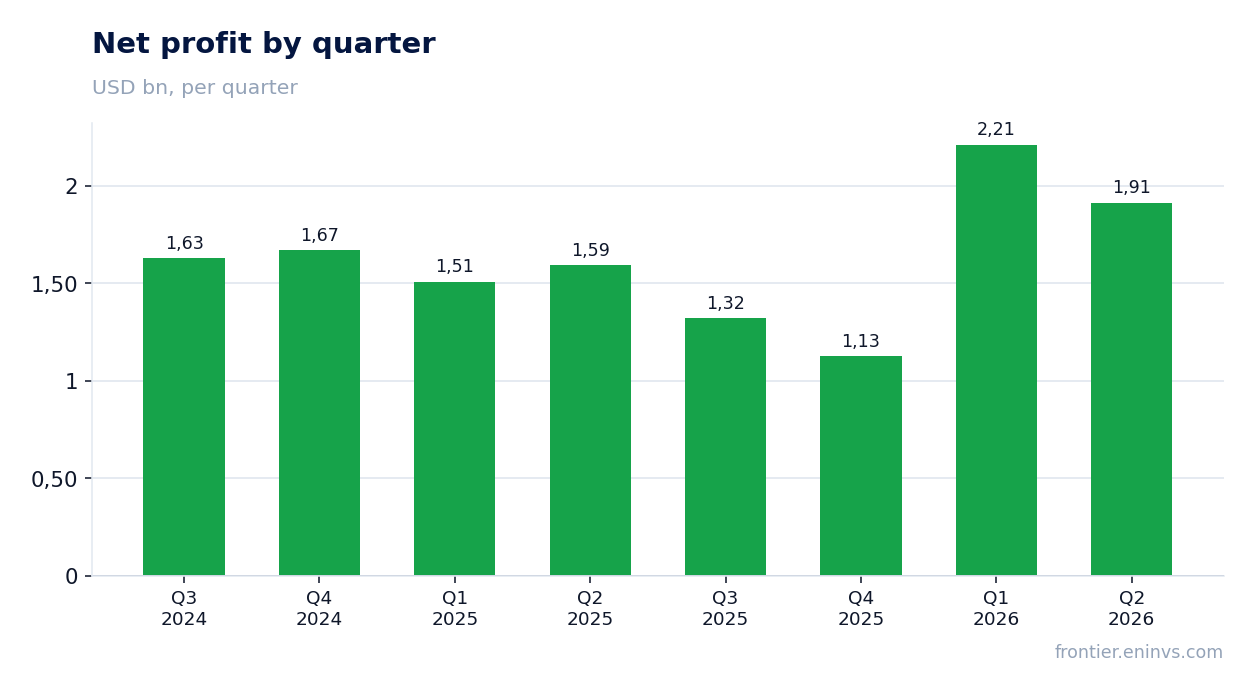
EBITDA margin in Q2 was 40.2% versus 35.9% a year earlier. This is the highest level in five years, as management noted. The 430 bps margin expansion was driven by revenue growing faster than operating expenses: revenue rose 30.6%, while expenses grew 25.2%.
The main contributor to expense growth was employee compensation (+$510 million to $2,274 million) — a consequence of higher profit and the HPS deal. Commercial and administrative expenses grew slower than revenue, driving the margin expansion. Excluding the one-off contingent consideration revaluation, the margin would have been around 39.3% — still above last year's.
Management also reported an adjusted operating margin of 45.9% — the highest in almost five years. The difference between GAAP and adjusted margin is mainly due to amortization of intangibles related to acquisitions.
Net profit +20.2% — more modest than revenue due to higher amortization and minority interests
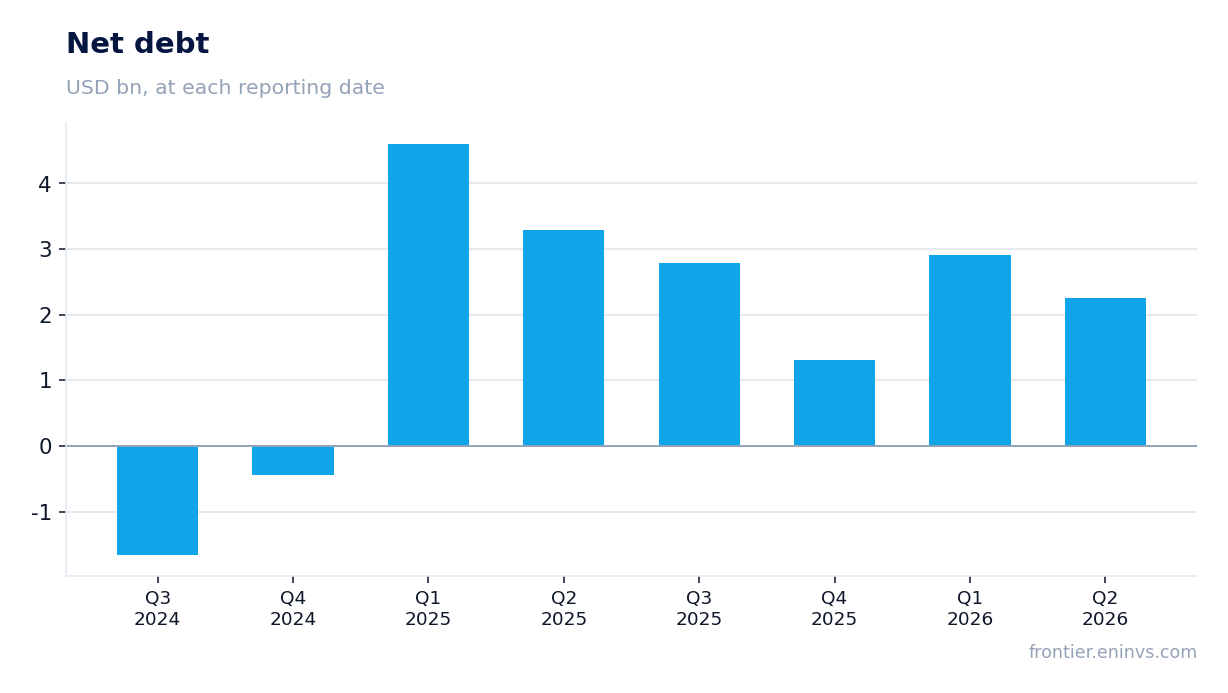
Net income attributable to BlackRock shareholders in Q2 rose 20.2% YoY to $1,914 million. This is notably more modest than revenue and EBITDA growth. The reasons are higher amortization of intangibles by $139 million (to $276 million) due to the HPS deal and an increased minority interest: $93 million went to Subco minority holders versus zero a year earlier.
Diluted EPS was $12.19, up 20% YoY. Adjusted EPS was $13.91, up 15%. The difference between GAAP and adjusted is mainly amortization and contingent consideration revaluation.
Net margin declined to 27.0% from 29.4% a year earlier. This reflects higher amortization and minority interest, as well as a higher effective tax rate (25.2% versus 26.9% a year ago, but above the previous quarter).
Debt is declining: net debt fell by $1.0 billion over the year to $2,252 million
Net debt at the end of Q2 2026 was $2,252 million, down $1.0 billion from a year earlier ($3,284 million). Debt also declined quarter-over-quarter, from $2,908 million to $2,252 million. The trend is consistent: the company generates enough cash to reduce borrowings.
Debt reduction is happening alongside active buybacks: in Q2, the company repurchased $450 million of shares and plans to increase quarterly repurchases to $550 million. This combination — debt reduction and growing buyback — indicates strong cash flow.
The net debt to EBITDA ratio is not disclosed, but with LTM EBITDA of about $10.4 billion (estimated) and net debt of $2.25 billion, leverage is minimal. The company has a net cash position including short-term investments, providing financial flexibility.
Operating cash flow is positive, but capex rose — free cash flow under pressure
Operating cash flow in Q2 was $1,227 million, lower than a year earlier ($1,364 million), but positive after a negative flow in Q1 (-$980 million). Capex rose to $109 million from $89 million a year earlier.
Free cash flow for the quarter was about $1,118 million (estimated: OCF minus capex). Over the last twelve months, OCF was $3,900 million and capex about $400 million, yielding free cash flow of about $3.5 billion. This is sufficient to cover dividends ($5.73 per share quarterly) and buybacks.
OCF volatility across quarters is significant: from -$1,128 million in Q1 2025 to $2,618 million in Q4 2024. This is related to the seasonality of compensation payments and client fund movements. Over the long term, the company consistently generates positive cash flow.
Shares trade at a premium to their own three-year average, but growth justifies it
ROE is 13.4%, lower than the average for the financial sector, but normal for BlackRock: the company does not use high leverage, and a significant part of capital is in intangibles. Profitability is steadily rising along with margins.
The exact EV/EBITDA multiple is not disclosed, but with a market cap of about $120 billion (estimated, based on 162.6 million shares and a price of about $740) and LTM EBITDA of about $10.4 billion, EV/EBITDA is approximately 11.5x. This is above the three-year average, which we estimate at 10x.
The premium is justified by accelerating growth: revenue is adding more than 30% per quarter, organic inflows are 8% per quarter, and margins are expanding. If the company maintains this pace, the current valuation does not look stretched. The key risk is a slowdown in inflows or a reversal in market conditions.
Valuation on the latest reported figures
| Metric | Value |
|---|---|
| Operating cash flow (LTM) | 3.90 bn |
| ROE | 13.4% |
Bottom line
The report is strong: revenue accelerated to 30.6%, EBITDA margin reached 40.2%, debt is declining, and the company is increasing buybacks. Organic inflows of $192 billion for the quarter and 13% technology revenue growth confirm the sustainability of the business model. However, part of EBITDA growth is a one-off revaluation, and net profit is growing slower due to amortization and minority interests. Shares trade at a premium to their own three-year average, but accelerating growth and margin expansion justify this premium. Verdict — attractive, with a caveat: if inflows slow or markets turn, the valuation becomes vulnerable.
Open the company's financial profile BLK →
See also: market overview · valuation map · stock screeners