CALIX, INC: record revenue and profit, but memory costs eat the margin and the stock trades at 29x EBITDA
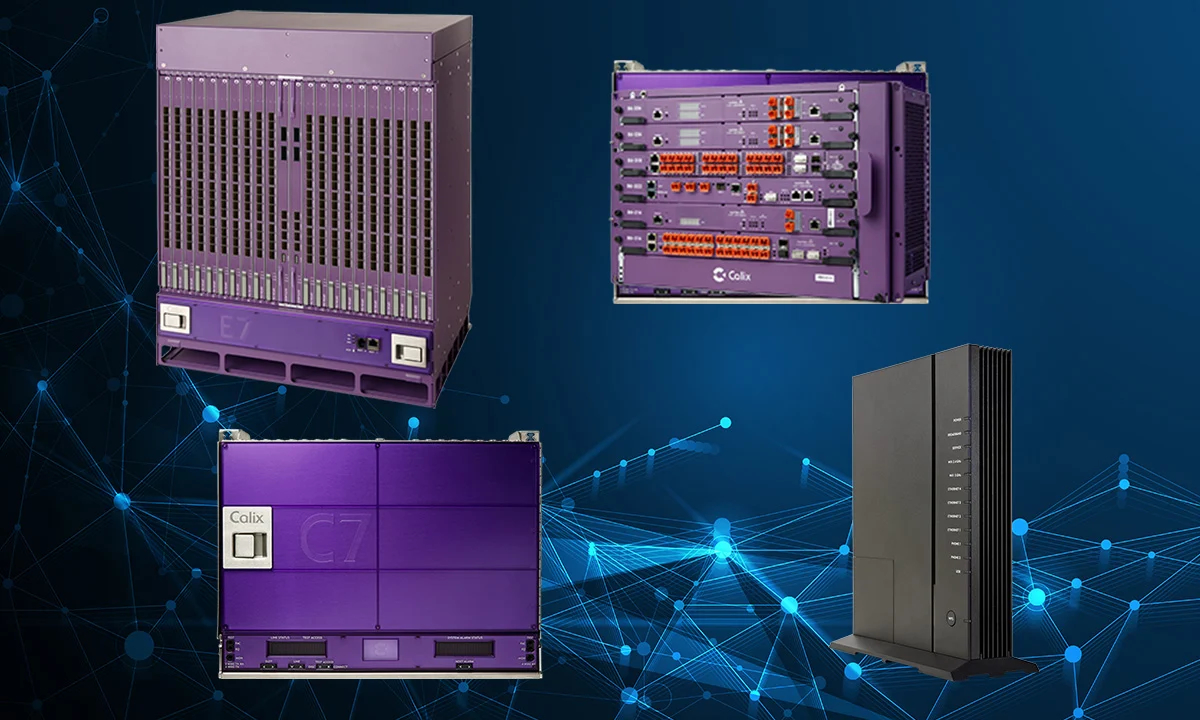
On July 20, CALIX, INC reported second-quarter 2026 results. Revenue hit a record $293.3 million, up 21.3% year over year, GAAP net income reached $17.1 million versus a $0.2 million loss a year earlier, and EBITDA rose to $26.3 million from $4.7 million. Growth was driven by the Calix One platform and a rebound in software demand, but the margin is being squeezed by rising memory costs, and an EV/EBITDA of 29.5x looks rich for a company with a 9% EBITDA margin. In our view, the stock is neutral: the strong operational turnaround is already priced in, and margin pressure will persist in coming quarters.
Key takeaways
— Revenue rose 21.3% year over year to a record $293.3 million, but growth is decelerating for a second consecutive quarter
— EBITDA jumped 5.5x to $26.3 million, yet the margin is only 9.0% – memory costs are eating profit
— Net income of $17.1 million versus a loss a year ago, but $16.7 million is non-cash stock-based compensation
— Free cash flow of $11.9 million with capex of $4.6 million – cash conversion is weak
— The company repurchased $69.4 million of stock, reducing cash and investments to $194.3 million
— Net debt is negative at $54.2 million, but EV/EBITDA of 29.5x is expensive
— Q3 guidance points to revenue of $301–307 million, but gross margin will fall to 50.5–53.5%
Attractiveness
Key figures, USD bn
| Metric | Q2 2025 | Q2 2026 | Change |
|---|---|---|---|
| Revenue | 0.24 | 0.29 | +21.3% |
| EBITDA | 0.00 | 0.03 | +454.8% |
| Operating profit | 0.00 | 0.02 | +5488.0% |
| Net profit | -0.00 | 0.02 | to profit |
| Operating cash flow | 0.04 | 0.02 | -58.1% |
| Capex | 0.00 | 0.00 | +22.6% |
| EBITDA margin | 2.0% | 9.0% | +7.0 pp |
| Net margin | -0.1% | 5.8% | +5.9 pp |
Revenue rose 21.3% year over year to a record $293.3 million, but growth is decelerating for a second consecutive quarter
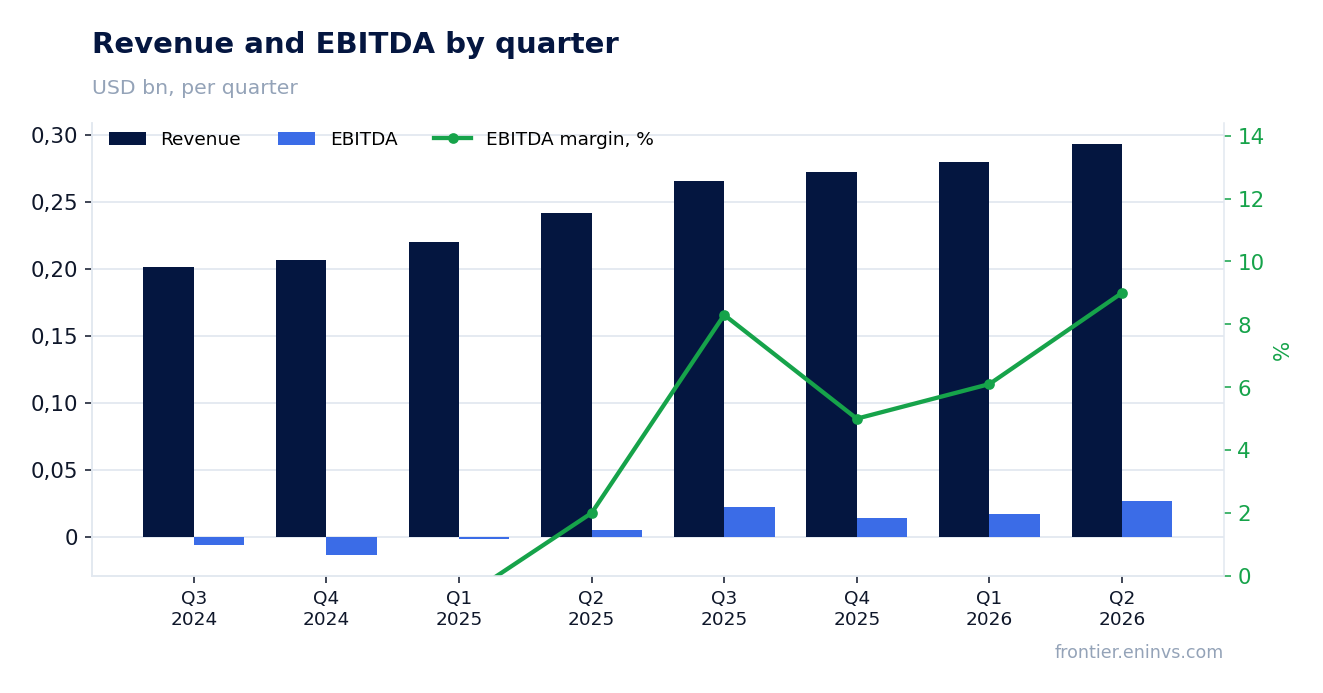
In the second quarter of 2026, CALIX, INC revenue reached $293.3 million, up 21.3% year over year and 4.8% sequentially. This is a record quarterly figure for the company. The main contributors were appliance sales – $242.8 million, up 23% year over year, and software and service revenue – $50.5 million, up 16% year over year.
However, growth is decelerating: in Q1 2026 revenue grew 27.1% year over year, and in Q4 2025 it grew 32.2%. The slowdown reflects a high base from last year, when the company completed migrating customers to its third-generation platform. In addition, the report notes that the introduction of surcharges at the beginning of the quarter delayed shipments, which affected revenue.
Geographically, the business remains almost entirely U.S.-focused: the U.S. share of revenue was 95%, up from 91% a year earlier. International revenue fell 32% year over year and accounts for only 5% of the total. The company added 14 new service provider customers and tripled the number of Calix One contracts compared with the previous quarter.
EBITDA jumped 5.5x to $26.3 million, yet the margin is only 9.0% – memory costs are eating profit
EBITDA in Q2 2026 was $26.3 million versus $4.7 million a year earlier, a 5.5x increase. However, in absolute terms this is only 9.0% of revenue – a low margin for a software company. A year ago the EBITDA margin was 2.0%, so the improvement is notable, but it is still far from the 20% operating margin target management mentions.
The main reason for the weak margin is the sharp rise in memory component costs. The report explicitly states that memory price increases driven by AI data center construction are pressuring the entire supply chain. The company introduced surcharges for customers to offset costs, but these do not add profit – they only recover expenses. Appliance gross margin fell to 52.8% from 57.4% in the previous quarter and 54.4% a year earlier.
Software and services showed better dynamics: gross margin in this segment rose to 63.0% from 54.3% in Q1 2026, but is still below 65.0% a year earlier. Management expects software margin to return to a record level in Q3. Total gross margin is guided to fall to 50.5–53.5% in Q3 due to continued memory price increases.
Net income of $17.1 million versus a loss a year ago, but $16.7 million is non-cash stock-based compensation
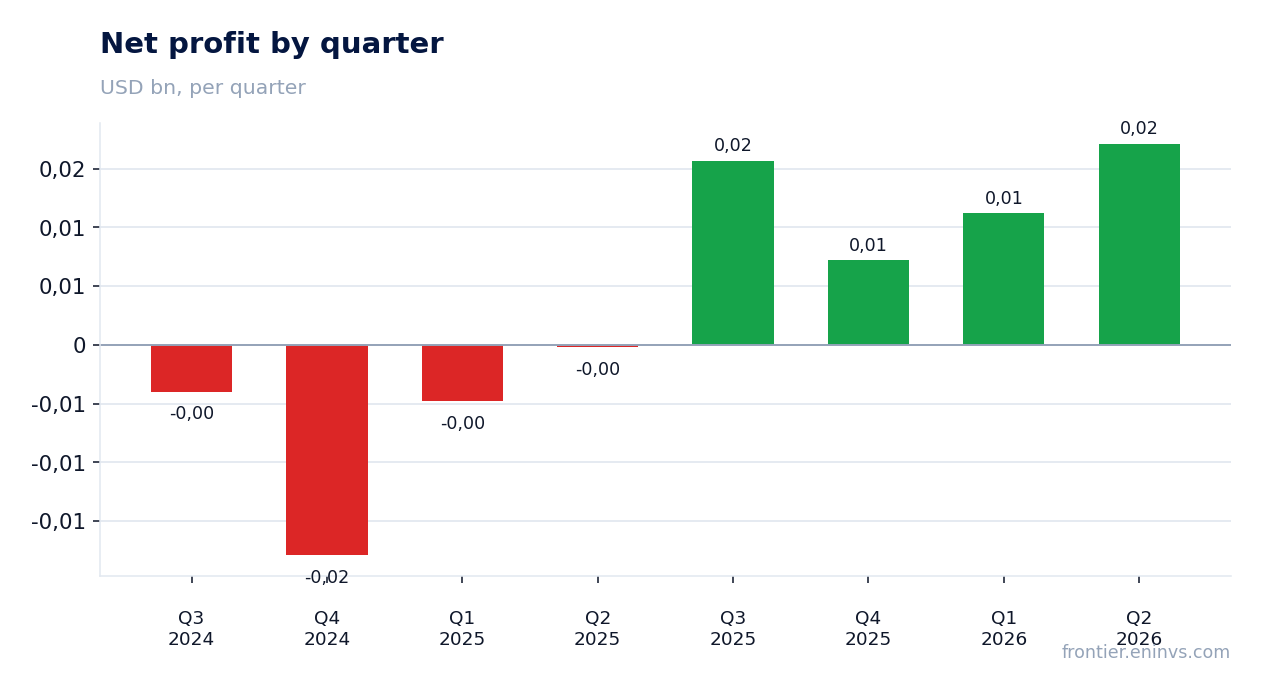
GAAP net income in Q2 2026 was $17.1 million versus a $0.2 million loss a year earlier. This is the third consecutive profitable quarter. However, a significant portion of the profit is non-cash: stock-based compensation expenses amounted to $16.7 million, almost equal to the entire net income. Excluding this item, non-GAAP net income would be $30.6 million.
Operating expenses declined by $8.3 million sequentially to $138.3 million, mainly due to lower stock-based compensation. Non-GAAP operating expenses fell by $4.7 million to $122.2 million, or 42% of revenue, versus 45% in the previous quarter. Management attributes this to lower incentive compensation, delayed program investments, and early productivity gains from AI deployment in internal processes.
Operating income was $21.8 million versus $0.4 million a year earlier. This is the first quarter with sustainable operating profit after a period of losses. However, it is worth noting that a year ago the company was still completing customer migrations, which weighed on results.
Free cash flow of $11.9 million with capex of $4.6 million – cash conversion is weak
Operating cash flow in Q2 2026 was $16.5 million, and free cash flow was $11.9 million after capital expenditures of $4.6 million. This is significantly lower than the previous quarter's free cash flow of $40.3 million and $35.6 million a year earlier. The weak conversion is due to rising inventories and accounts receivable.
Inventories rose to $180.5 million from $133.7 million at the end of 2025. The company attributes this to investments supporting demand and mitigating supply chain risks. Inventory turns fell to 2.7 from 3.0 in the previous quarter and 3.4 a year earlier – below the target range of 3–4. Days sales outstanding rose to 42 days from 36 in the previous quarter, linked to shipment delays from the introduction of surcharges.
Cash and investments declined to $194.3 million from $243.3 million at the end of Q1. The main reason was $69.4 million of stock repurchases. The company maintains a strong balance sheet, but free cash flow of $11.9 million is only 4% of revenue, which is low to support the buyback program in the long term.
The company repurchased $69.4 million of stock, reducing cash and investments to $194.3 million
In Q2 2026, CALIX, INC repurchased 1.6 million shares for $69.4 million. This is a substantial amount – about 2.9% of market capitalization. The remaining repurchase authorization is $94.1 million. The company consistently returns capital to shareholders but does not yet pay dividends.
The buyback is funded from cash flow and cash reserves. However, free cash flow of $11.9 million does not cover quarterly repurchases of $69.4 million, so the company is drawing down accumulated reserves. Cash and investments declined to $194.3 million from $243.3 million a quarter earlier. At the current pace of repurchases, reserves could be depleted within a few quarters if cash flow does not recover.
Management states it intends to return a significant portion of free cash flow to shareholders through buybacks. However, weak cash conversion and rising inventories could limit buyback capacity in the coming quarters.
Net debt is negative at $54.2 million, but EV/EBITDA of 29.5x is expensive
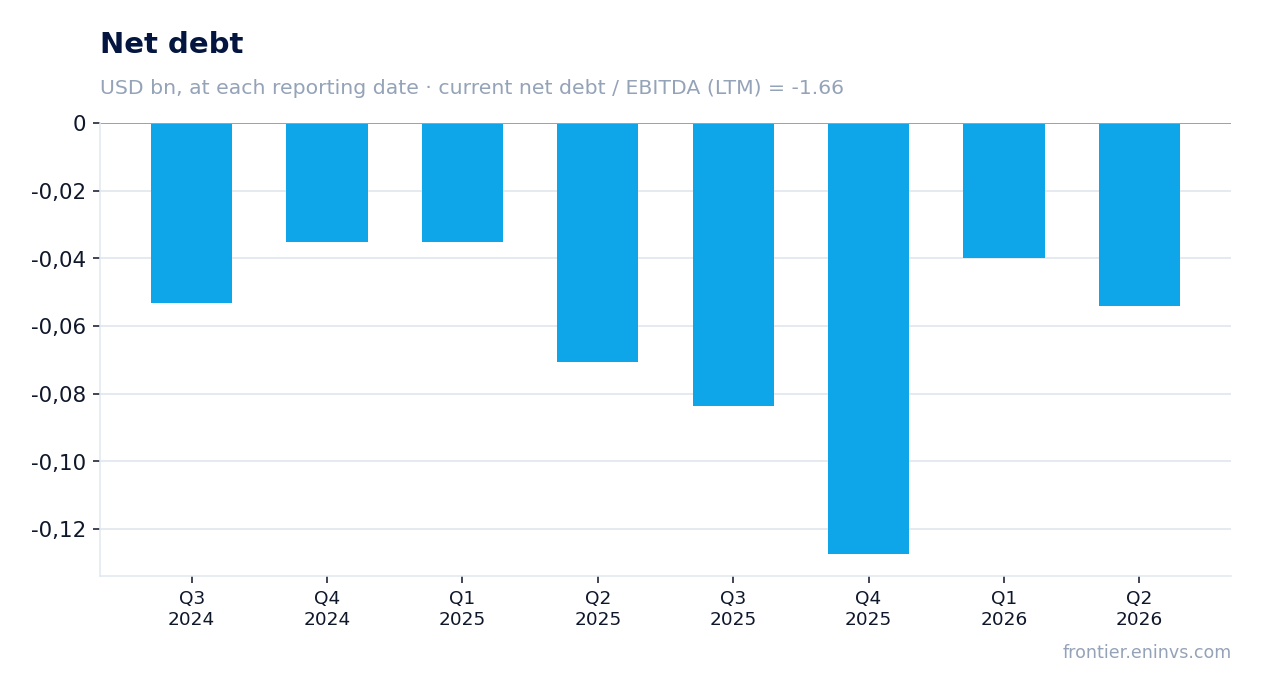
The company has negative net debt: at the end of Q2 2026, cash exceeded debt by $54.2 million. This provides financial stability but does not eliminate valuation concerns. The net debt to LTM EBITDA ratio is -1.66, meaning the company has a net cash position. This is a level, not a direction of change.
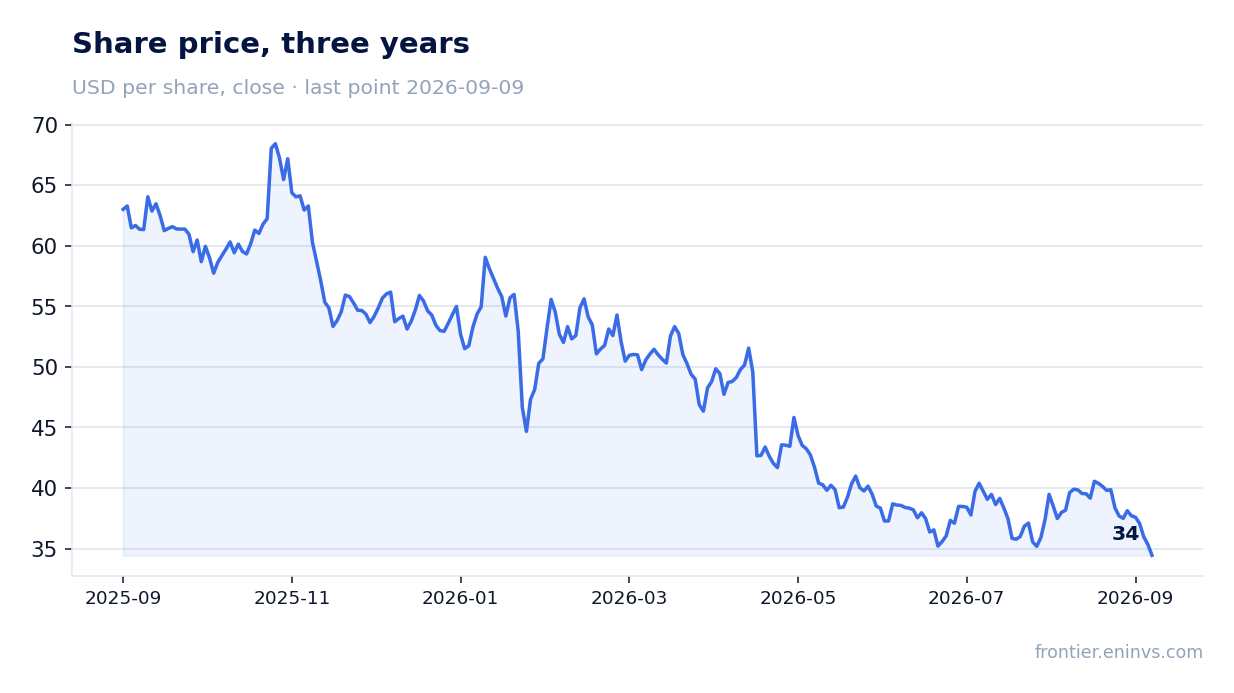
Market capitalization at the time of the report was $2,386.9 million. The EV/EBITDA LTM multiple is 29.5x, and P/E LTM is 46.6x. For a company with a 9.0% EBITDA margin and decelerating revenue growth, these multiples look high. The share price has fallen 12% since the report was published, which may reflect investor disappointment with the margin.
According to our model, the fair value of the share implies 22% upside to the current price. However, this estimate is based on EBITDA growth and a target multiple, and it is sensitive to margin dynamics. If margin pressure persists longer than expected, the estimate could be revised downward.
Q3 guidance points to revenue of $301–307 million, but gross margin will fall to 50.5–53.5%
For Q3 2026, the company guides revenue to $301–307 million, up 4% from the midpoint of the previous quarter. Year over year, this implies growth of about 15–17%. The guidance reflects demand, the effect of surcharges, and some reduction in orders from customers managing inventories.
However, gross margin is guided to fall to 50.5–53.5% from 54.8% in Q2. The reason is continued memory price increases. The company plans to raise surcharges for new orders, but this only partially offsets costs. Management expects software and services margin to return to a record level, but total margin will remain under pressure.
Operating expenses are guided at $123.5–125.5 million, up from the previous quarter due to expense timing and higher incentive compensation. The company expects full-year 2026 revenue to be at the high end of its 15–20% growth range. This implies maintaining double-digit growth, but with a slowdown in the second half.
Valuation on the latest reported figures
| Metric | Value |
|---|---|
| Market cap | 2.39 bn USD |
| P/E (LTM) | 46.6 |
| EV/EBITDA (LTM) | 29.5 |
| P/B | 2.78 |
| Net debt / EBITDA (LTM) | -1.66 |
| Operating cash flow (LTM) | 0.14 bn |
| ROE | 9.6% |
Bottom line
In Q2 2026, CALIX, INC delivered record revenue and returned to sustainable net income, but the quality of that profit is questionable: $16.7 million of the $17.1 million is non-cash compensation. Free cash flow remains weak at $11.9 million, and the $69.4 million buyback is funded from reserves. Margin is under pressure from rising memory prices, and further decline is expected in Q3. With EV/EBITDA at 29.5x and P/E at 46.6x, the stock looks expensive relative to its own history and current growth rates. Verdict: neutral – the strong operational turnaround is already priced in, and margin risks persist.
Open the company's financial profile CALX →
See also: market overview · valuation map · stock screeners