CATERPILLAR INC: quarterly revenue tops $20 billion for the first time, but shares trade at twice their three-year average multiple

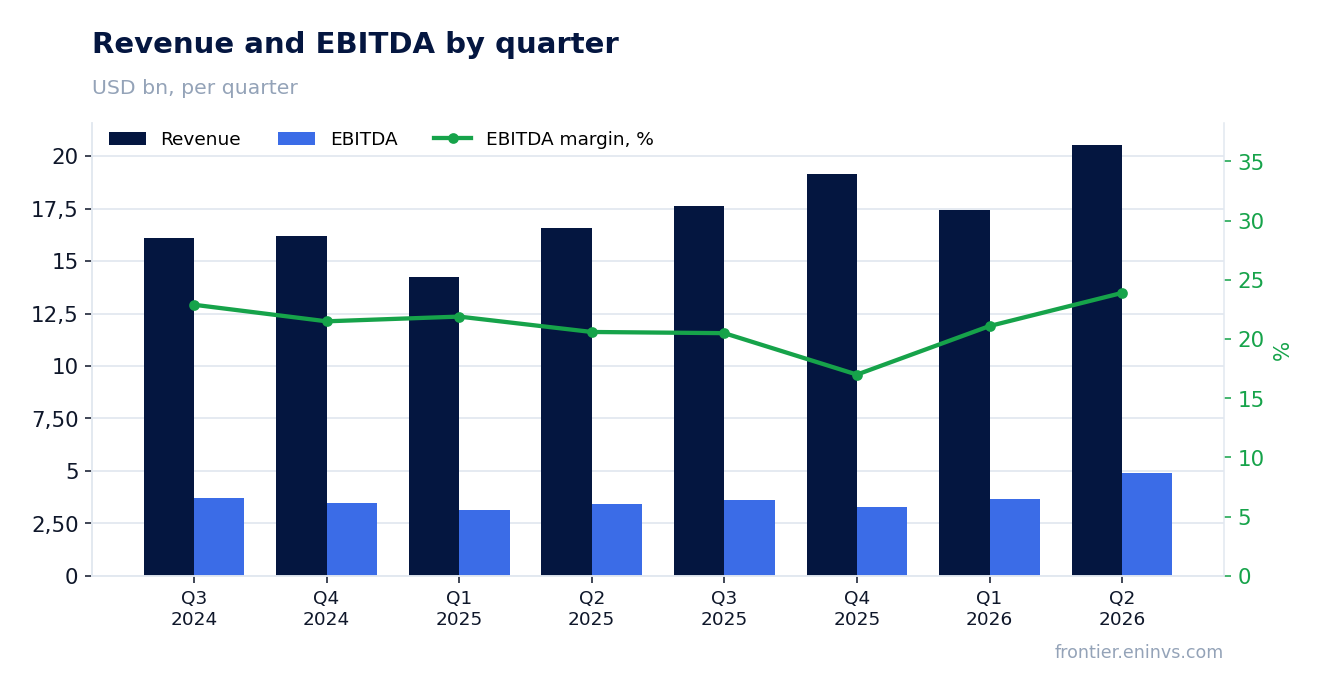
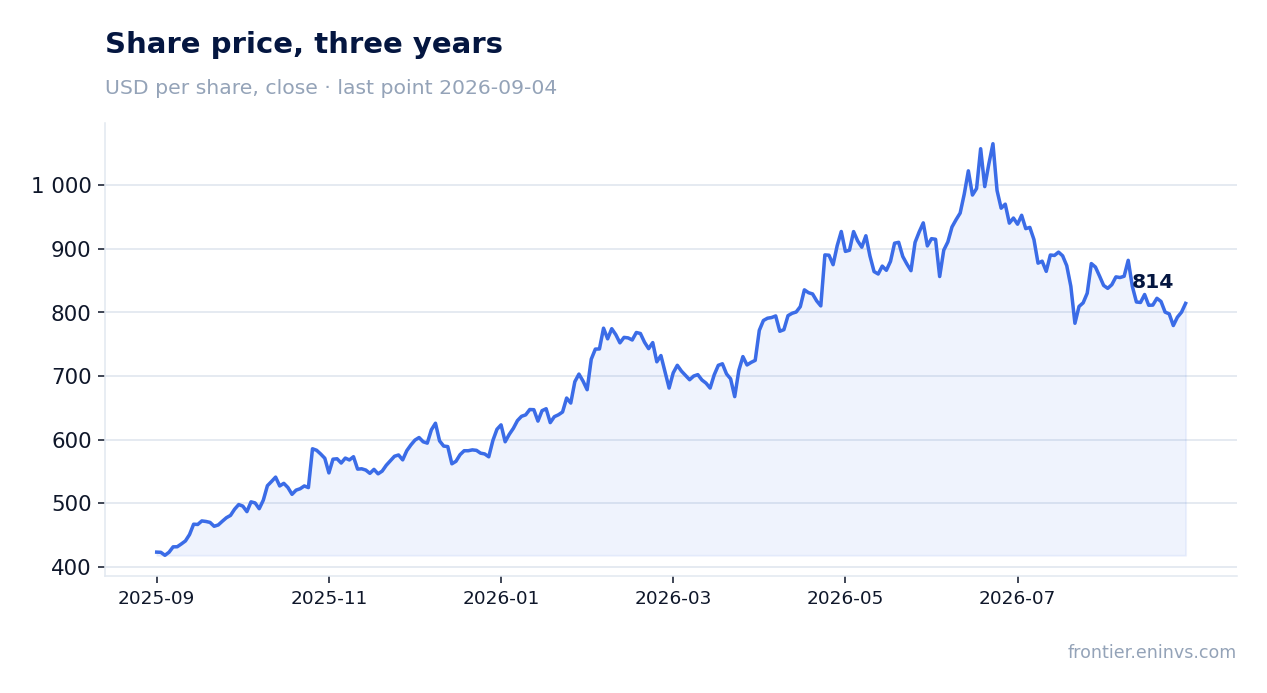
On August 4, 2026, Caterpillar Inc. reported second-quarter 2026 results: revenue rose 24% to $20.5 billion, EBITDA increased 43.8% to $4.9 billion, and net profit grew 64.9% to $3.6 billion. Growth accelerated across all segments, and margins expanded thanks to operating leverage and favorable pricing. At the current price, the share looks rather attractive: the business is growing at a record pace, but the valuation already reflects much of the good news.
Key takeaways
— Revenue exceeded $20 billion for the first time in a quarter, up 24% on volume and price
— EBITDA margin expanded to 23.9% from 20.6% a year earlier, helped by volume and price realization
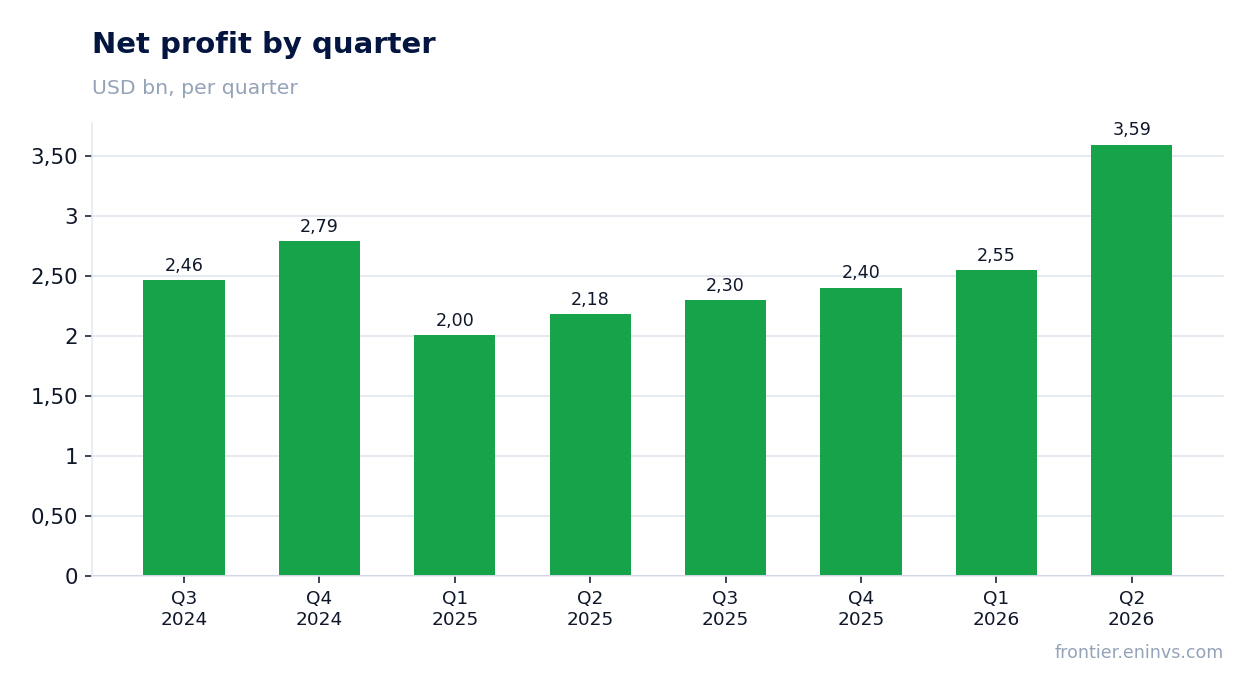
— Net profit rose 64.9% to $3.6 billion, including $392 million of expected IEEPA tariff recoveries
— Construction Industries grew 35% to $8.3 billion, leading the pace among all segments
— Operating cash flow for the quarter was $4.4 billion, supporting $2.2 billion of buybacks and dividends
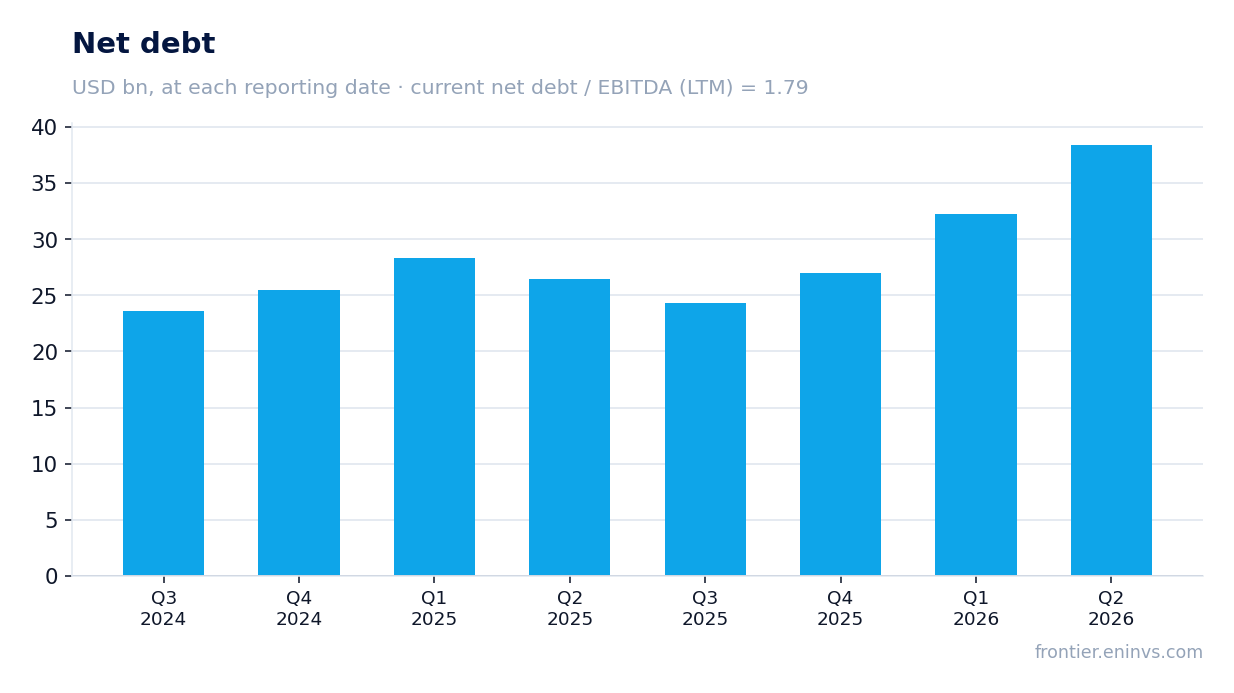
— Net debt rose $6.1 billion in the quarter to $38.4 billion, with net debt/EBITDA at 1.79
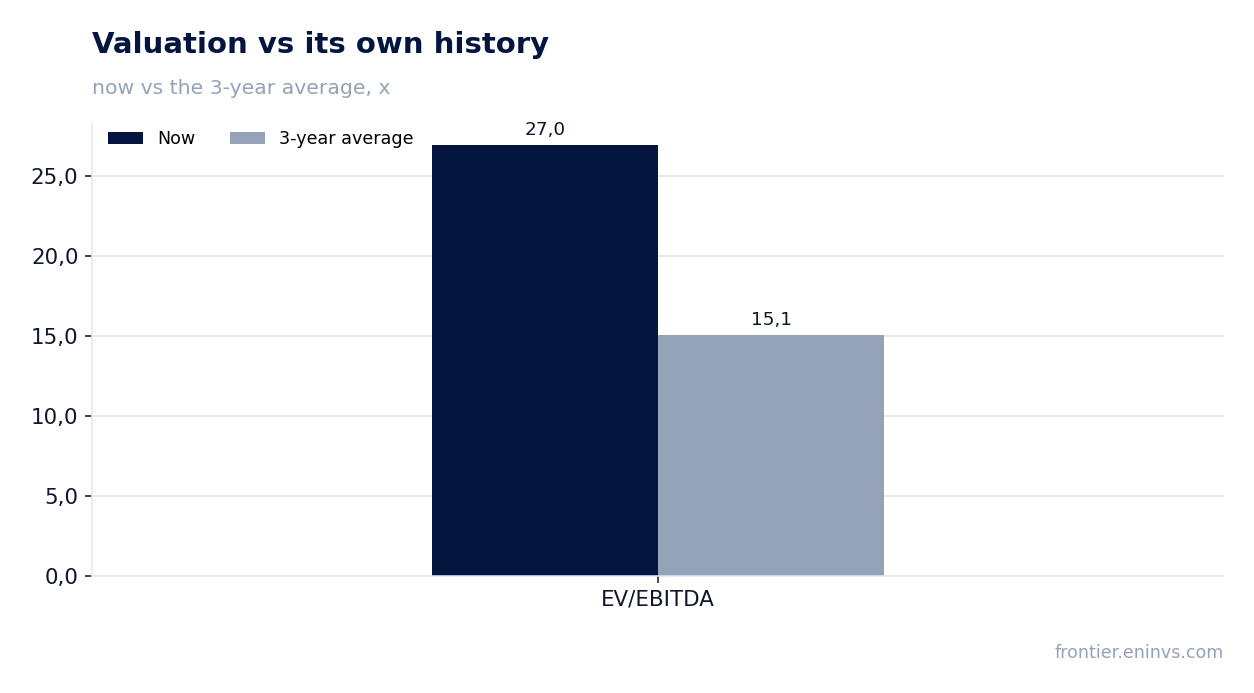
— Shares trade at an EV/EBITDA multiple of 27.0 versus a three-year average of 15.1
Attractiveness
Key figures, USD bn
| Metric | Q2 2025 | Q2 2026 | Change |
|---|---|---|---|
| Revenue | 16.6 | 20.5 | +24.0% |
| EBITDA | 3.41 | 4.91 | +43.8% |
| Operating profit | 2.86 | 4.29 | +50.2% |
| Net profit | 2.18 | 3.59 | +64.9% |
| Operating cash flow | 3.12 | 4.40 | +40.9% |
| Capex | 0.56 | 0.59 | +5.8% |
| EBITDA margin | 20.6% | 23.9% | +3.3 pp |
| Net margin | 13.2% | 17.5% | +4.3 pp |
Revenue exceeded $20 billion for the first time in a quarter, up 24% on volume and price
In the second quarter of 2026, Caterpillar Inc.'s revenue reached $20.5 billion, up 24% from a year earlier. The company surpassed the $20 billion mark for the first time in its history in a single quarter. The main contribution came from higher sales volume of $3.1 billion and favorable price realization of $595 million.
Growth was recorded across all three primary segments: Power & Energy rose 17%, Construction Industries 35%, and Resource Industries 20%. Geographically, North America grew the most (+37%), followed by EAME (+14%) and Latin America (+10%).
EBITDA margin expanded to 23.9% from 20.6% a year earlier, helped by volume and price realization
EBITDA for the reported quarter rose 43.8% to $4.9 billion, with an EBITDA margin of 23.9% versus 20.6% in the second quarter of 2025. Operating profit increased 50% to $4.3 billion, and operating margin rose to 20.9% from 17.3%.
The margin expansion is primarily explained by operating leverage: with revenue up 24%, operating costs rose only 18.5%. Favorable price realization provided additional support, directly improving profitability.
Net profit rose 64.9% to $3.6 billion, including $392 million of expected IEEPA tariff recoveries
Net profit for the second quarter of 2026 was $3.6 billion, up 64.9% from a year earlier. The reported profit included $392 million of expected IEEPA tariff recoveries, which the company recorded in operating profit. Excluding this one-off effect, profit growth would have been less pronounced but still significant.
Adjusted earnings per share were $8.17 versus $4.72 a year earlier. The effective tax rate was virtually unchanged at 23.1% versus 23.0%, indicating that profit growth was driven by operational factors rather than tax benefits.
Construction Industries grew 35% to $8.3 billion, leading the pace among all segments
Construction Industries' revenue rose 35% to $8.3 billion in the second quarter of 2026, the best result among all divisions. Sales grew in all regions: North America +50%, Latin America +25%, EAME +23%, and Asia-Pacific +3%.
Segment operating profit increased 57% to $1.9 billion, and margin expanded to 23.3% from 20.1%. The main driver was higher sales of equipment to end users, along with favorable price realization.
Operating cash flow for the quarter was $4.4 billion, supporting $2.2 billion of buybacks and dividends
In the second quarter of 2026, operating cash flow was $4.4 billion, up 41% from a year earlier. The company deployed $1.5 billion for share repurchases and $0.7 billion for dividends, totaling $2.2 billion. Capital expenditures for the quarter were $587 million, well below operating cash flow.
Over the trailing twelve months, operating cash flow reached $11.7 billion, providing comfortable coverage of both the investment program and shareholder distributions. The dividend yield over the last 12 months is 0.74%, below the market average, but the company is actively returning capital through buybacks.
Net debt rose $6.1 billion in the quarter to $38.4 billion, with net debt/EBITDA at 1.79
At the end of the second quarter of 2026, net debt stood at $38.4 billion, up $6.1 billion from the previous reporting date. Over the trailing twelve months, the increase was $12.0 billion. The rise in debt is related to active share repurchase programs and higher working capital.
Net debt to EBITDA for the trailing twelve months is 1.79 – a moderate level for an industrial company with stable cash flow. Absolute debt has increased, but operating cash flow allows servicing it without difficulty.
Shares trade at an EV/EBITDA multiple of 27.0 versus a three-year average of 15.1
The current EV/EBITDA multiple is 27.0, almost double the three-year average of 15.1. P/E over the trailing twelve months is 34.9. Market capitalization reached $378.7 billion.
Such a high valuation reflects investor expectations for continued record growth, but leaves little room for disappointment. According to the portal's model, the upside to fair value is +22%, suggesting that even at the current premium, the shares retain potential.
Valuation on the latest reported figures
| Metric | Value |
|---|---|
| Market cap | 379 bn USD |
| P/E (LTM) | 34.9 |
| EV/EBITDA (LTM) | 27.0 |
| P/B | 17.77 |
| Net debt / EBITDA (LTM) | 1.79 |
| Operating cash flow (LTM) | 11.7 bn |
| ROE | 75.5% |
| Dividend yield (12m) | 0.7% |
| EV/EBITDA, 3-year average | 15.1 |
Bottom line
Caterpillar Inc.'s second-quarter 2026 report was strong: revenue exceeded $20 billion for the first time, margins expanded, and cash flow remains abundant. However, part of the profit was supported by a one-off tariff recovery, and debt increased notably. At the current price, the share trades at a premium to its own history, but the portal's model indicates 22% upside potential. The verdict is rather attractive: the business shows a rare combination of accelerating growth and improving profitability, but investors should watch the sustainability of demand and debt dynamics.
Open the company's financial profile CAT →
See also: market overview · valuation map · stock screeners