Crown Castle: $8.4bn Fiber sale slashes debt, but revenue keeps falling

22 июля 2026 года Crown Castle раскрыла результаты за второй квартал 2026 года. Выручка продолжила снижение – на 4,9% год к году, до 1 008 млн долларов, EBITDA сократилась на 5,9%, но чистая прибыль выросла на 3,1% благодаря продаже Fiber-бизнеса, которая принесла 8,4 млрд долларов и позволила сократить чистый долг с 24,6 до 16,2 млрд. При текущей цене акции выглядят скорее непривлекательно: падающая выручка и высокая долговая нагрузка не компенсируются даже существенным снижением долга.
Key takeaways
— Продажа Fiber-бизнеса за 8,4 млрд долларов сократила чистый долг на 8,4 млрд долларов за квартал
— Выручка продолжает падать – минус 4,9% год к году во втором квартале 2026 года
— EBITDA маржа снизилась с 64,2% до 63,6% из-за роста операционных расходов
— Чистая прибыль выросла на 3,1% благодаря разовым доходам от продажи Fiber-бизнеса
— Операционный денежный поток за последние 12 месяцев составил 3,1 млрд долларов, но этого мало для обслуживания долга
— Компания сохраняет дивиденд на уровне 1,06 доллара на акцию в квартал, что требует значительной части денежного потока
Attractiveness
Key figures, USD bn
| Metric | Q2 2025 | Q2 2026 | Change |
|---|---|---|---|
| Revenue | 1.06 | 1.01 | -4.9% |
| EBITDA | 0.68 | 0.64 | -5.9% |
| Operating profit | 0.51 | 0.47 | -7.1% |
| Net profit | 0.29 | 0.30 | +3.1% |
| Operating cash flow | 0.83 | 0.53 | -36.2% |
| Capex | -0.04 | 0.06 | to profit |
| EBITDA margin | 64.2% | 63.6% | -0.6 pp |
| Net margin | 27.5% | 29.8% | +2.3 pp |
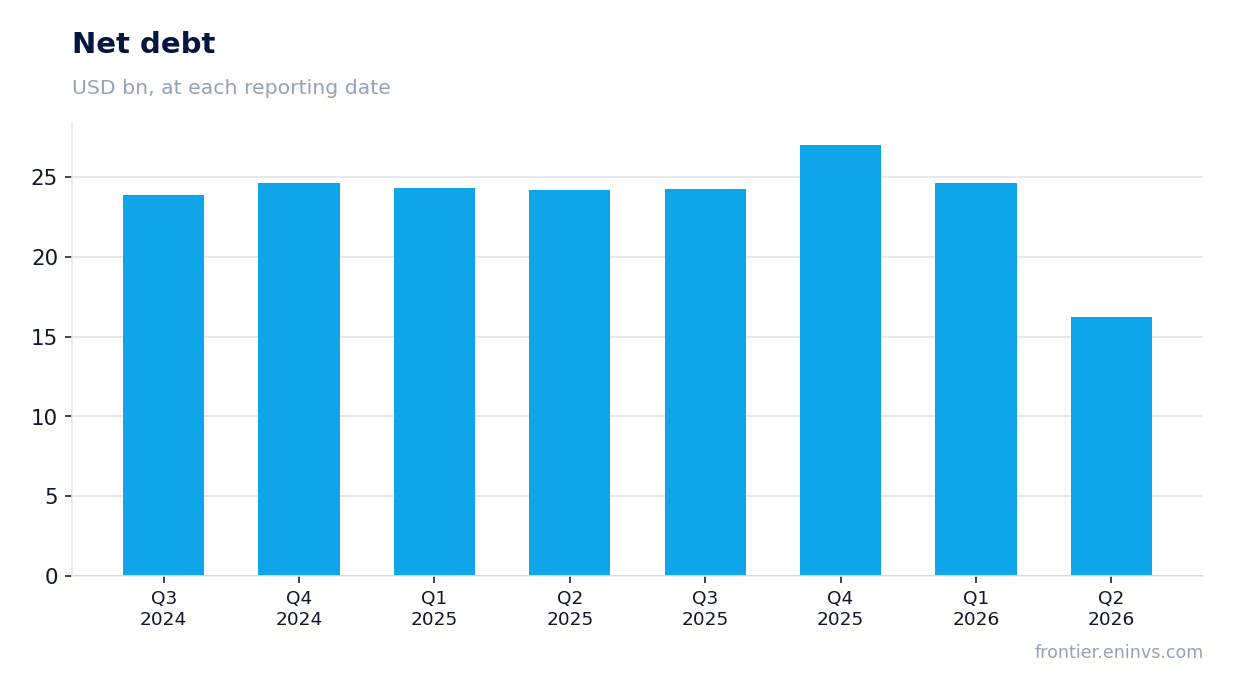
Fiber sale for $8.4bn cut net debt by $8.4bn in the quarter
In May 2026, Crown Castle completed the sale of its Fiber business (small cells and fiber solutions) for $8.4 billion in net cash proceeds. This deal was the quarter's main event: net debt fell from $24.6 billion at the end of Q1 to $16.2 billion at the end of Q2 – a reduction of $8.4 billion in one quarter.
The sale also changed the business structure: Crown Castle is now a pure tower company with one reportable segment. Fiber results through April 30, 2026 are presented as discontinued operations, which distorts year-over-year comparisons: Q2 2025 revenue included both Fiber and towers, while Q2 2026 includes only towers.
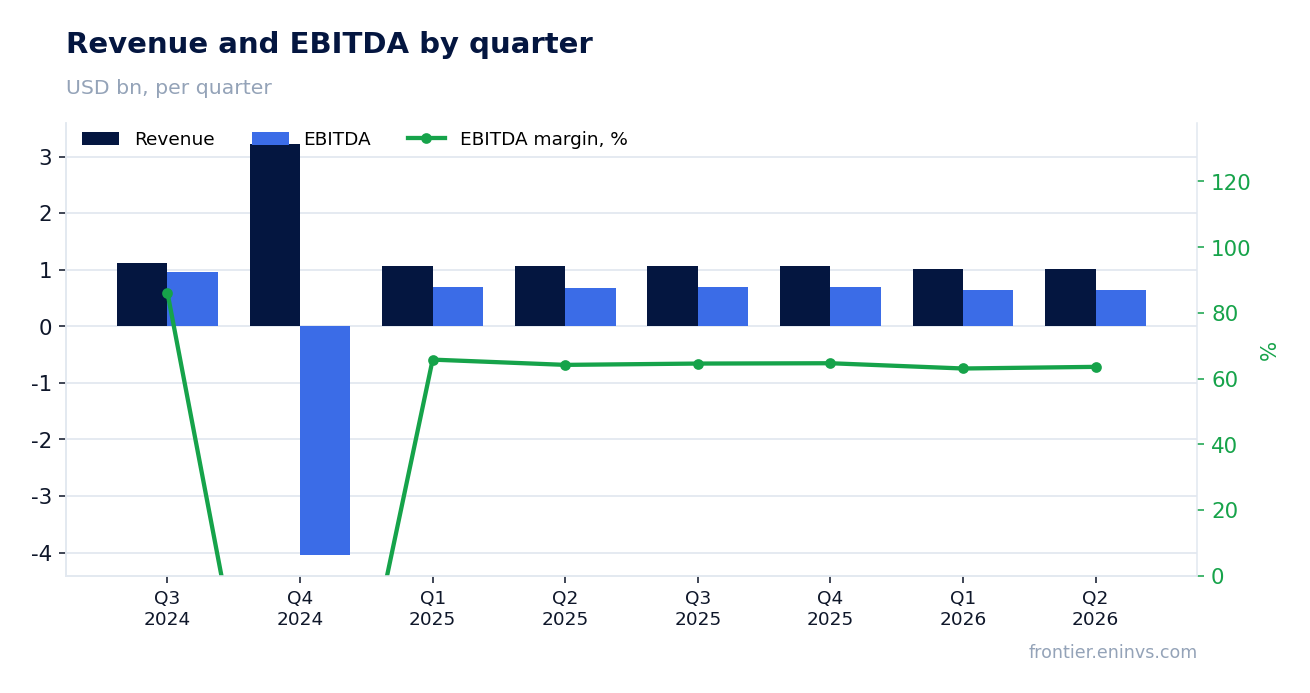
Revenue keeps falling – down 4.9% YoY in Q2 2026
Revenue in Q2 2026 was $1,008 million, down 4.9% YoY. This is the sixth consecutive quarter of decline: the pace has stayed in the 4–5% range (except Q4 2025, when the Fiber sale caused a 66.8% drop).
The main driver is the termination of DISH and Sprint contracts. The company reports that organic contribution to site rental billings (excluding DISH and Sprint) was $38 million in Q2, but including DISH terminations (–$49 million) and Sprint (–$5 million), the organic contribution turned negative at –$16 million. So even without one-offs, the underlying trend remains weak.
EBITDA margin fell from 64.2% to 63.6% on higher operating costs
EBITDA in Q2 2026 was $641 million, with a margin of 63.6% versus 64.2% a year earlier. The decline is small but telling: operating costs rose while revenue fell.
The report shows site rental costs of operations (exclusive of depreciation) rose from $251 million in Q2 2025 to $249 million in Q2 2026 – a decline of only $2 million, while site rental revenue fell by $41 million. SG&A expenses rose from $99 million to $97 million. As a result, operating profit fell from $506 million to $470 million.
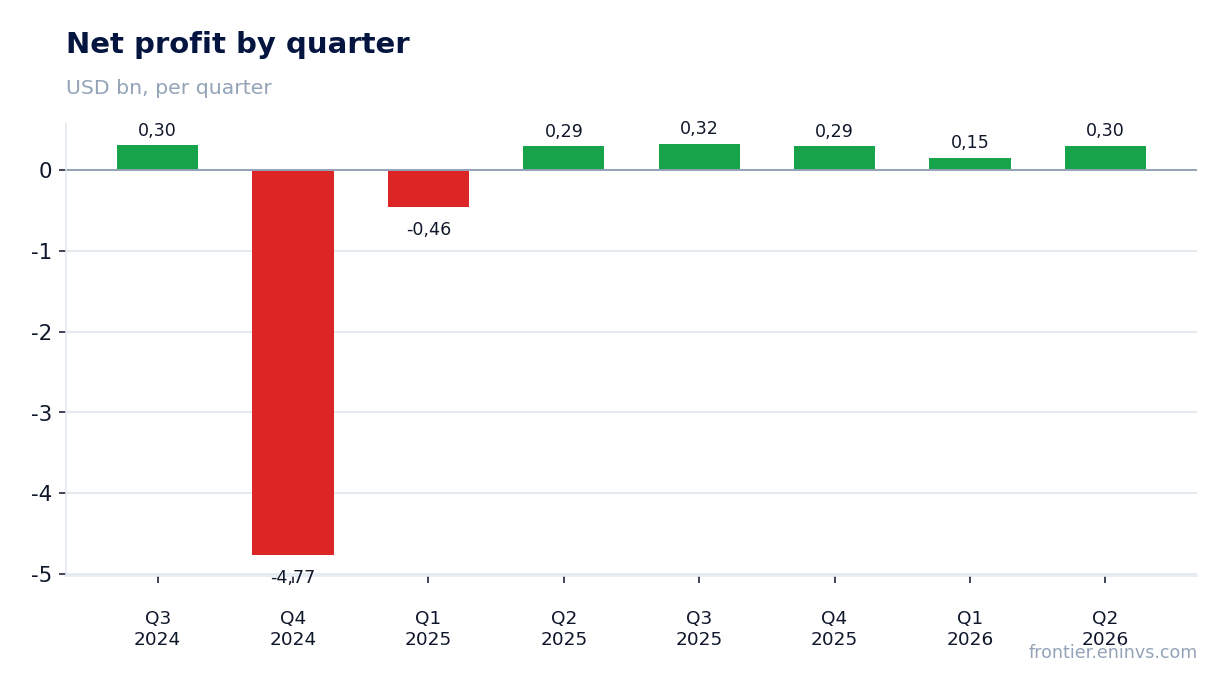
Net profit rose 3.1% thanks to one-off gains from the Fiber sale
Net profit in Q2 2026 was $300 million versus $291 million a year earlier – up 3.1%. However, this growth is not related to operations: operating profit fell 7%, and support came from one-off gains on the Fiber sale, recorded in discontinued operations.
Excluding these one-offs, profit from continuing operations would have been much lower. The report shows net income from continuing operations of $94 million in Q2 2026 versus $291 million in Q2 2025 (when Fiber was still included). Thus, the operating business is generating less and less profit.
Operating cash flow of $3.1bn over the last 12 months is insufficient to service debt
Over the last twelve months (LTM), Crown Castle's operating cash flow was $3.1 billion. This is a significant amount, but it goes to service debt: interest expense alone was $208 million in the last quarter, and about $800 million over the year.
Net debt at the end of Q2 2026 was $16.2 billion, or 6.3x last quarter annualized EBITDA (LQA Adjusted EBITDA). This is a high level for a REIT, although down from 9.4x a year earlier. The company retains access to $4.5 billion in credit lines, but free cash flow after capex and dividends remains limited.
The company maintains a dividend of $1.06 per share per quarter, consuming a large part of cash flow
In Q2 2026, Crown Castle paid dividends of $1.06 per share, as in previous quarters. With 426 million shares outstanding, this is about $452 million per quarter, or roughly $1.8 billion per year.
Annual operating cash flow of $3.1 billion covers dividends, but after capital expenditures (about $230 million per year) and interest expenses, little remains. The company pays out almost all free cash flow as dividends, limiting its ability to reduce debt or invest in growth.
Valuation on the latest reported figures
| Metric | Value |
|---|---|
| Operating cash flow (LTM) | 3.10 bn |
| ROE | -46.2% |
Bottom line
The quarter's main event was the $8.4 billion Fiber sale, which dramatically improved the balance sheet: net debt fell from $24.6 billion to $16.2 billion. However, the operating business continues to weaken: revenue has been falling for four consecutive years, EBITDA margin is contracting, and net profit rose only due to one-off gains. The dividend of $1.06 per share per quarter looks sustainable, but it consumes almost all free cash flow, leaving little room for investment or further debt reduction. At the current price, the shares trade at a multiple that does not reflect these risks, so we view the stock as rather unattractive. A change in view would require signs of revenue stabilization and sustained debt reduction.
Open the company's financial profile CCI →
See also: market overview · valuation map · stock screeners